The relation between albuminuria and coronary microvascular function in patients with chronic kidney disease (CKD) has not been fully investigated. Therefore, we sought to assess whether albuminuria is associated with coronary flow velocity reserve (CFVR) impairment in patients with CKD. Coronary flow study was prospectively performed in 175 patients with CKD. CFVR of the left anterior descending artery was measured to evaluate coronary microvascular function using transthoracic echocardiography. We divided the patients into 5 groups according to the stages of CKD and analyzed the effect of albuminuria. CFVR gradually decreased with an increase in CKD stages. CFVR in patients with albuminuria was lower than those without albuminuria. In groups with CKD stages 2 and 3, the patients with albuminuria showed lower CFVR than those without albuminuria. Multiple logistic regression analysis revealed that albuminuria, age, and gender were independently associated with CFVR impairment. Of these factors, albuminuria was the most powerful predictor with the risk ratio of 12.4 for CFVR impairment. In conclusion, the more the CKD stages progressed, the more severe CFVR was impaired. Albuminuria was associated with CFVR impairment in patients with CKD; even in mild-to-moderate CKD, patients with albuminuria showed further reduced coronary vasodilator capacity.
Patients with impaired glomerular filtration rate (GFR) are known to be at high risk for adverse cardiovascular events. In contrast, albuminuria is another major factor to define renal disease; in fact, albuminuria is also a potent independent marker of cardiovascular risk. Experimental evidence also suggests that microvascular endothelial dysfunction attributed by albuminuria participates in the mechanisms that lead to progression of atherosclerosis. Coronary flow velocity reserve (CFVR) has been considered as a functional diagnostic index for coronary stenosis. In patients with angiographically normal arteries, CFVR can be a marker of microvascular function. Reduced CFVR was observed in patients with impaired GFR by positron emission tomography. In addition, albuminuria was related to decreased CFVR by Doppler guide wire in small cohort. In consideration of these studies, coronary microvascular function may help to elucidate a link between renal dysfunction and cardiovascular disease. We sought to determine the influence of impaired GFR and albuminuria on coronary microvascular function in patients with chronic kidney disease (CKD) by transthoracic Doppler echocardiography.
Methods
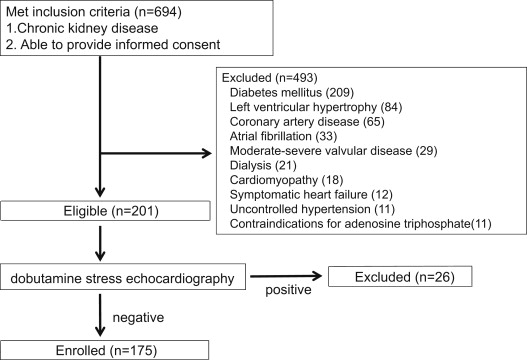
We prospectively recruited 175 patients with CKD, which is defined as either kidney damage or GFR <60 ml/min/1.73 m 2 for ≥3 months on the basis of Kidney Disease Outcome Quality Initiative clinical practice guidelines for CKD. Kidney damage includes pathologic abnormalities or markers of damage (nephrotic and nephritic syndromes, tubular syndromes, urinary tract symptoms, asymptomatic urinalysis abnormalities, radiologic abnormalities, and hypertension due to kidney disease) including abnormalities in blood or urine tests (cells, casts, and crystals) or imaging studies (collecting system, cysts, and stones). We classified them according to estimated GFR in the following ranges: at least ≥90 ml/min/1.73 m 2 (stage 1), 60 to 89 (stage 2), 30 to 59 (stage 3), 15 to 29 (stage 4), and <15 (stage 5). Albuminuria was defined according to Kidney Disease Outcome Quality Initiative clinical practice guidelines as total protein in a spot urine dipstick >30 mg/dl. Exclusion criteria included history of coronary artery disease, symptomatic heart failure, diabetes mellitus, uncontrolled hypertension, cardiomyopathy, moderate-to-severe valvular disease, left ventricular (LV) hypertrophy, atrial fibrillation, and contraindications for adenosine ( Figure 1 ). Diabetes was defined according to the American Diabetes Association criteria. Patients with clinic systolic blood pressure (BP) ≥140 mm Hg or diastolic BP ≥90 mm Hg were defined as having uncontrolled hypertension. Patients were divided into 2 subgroups on the basis of the presence (group A) or absence (group NA) of albuminuria. The control group comprising 15 healthy subjects (7 men, mean age: 65 ± 11 years) was studied as well. All participants gave written informed consent.
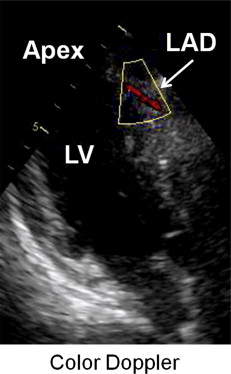
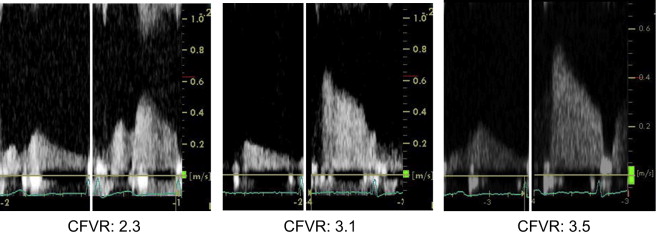
All echocardiographic examinations were performed with Vivid 7 (GE Healthcare, Milwaukee, Wisconsin) echocardiography system equipped with a 4-MHz transducer. LV ejection fraction and left atrial volume were calculated using the biplane modified Simpson’s method. LV mass was calculated using the 2-dimensional area-length method. Tissue Doppler imaging of the mitral annulus was obtained from the apical 4-chamber view, and the peak early tissue Doppler velocities of the medial and lateral mitral annulus were recorded and averaged. For coronary flow study, we recorded the baseline coronary flow velocity (CFV) of the left anterior descending coronary artery at end-expiration ( Figure 2 ), and consecutively adenosine triphosphate (0.14 mg/kg/min) was intravenously administered for 2 minutes. This allowed us to obtain the peak flow response induced by coronary microvessel dilatation. Heart rate and BP were recorded every minute during examination. CFVs were measured at the baseline and during hyperemia and averaged over 5 cardiac cycles. CFVR was defined as the ratio of mean diastolic CFV during hyperemia to that at the baseline. An experienced investigator, who was blinded to all other data, measured mean diastolic CFV (EchoPAC 6.1; GE Healthcare, Horten, Norway). Doppler flow velocity recordings of the representative cases in group A, group NA, and controls are shown in Figure 3 . To test the reproducibility of CFVR measurement, the CFV measurements at base and during hyperemia were repeated 2 days later in 20 patients who were randomly assigned. The intra- and interobserver variability for the CFVR measurement were 4.2 ± 3.7% and 4.1 ± 3.8%, respectively.
Differences between group A, group NA, and controls were evaluated using analysis of variance with post hoc Scheffe’s comparison for continuous variables and chi-square test for categorical variables. Multiple logistic regression analysis was used to test the independent relation of several variables to CFVR. Descriptive statistics are arithmetic means ± SDs. Statistical significance was accepted at p <0.05. All analyses were conducted using SPSS 13.0 (SPSS 13.0 for Windows; SPSS Inc., Chicago, Illinois).
Results
Of 694 patients with CKD, 175 patients were enrolled and underwent CFVR assessment ( Figure 1 ). Group NA was more likely to have men than group A and controls. Both group NA and controls were characterized by higher estimated GFR and lower serum creatinine than group A. The prevalence of dyslipidemia and smoking was similar among the 3 groups. The difference in high-sensitivity C-reactive protein among the 3 groups was not statistically significant. LV wall thickness, diameters, ejection fraction, and mass index were similar among the 3 groups. The ratio of early to late transmitral peak velocity (E/A) was higher in group A than group NA and controls, although deceleration time was similar among the 3 groups. The value of E′ was lower in group A than group NA and controls. Likewise, E/E′ in group A was increased compared with group NA and controls ( Table 1 ).
| Variable | Group A (n = 35) | Group NA (n = 140) | Controls (n = 15) |
|---|---|---|---|
| Age (yrs) | 69 ± 12 | 66 ± 13 | 65 ± 11 |
| Men | 31 | 66 ∗ | 47 ∗ |
| Estimated GFR (ml/min/1.73 m 2 ) | 45 ± 25 | 69 ± 19 ∗ | 75 ± 10 ∗ |
| Creatinine (mg/dl) | 1.5 ± 1.3 | 0.9 ± 0.2 ∗ | 0.7 ± 0.1 ∗ |
| Dyslipidemia | 17 (49) | 71 (51) | 4 (27) |
| Smoker | 9 (26) | 31 (22) | 5 (33) |
| High-sensitivity C-reactive protein (mg/dl) | 0.15 ± 0.1 | 0.12 ± 0.1 | 0.1 ± 0.8 |
| 2-Dimensional basic measurements | |||
| LV diastolic diameter (mm) | 43 ± 5 | 45 ± 4 | 45 ± 5 |
| LV systolic diameter (mm) | 28 ± 4 | 29 ± 4 | 29 ± 4 |
| Interventricular septum thickness at diastole (mm) | 9.3 ± 0.8 | 9.0 ± 1.0 | 9.1 ± 1.5 |
| Posterior wall thickness at diastole (mm) | 9.3 ± 0.9 | 9.2 ± 0.9 | 9.5 ± 1.1 |
| LV ejection fraction (%) | 62 ± 8 | 61 ± 5 | 60 ± 6 |
| Left atrial volume (ml/m 2 ) | 55 ± 20 | 53 ± 21 | 49 ± 19 |
| LV mass index (g/m 2 ) | 101 ± 29 | 94 ± 20 | 93 ± 21 |
| Doppler measurements | |||
| Early/late transmitral peak velocity ratio | 0.8 ± 0.2 | 0.9 ± 0.3 ∗ | 1.0 ± 0.3 ∗ |
| Deceleration time (ms) | 243 ± 62 | 242 ± 53 | 257 ± 55 |
| Mitral annular early diastolic peak velocity (cm/s) | 5.8 ± 1.6 | 7.3 ± 2.2 ∗ | 7.4 ± 2.1 ∗ |
| Transmitral/mitral annular early peak velocity ratio | 12.3 ± 4.0 | 9.4 ± 2.9 ∗ | 9.6 ± 2.4 ∗ |
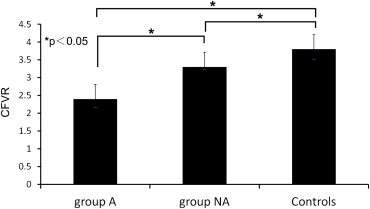
Group A showed higher CFV at baseline and lower CFV during hyperemia compared with other groups ( Table 2 ), consequently, CFVR of group A (2.4 ± 0.5) was lower than those of group NA and controls (3.3 ± 0.6 and 3.8 ± 0.4, respectively; Figure 4 ). Likewise, CFVR of group NA was lower than that of controls. With respect to CKD stages, CFVR decreased gradually with progressing CKD stages significantly. CFVR of stages 1 and 2 (3.5 ± 0.5 and 3.2 ± 0.7, respectively) were higher than those of stages 3, 4, and 5 (3.0 ± 0.6, 2.3 ± 0.6, and 1.9 ± 0.6). Stage 3 also had higher CFVR than stages 4 and 5 ( Figure 5 ). Regarding hemodynamic measurements, controls showed lower heart rate compared with group A. There was no significant difference in BP among the 3 groups. In mild-to-moderate CKD (stages 2 and 3), the patients with albuminuria had impaired CFVR compared with those without albuminuria ( Figure 6 , Table 3 ). In stage 2, baseline CFV of patients with albuminuria was similar to those without albuminuria, whereas hyperemic CFV with albuminuria was lower than those without. Similarly in stage 3, there was no significant difference in baseline CFV, and patients with albuminuria had a tendency of reduced hyperemic CFV. Regarding stage 4, there was no difference in both baseline and hyperemic CFV between patients with and without albuminuria. Analysis across CKD categories in patients with albuminuria revealed that baseline CFV of stage 5 was higher than that of stage 2 and lead to significantly impaired CFVR compared with stage 2. In analysis of those without albuminuria, CFVR in stage 4 was impaired compared with that in stages 1, 2, and 3.
| Variable | Group A (n = 35) | Group NA (n = 140) | Controls (n = 15) | |||
|---|---|---|---|---|---|---|
| Baseline | Hyperemia | Baseline | Hyperemia | Baseline | Hyperemia | |
| Heart rate (beats/min) | 70 ± 12 | 73 ± 13 | 63 ± 12 | 69 ± 13 | 59 ± 8 ∗ | 64 ± 11 |
| Systolic BP (mm Hg) | 121 ± 27 | 117 ± 19 | 119 ± 18 | 114 ± 21 | 115 ± 13 | 113 ± 14 |
| Diastolic BP (mm Hg) | 63 ± 14 | 60 ± 14 | 64 ± 13 | 59 ± 14 | 63 ± 9 | 59 ± 12 |
| CFV (m/s) | 21 ± 5 | 48 ± 13 | 18 ± 5 ∗ | 58 ± 17 ∗ | 16 ± 5 ∗ | 60 ± 16 ∗ † |
| CKD Stages | 1 | 2 | 3 | 4 | 5 |
|---|---|---|---|---|---|
| Group A | 0 (0) | 11 (35) | 11 (30) | 9 (24) | 4 (11) |
| Baseline CFV (m/s) | 18.3 ± 4.7 | 19.0 ± 4.0 | 23.2 ± 4.7 | 26.3 ± 4.5 † | |
| Hyperemic CFV (m/s) | 45.5 ± 12.1 | 45.4 ± 11.1 | 54.5 ± 17.0 | 47.8 ± 6.7 | |
| CFVR | 2.5 ± 0.4 | 2.4 ± 0.3 | 2.4 ± 0.7 | 1.9 ± 0.6 † | |
| Group NA | 16 (12) | 82 (59) | 38 (28) | 4 (1) | 0 (0) |
| Baseline CFV (m/s) | 18.1 ± 4.1 | 17.6 ± 4.4 | 17.8 ± 6.3 | 20.5 ± 4.4 | |
| Hyperemic CFV (m/s) | 63.6 ± 15.6 | 58.0 ± 15.6 ∗ | 55.2 ± 20.5 | 45.7 ± 10.5 | |
| CFVR | 3.5 ± 0.5 ‡ | 3.3 ± 0.7 ∗ ‡ | 3.1 ± 0.6 ∗ ‡ | 2.2 ± 0.2 |
Stay updated, free articles. Join our Telegram channel

Full access? Get Clinical Tree


