We examined temporal trends in mortality after myocardial infarction from 1985 to 2008 depending on admission glucose levels. We included 11,324 consecutive patients admitted to our intensive coronary care unit for myocardial infarction from 1985 to 2008. Patients were categorized into normal, mild, and severe hyperglycemia groups (admission glucose levels <140, 140 to 200, and ≥200 mg/dl, respectively). Temporal trends were determined using 3 groups: 1985 to 1990, 1990 to 2000, and 2000 to 2008. The prevalence of hyperglycemia increased from 26% in the 1980s to 49% in the 2000s. The prevalence of hyperglycemia primarily increased in patients without diabetes. Kaplan-Meier mortality was 4%, 8%, and 17% at 30 days and 64%, 71%, and 82% at 20 years in patients with normal, mild, and severe hyperglycemia, respectively. Compared with normal admission glucose level, adjusted 30-day mortality was 3.6-fold greater (95% confidence interval 2.9 to 4.3) in patients with severe hyperglycemia. This association was not dependent on diabetic status (p for interaction = 0.43) but was dependent on the decade of hospitalization with a stronger association from 2000 to 2008 (adjusted odds ratio 7.7, 95% confidence interval 5.4 to 11, p for interaction <0.001). Compared with diabetes, hyperglycemia was a better discriminator for 30-day mortality. Mortality at 30 days decreased from 1985 to 2008, however, it decreased less in patients with hyperglycemia compared with those with normoglycemia. In conclusion, elevated admission glucose levels are common in patients with myocardial infarction and are strongly associated with increased mortality. Mortality decreased less from 1985 to 2008 in patients with hyperglycemia compared with those with normoglycemia. Efforts that establish optimal treatment for these patients remain warranted.
Elevated glucose levels are common in patients hospitalized for acute myocardial infarction (MI), with a prevalence of about 40%. Although it has been established that hyperglycemia is associated with adverse outcome during hospitalization, only a limited number of studies have examined the long-term effects of hyperglycemia in MI. Also, the interplay between diabetes mellitus and hyperglycemia is still unclear. In addition, no previous study has reported on the changes in the effect of hyperglycemia on mortality during the last 25 years. Therefore, the aims of the present study were to (1) determine the association of hyperglycemia at admission with both early and long-term (≤20 years) mortality after MI, (2) assess the effect of hyperglycemia in patients with MI with diabetes versus those without diabetes, (3) compare the predictive value of hyperglycemia with that of diabetes for long-term mortality, and (4) study the changes in these relations over the last 3 decades.
Methods
We included all patients aged >18 years with a first admission for ST segment elevation myocardial infarction (STEMI) or non-STEMI to the intensive coronary care unit of the Thoraxcenter, Erasmus Medical Center from June 1985 to December 2008 with an available glucose level at admission.
The primary diagnosis of MI was made in the presence of the following characteristics: chest pain or equivalent symptoms in combination with dynamic electrocardiographic changes consistent with MI and a typical serial increase (to at least 3× the upper normal value) and decrease in serum biochemical markers of cardiac necrosis such as creatine kinase-MB or troponin T. Patients were diagnosed as having STEMI in the presence of ST segment elevation of >0.1 mV in ≥2 contiguous peripheral leads or >0.2 mV in ≥2 contiguous precordial leads and as having non-STEMI otherwise.
Trained physicians and nurses accustomed to the use of standardized case report forms collected the patient data. Definitions have previously been described.
Glucose value was determined on admission and was therefore nonfasting. As in the World Health Organization definition, we defined hyperglycemia as admission glucose levels of ≥140 mg/dl (7.8 mmol/L). Patients with hyperglycemia were further categorized into mild (140 to 200 mg/dl; 7.8 to 11.1 mmol/L) or severe hyperglycemia groups (≥200 mg/dl; ≥11.1 mmol/L), similar to ranges used by others previously. Patients were categorized as diabetic if diabetes has previously been diagnosed by a physician or when they received medication to lower blood glucose levels.
The study end point was all-cause mortality at 30 days and 20 years. Survival date was assessed through municipal civil registries that are updated regularly and therefore highly accurate in the Netherlands. Follow-up was available for 99% of all patients.
This project was carried out in accordance with current rules of ethics and legislature. The Ethical Committee of the Erasmus Medical Center waived the need for its approval because register-based studies do not require ethical approval according to the Dutch law.
Categorical variables are summarized as percentages and continuous variables as mean and SD. The chi-square test or Student t test was used to calculate p values, as appropriate. Cumulative survival curves according to glucose levels were constructed using the Kaplan-Meier method and compared by the log-rank test.
Logistic regression was used to model mortality at 30 days and Cox proportional hazards model to examine mortality during long-term follow-up. We separately investigated the independent association between admission glucose levels and mortality as well as that between diabetes and mortality. Adjustment was done for age, gender, previous MI, previous coronary artery bypass surgery, hypertension, hyperlipidemia, family history of coronary artery disease, smoking status, renal dysfunction, anemia, diagnosis (STEMI vs non-STEMI), and decade of hospital admission. A significant interaction term was found for 30-day mortality between admission glucose levels and the decade of admission (p <0.001) and for long-term mortality between admission glucose levels and diabetes (p = 0.012). Accordingly, additional analyses are presented according to the decade of admission and diabetes status.
Temporal trend analyses were performed by comparing decades of admission (i.e., 2000 to 2008 vs 1990 to 2000 vs 1985 to 1990) in patients with and without hyperglycemia. These strata were chosen according to important improvements in therapy, with complete introduction of thrombolytic therapy in 1990 and a substantial increase in the use of primary percutaneous coronary intervention since 2000. We used 10-year outcomes for comparing the influence of decades of admission on outcome.
Results are reported as odds ratios (OR; for 30-day mortality) and hazard ratios (for long-term mortality) and their respective 95% confidence intervals (CIs). All statistical tests were 2-tailed, and p values were considered significant at <0.05. Analyses were performed using SPSS software, version 20.0 (SPSS, Chicago, Illinois).
Results
We included 11,324 patients, of whom 4,671 (41%) had elevated admission glucose levels. On average, patients with hyperglycemia were 2 years older and were more often women compared with patients with normal glucose levels. Baseline characteristics and early medical management according to admission glucose levels are listed in Table 1 .
| Variable | Admission Glucose | p | ||
|---|---|---|---|---|
| Normal, n = 6,653 (%) | Mild Hyperglycemia, n = 2,917 (%) | Severe Hyperglycemia, n = 1,754 (%) | ||
| Age (yrs) | 61 ± 13 | 63 ± 12 | 63 ± 12 | <0.001 |
| Women | 26 | 28 | 35 | <0.001 |
| Previous MI | 35 | 29 | 29 | <0.001 |
| Previous PCI | 14 | 14 | 13 | 0.30 |
| Previous CABG | 10 | 9 | 8 | 0.021 |
| Hypertension | 35 | 37 | 39 | <0.001 |
| Diabetes | 7 | 16 | 45 | <0.001 |
| Dyslipidemia | 27 | 23 | 22 | <0.001 |
| Family history of CAD | 28 | 24 | 20 | <0.001 |
| Current smoker | 35 | 33 | 27 | <0.001 |
| Anemia ∗ | 23 | 26 | 27 | <0.001 |
| Renal dysfunction † | <0.001 | |||
| Normal | 29 | 29 | 22 | |
| Mild | 51 | 47 | 44 | |
| Severe | 20 | 24 | 34 | |
| STEMI | 52 | 65 | 66 | <0.001 |
| Reperfusion therapy ‡ | ||||
| Primary PCI | 48 | 57 | 54 | 0.08 |
| Thrombolytic therapy | 23 | 25 | 23 | 0.37 |
∗ Anemia was defined as a hemoglobin level of <12.0 g/dl in women and <13.0 g/dl in men.
† Normal: eGFR ≥90 ml/min; mild: eGFR 60 to 90 ml/min; and severe: eGFR <60 ml/min per 1.73 m 2 of body surface area.
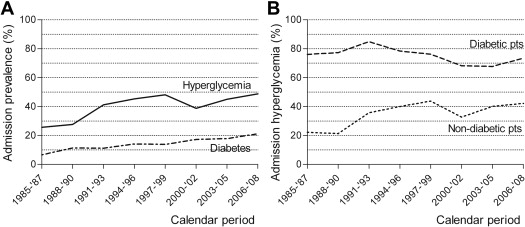
From 1985 to 2008, the prevalence of hyperglycemia at admission increased from 26% in the 1980s to 49% in the 2000s ( Figure 1 ). This increase was because of not only an increase in the prevalence of diabetes at admission (from 7% to 21%; Figure 1 ) but also an increase in hyperglycemia among patients without diabetes (from 22% to 42%; Figure 1 ). In those patients with diabetes, the prevalence of admission hyperglycemia remained rather constant during the entire study period (decreased from 76% to 73%; Figure 1 ).
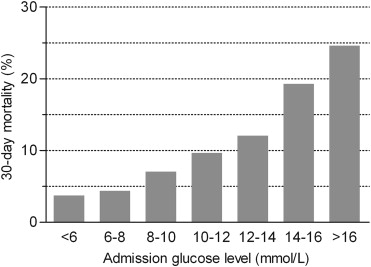
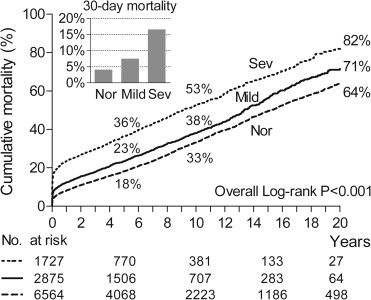
A total of 83,585 person-years were analyzed and, during this period, 4,449 patients died. There was a gradual increase in 30-day mortality with increasing admission glucose levels ( Figure 2 ). Kaplan-Meier 30-day mortality rates were higher in patients with mild (≥7.8 mmol/L) or severe (≥11.1 mmol/L) hyperglycemia (8% and 17%, respectively) compared with those of patients with normal admission glucose levels (mortality of 4%; Figure 3 ). This gradual increase in mortality remained unchanged after adjustment for potential confounders (adjusted OR 1.6, 95% CI 1.3 to 2.0 for mild hyperglycemia; adjusted OR 3.6, 95% CI 2.9 to 4.3 for severe hyperglycemia; Table 2 ). Interestingly, the association between hyperglycemia at admission and 30-day mortality was stronger in patients who were hospitalized from 2000 to 2008 (adjusted OR 2.1, 95% CI 1.5 to 2.9 for mild hyperglycemia; adjusted OR 7.7, 95% CI 5.4 to 11 for severe hyperglycemia; p for interaction <0.001) compared with that of patients hospitalized earlier.
| Variable | All Patients | Patients With Diabetes |
|---|---|---|
| 30-Day mortality ∗ | ||
| Hyperglycemia | ||
| Normal | Reference | Reference † |
| Mild | 1.6 (1.3–2.0) | 1.6 (0.79–3.1) |
| Severe | 3.6 (2.9–4.3) | 3.4 (1.8–6.2) |
| Diabetes | 1.2 (0.94–1.4) | NA |
| 20-Yr mortality ∗ | ||
| Hyperglycemia | ||
| Normal | Reference | Reference ‡ |
| Mild | 1.1 (1.1–1.2) | 0.88 (0.71–1.1) |
| Severe | 1.6 (1.5–1.8) | 1.3 (1.1–1.5) |
| Diabetes | 1.5 (1.3–1.6) | NA |
| 20-Yr mortality among 30-day survivors ∗ | ||
| Hyperglycemia | ||
| Normal | Reference | Reference § |
| Mild | 1.1 (1.0–1.2) | 0.83 (0.66–1.0) |
| Severe | 1.4 (1.3–1.5) | 1.1 (0.89–1.3) |
| Diabetes | 1.5 (1.4–1.7) | NA |
Stay updated, free articles. Join our Telegram channel

Full access? Get Clinical Tree


