Thrombospondin-1 and -2 (TSP-1 and -2) have been implicated in the regulation of angiogenesis, thrombosis, and inflammation, which are believed to be critical in the pathogenesis of cardiovascular events. The aim of this study was to assess whether serum TSP-1 and TSP-2 concentrations were associated with cardiovascular mortality in older men. A cohort of 992 elderly men was recruited between 2001 and 2004, and blood was collected for assessment of serum TSP-1 and TSP-2 by immunoassay. The men were followed by means of the Western Australia Data Linkage System until July 31, 2009. The association of TSP-1 and TSP-2 with mortality was assessed using Kaplan-Meier estimates and Cox proportional hazard analysis. Serum TSP-2 quartile was strongly positively associated with all-cause and cardiovascular mortality. Men with serum TSP-2 in the first, second, third, and fourth quartiles had a cumulative incidence of cardiovascular mortality of 3.3%, 8.0%, 9.7%, and 12.5% at 5 years, respectively, p = 0.001. Men with serum TSP-2 in the highest quartile had a 3.37-fold (95% confidence interval: 1.53–7.44, p = 0.003) increased risk of cardiovascular mortality after adjusting for other cardiovascular risk factors. Most deaths were secondary to cardiac causes, and serum TSP-2 was also independently associated with cardiac mortality (relative risk: 3.55, 95% confidence interval: 1.54–8.20 for men in the top compared with the lowest quartile). Serum TSP-1 was not associated with cardiovascular mortality. In conclusion, increased serum TSP-2 concentration is independently and significantly associated with the risk of cardiac mortality in older men.
Thrombospondins are a group of extracellular glycoproteins that are increasingly being implicated in mechanisms relevant to cardiovascular disease. Studies in animal models suggest that TSP-1 modifies atherosclerosis plaque stability. TSP-2 has a similar structure to TSP-1, but its functions are less certain. Recent studies in rodents suggest that TSP-2 may play an important role in the structural and functional integrity of the heart. TSP-2-deficient mice die at a younger age than wild-type mice due to dilated cardiomyopathy and are prone to cardiac rupture and heart failure when infused with angiotensin II. Thrombospondins have been studied less extensively in humans, although increased circulating concentrations of TSP-1 have been reported in patients with peripheral artery disease, cancers, rheumatoid arthritis, and scleroderma, but the studies have been mainly small and cross sectional, and the results inconsistent. We recently demonstrated lower concentrations of serum TSP-1 in patients who have abdominal aortic aneurysms (AAA). Increased circulating concentrations of TSP-2 have been associated with ischemic stroke and preeclampsia in small studies. Although these data suggest that there may be a role of TSP-1 and TSP-2 in the etiology and outcome of vascular diseases, to our knowledge, no longitudinal studies have assessed the association of circulating TSP-1 and TSP-2 with subsequent mortality. The aims of the present study were to determine whether serum concentrations of TSP-1 and TSP-2 were independently and significantly associated with cardiovascular mortality in a cohort of older men.
Methods
Subjects were recruited from the Health In Men Study (HIMS), which has been described in detail previously. This cohort comprised men who took part in a trial of ultrasound screening for AAA in 1996–1999, of whom a subset returned in 2001–2004 for blood sampling. We included 992 men of whom 305 had an AAA (aortic diameter ≥30 mm). We included all subjects with AAA for which serum was available and a random sample of 687 men who did not have an AAA. Ethics approval was granted from the Human Research Ethics Committee at the University of Western Australia, and all study participants gave their written informed consent.
Men completed questionnaires designed to assess past medical history and treatment at the time of blood sampling, and a nurse measured blood pressure as well as weight, height, and waist and hip circumference in accordance with guidelines of the International Society for the Advancement of Kinanthropometry. Diabetes and hypertension were defined by a history of diagnosis or treatment of diabetes or hypertension. Coronary heart disease was defined by a history of myocardial infarction, angina, or treatment for coronary artery disease. Previous stroke was defined by a previous history of any stroke. Smoking was defined by history as ever having smoked regularly or never having smoked regularly.
Blood samples were collected between 8:00 and 10:30 a.m . Serum was immediately prepared and stored at −80°C until assayed. Serum TSP-1 and -2 were measured with a commercial assay (R&D Systems, Minneapolis, Minnesota) by an experienced scientist unaware of the outcomes of the subjects. The interassay coefficient of variation was between 4% and 6%. Serum creatinine, low-density lipoprotein, and high-density lipoprotein were measured using automated assays (Hitachi 917, Roche Diagnostics GmBH, Mannheim, Germany) as previously described. Serum C-reactive protein was measured by a high-sensitivity assay, with the use of the particle-enhanced immunonephelometry system on the BNII analyzer as previously described. The interassay coefficient of variation for these assays was between 2.1% to 4.8%.
All men were followed from the time of recruitment until July 31, 2009, by means of the Western Australia Data Linkage System. Deaths due to cardiovascular diseases and cancers were identified from the Death Registry using International Classification of Diseases, Version 10 (ICD-10), codes in the ranges I00–I99 and C00–D48, respectively. Deaths secondary to cardiac causes were identified using ICD-10 codes in the ranges I20–I25 and I30–I52. The validity of data within the Western Australia linked Death Registry has been previously assessed and found to be good.
Quantitative data were not normally distributed and therefore were presented as median and interquartile range and compared by nonparametric tests. Nominal data were presented as number and percentages and compared by chi-squared test. The association of serum TSP-1 and TSP-2 with mortality was assessed using Kaplan-Meier estimates and Cox proportional hazard analysis. Cox proportional hazard analysis was adjusting for age, coronary heart disease, hypertension, diabetes, smoking, stroke, AAA, aspirin prescription, statin prescription, waist-to-hip ratio, low-density lipoprotein, high-density lipoprotein, C-reactive protein, and creatinine. For these analyses, men were grouped on the basis of serum TSP-1 and TSP-2 quartiles. Cumulative mortality was compared between quartiles using the log-rank test.
Results
Risk factors for the 992 men at the time of recruitment in relation to serum TSP-2 quartile are shown in Table 1 . Median follow-up for survivors was 5.9 years (range 4.9–7.7 years). Two hundred two deaths occurred during follow-up, of which 83 (41%) were due to cardiovascular causes. Most of the cardiovascular deaths were related to cardiac causes (n = 70, 84%). The all-cause, cardiovascular, and cardiac-related mortality rates were 2.1%, 1.4%, and 1.1% at 1 year, respectively, and 16.8%, 8.1%, and 6.9% at 5 years, respectively.
| Quartile | 1 | 2 | 3 | 4 | p Value |
|---|---|---|---|---|---|
| Serum TSP-2 (ng/ml) | <55.22 (n = 249) | 55.22–66.76 (n = 248) | 66.77–83.90 (n = 247) | >83.90 (n = 248) | <0.001 |
| Age (yrs) | 76.0 (74.0–79.0) | 77.0 (74.0–80.0) | 76.0 (74.0–80.0) | 76.5 (74.0–80.0) | 0.170 |
| Hypertension | 77 (31%) | 80 (32%) | 80 (32%) | 72 (29%) | 0.839 |
| Diabetes mellitus | 23 (9%) | 30 (12%) | 28 (11%) | 43 (17%) | 0.044 |
| Ever smoker | 169 (68%) | 174 (70%) | 177 (72%) | 191 (77%) | 0.136 |
| Coronary heart disease | 35 (14%) | 40 (16%) | 49 (20%) | 55 (22%) | 0.082 |
| Previous stroke | 18 (7%) | 17 (7%) | 15 (6%) | 17 (7%) | 0.964 |
| Abdominal aortic aneurysm | 59 (24%) | 84 (34%) | 71 (29%) | 91 (37%) | 0.007 |
| Statin | 91 (37%) | 100 (40%) | 95 (39%) | 102 (41%) | 0.727 |
| Aspirin | 106 (43%) | 111 (45%) | 108 (44%) | 110 (44%) | 0.964 |
| Waist-to-hip ratio | 0.95 (0.92–0.98) | 0.95 (0.91–0.99) | 0.96 (0.92–1.00) | 0.96 (0.92–1.00) | 0.082 |
| Aortic diameter (mm) | 22.8 (20.9–26.5) | 23.1 (20.9–31.5) | 23.1 (21.4–30.8) | 23.8 (21.1–31.7) | 0.040 |
| Serum creatinine (μM) | 87 (77–98) | 91 (80–103) | 89 (78–103) | 93 (82–113) | 0.001 |
| Serum low-density lipoprotein (mM) | 2.80 (2.20–3.40) | 2.90 (2.40–3.50) | 2.80 (2.20–3.50) | 2.70 (2.10–3.40) | 0.217 |
| Serum high-density lipoprotein (mM) | 1.30 (1.10–1.50) | 1.30 (1.10–1.60) | 1.40 (1.10–1.60) | 1.30 (1.00–1.50) | 0.002 |
| C-reactive protein (mg/L) | 1.61 (0.85–3.31) | 1.88 (1.04–3.17) | 1.94 (0.96–3.93) | 2.85 (1.35–6.05) | <0.001 |
| Serum TSP-1 (ng/ml) | 34.22 (27.75–41.32) | 32.76 (28.42–39.70) | 33.39 (28.06–40.12) | 31.55 (26.96–39.64) | 0.196 |
| Serum TSP-2 (ng/ml) | 49.38 (44.28–52.26) | 61.05 (58.43–63.79) | 73.78 (69.94–78.15) | 98.20 (90.08–117.64) | <0.001 |
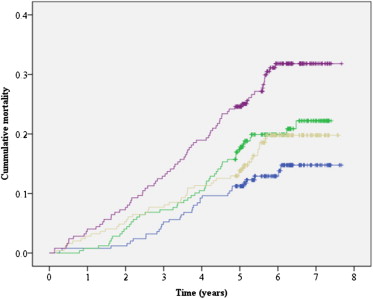
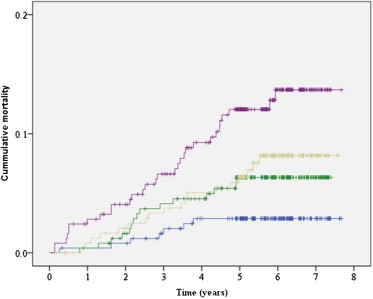
Figures 1–3 illustrate the relationship between serum TSP-2 quartiles and subsequent all-cause, cardiovascular, and cardiac-related mortality. Serum TSP-2 quartile was strongly positively associated with all-cause ( Figure 1 ; p <0.001), cardiovascular ( Figure 2 ; p = 0.001), and cardiac ( Figure 3 ; p <0.001) mortality. Men with serum TSP-2 in the first, second, third, and fourth quartiles had a cumulative incidence of cardiovascular mortality of 3.3%, 8.0%, 9.7%, and 12.5% at 5 years, respectively, p = 0.001. Men with serum TSP-2 in the highest quartile had a 3.37-fold increased risk of cardiovascular mortality after adjusting for other cardiovascular risk factors ( Table 2 ). The association between serum TSP-2 and subsequent cardiovascular mortality was mainly linked to cardiac deaths ( Table 3 and Figure 3 ). Men with serum TSP-2 in the first, second, third, and fourth quartiles had a cumulative incidence of cardiac mortality of 2.9%, 6.3%, 6.4%, and 12.1% at 5 years, respectively, p <0.001. Men with serum TSP-2 in the highest quartile had a 3.55-fold increased risk of cardiac mortality after adjusting for other cardiovascular risk factors ( Table 3 ).

| Characteristic | Hazard Ratio | 95% CI | p Value |
|---|---|---|---|
| Serum TSP-2 in ng/ml ∗ | |||
| ≤55.22 | 1.00 | Reference group | |
| 55.22–66.77 | 2.25 | 0.97–5.20 | 0.058 |
| 66.77–83.90 | 3.06 | 1.37–6.82 | 0.006 |
| >83.90 | 3.37 | 1.53–7.44 | 0.003 |
| Previous stroke | 3.32 | 1.89–5.85 | <0.001 |
| Coronary heart disease | 1.93 | 1.18–3.16 | 0.009 |
| Age >76 yrs † | 1.78 | 1.12–2.85 | 0.016 |
| AAA | 1.66 | 1.03–2.67 | 0.037 |
| Serum creatinine >90 μM † | 1.38 | 0.86–2.21 | 0.189 |
| Waist to hip ratio >0.951 † | 1.34 | 0.85–2.13 | 0.213 |
| Hypertension | 1.31 | 0.83–2.07 | 0.247 |
| Statin | 1.12 | 0.67–1.86 | 0.676 |
| C-reactive protein >1.98 mg/L † | 1.10 | 0.69–1.76 | 0.676 |
| High-density lipoprotein <1.30 mM † | 1.09 | 0.69–1.72 | 0.719 |
| Aspirin | 1.09 | 0.68–1.73 | 0.730 |
| Ever smoker | 0.96 | 0.57–1.64 | 0.884 |
| Diabetes mellitus | 0.94 | 0.51–1.70 | 0.828 |
| Low density lipoprotein >2.80 mM † | 0.84 | 0.51–1.39 | 0.499 |
Stay updated, free articles. Join our Telegram channel

Full access? Get Clinical Tree


