Chapter 13 Regional and Global Ventricular Function and Volumes from SPECT Perfusion Imaging
INTRODUCTION
Electrocardiographic (ECG)-gated myocardial perfusion single-photon emission computed tomography (SPECT) is one of the most frequently performed techniques in nuclear cardiology, and in 2007 it accounted for over 90% of all myocardial perfusion SPECT imaging in the U.S.A. Key to its diffusion has been the relative ease with which gated SPECT acquisitions can be accomplished, especially in conjunction with technetium-99m 99mTc-based radioisotopes, multidetector cameras, and fast processing computers. Gated myocardial perfusion SPECT (gated SPECT) permits the assessment and quantification of various parameters of global and regional function for the left ventricle (LV), which in turn translates into improved diagnostic capabilities and better prognostic power. This chapter will start by identifying and discussing a number of issues connected with the acquisition and processing of gated SPECT data sets, then quantification of global and regional LV function will be addressed in terms of different algorithmic approaches, validation, and practical limitations to quantitative accuracy. Finally, the incremental diagnostic value of gated SPECT parameters over myocardial perfusion parameters will be described and evaluated. Their prognostic value will be addressed later in Chapter 16.
ACQUISITION
As Figure 13-1 shows, a gated SPECT acquisition is essentially equivalent to a standard SPECT acquisition, the only difference being that 8 to 16 projection images instead of one are acquired at each camera angle. Each of those 8 to 16 images is representative of a specific phase of the cardiac cycle, since count accumulation is triggered by the QRS complex of the patient’s ECG wave. It is therefore possible to reconstruct three-dimensional (3D) tomographic representations of the LV’s location and count distribution throughout the cardiac cycle and display them in rapid cinematic succession to achieve a realistic rendition of the four-dimensional (4D) LV motion (three dimensions plus time). Ideally it would be desirable that the number of gating intervals or “frames” employed be as high as possible so as to better follow changes in myocardial position and volumes; however, this consideration is balanced by the need for each projection image to contain adequate counts. Count statistics are influenced by numerous factors, including radioisotope used, injected dose, acquisition time, patient size, camera configuration and sensitivity, collimation, number of frames, and count acceptance criteria. For assessment of systolic ventricular function, gated myocardial perfusion SPECT has traditionally been performed using either 8-frame or 16-frame gating. We prefer the latter, since it can more reliably than the 8-frame approach contain a frame that will correspond closely to true end-systole, important for assessment of systolic function, and because it has a greater number of diastolic frames, important for assessment of diastolic function.
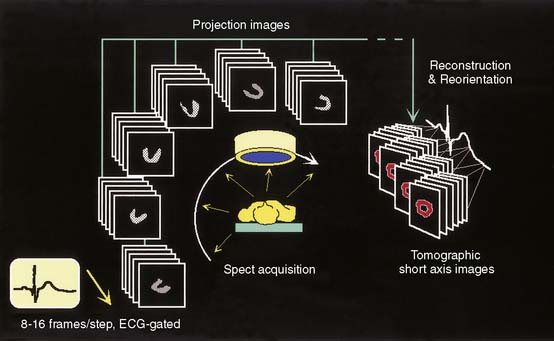
Figure 13-1 Schematic representation of ECG-gated perfusion SPECT acquisition and processing.
(Reproduced with permission from Germano G, Berman D: Acquisition and processing for gated perfusion SPECT: Technical aspects. In Germano G, Berman D [eds]: Clinical Gated Cardiac SPECT. Armonk, NY: Futura Publishing, 1999, pp 93-113.)
Importance of “Bad Beat” Rejection
Cardiac Beat Length Acceptance Window as a Tool for “Bad Beat” Rejection
As explained earlier, the peak or R point of each QRS complex in the ECG triggers the binning of counts into projection images. If a “fixed temporal resolution framing” approach is employed,1 usually based on a sampling of the beats at the beginning of a gated SPECT acquisition, all gating intervals will be set to the same temporal length. For example, in 8-frame gating, the 8 intervals will span 125 milliseconds each if the expected heartbeat duration (R-R computer) is 1 second (Fig. 13-2). Because the actual time between successive R points (R-R patient) typically varies during the course of the acquisition, and particularly because of the impact of PVCs on systolic function and the systolic and diastolic timing noted, if there is no “bad beat” rejection, an error in the function measurements will be embedded in the data, with the magnitude of the error being proportional to the frequency of the premature beats. To circumvent this problem, most computers used in the acquisition process have beat length tolerances built into the count collection process. This is done by defining a beat length acceptance window, which essentially specifies how much shorter (or longer) than its 1-second expected duration a cardiac beat can be to not have its counts discarded for purposes of assessing ventricular function. As Figure 13-2 shows, a beat length acceptance window of 20% allows accumulation of data from cardiac beats of 900 to 1100 milliseconds’ duration. An acceptance window of 100%, on the other hand, allows accumulation of data from beats with duration in the range of 500 to 1500 milliseconds. Note that this is not equivalent to accepting 100% of the beats, which is instead consistent with having a window of infinite width.

Figure 13-2 The cardiac beat length acceptance window.
(Adapted and reproduced with permission from Cullom SJ, et al: Electrocardiographically gated myocardial perfusion SPECT: Technical principles and quality control considerations. J Nucl Cardiol 5:418-425, 1998.)
Figure 13-3 shows that a gated SPECT acquisition produces both gated SPECT images (through reconstruction and reorientation of the projection data sets corresponding to the individual gating intervals) and standard SPECT images (through reconstruction and reorientation of the sum of the projection sets across all intervals). Whereas cardiac function is assessed from the former, myocardial perfusion is derived from the latter. Since the primary purpose of gated SPECT is usually to assess myocardial perfusion, it is optimal to include all of the data in the perfusion assessment, not just data from the accepted beats. To this end, a useful option is an “extra frame” in which all counts “rejected” by being outside the acceptance window for purposes of gated ventricular function assessment are still accumulated and used for perfusion assessment, leading to optimal count statistics for perfusion assessment purposes and optimal beats for function assessment. Cameras with this feature allow the use of a narrow acceptance window, typically 20% to 30%. If, on the other hand, no “extra frame” exists, it may be advisable to open the acceptance window to 100% or infinity so as to maximize the quality of the images from which perfusion will be assessed. The downside of the wide acceptance window is that counts from arrhythmic beats are allowed into the gated SPECT images, decreasing the accuracy of cardiac function assessment. Most camera manufacturers today do provide the “extra frame” feature in conjunction with gated SPECT imaging, as currently recommended.2 Another approach to the same end is to have simultaneous, independent acquisition of the gated and ungated data sets, a potentially optimal approach because it allows the use of a narrow window on the gated portion and no window at all on the ungated portion of the study.3
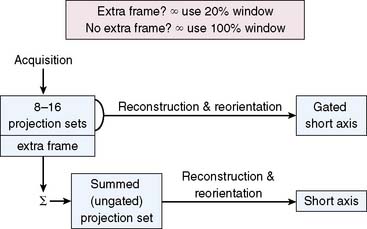
Figure 13-3 Setting the cardiac beat length acceptance window.
(Adapted and reproduced with permission from Germano G, Berman D: Gated single-photon emission computed tomography. In Iskandrian AS, Verani MS [eds]: Nuclear Cardiac Imaging: Principles and Applications, 3rd ed. New York: Oxford University Press, 2003, pp 121-136.)
Gating Errors
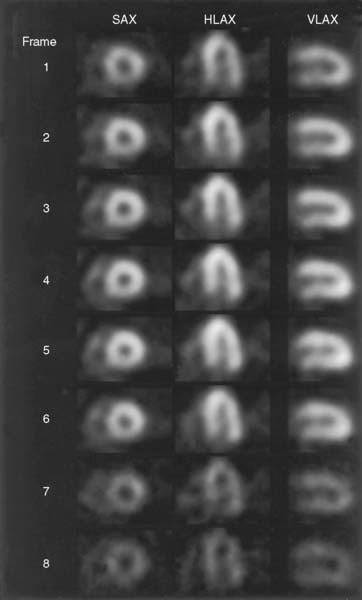
If a wide cardiac beat length acceptance window is used in the presence of arrhythmias (e.g., the 100% window mentioned), some arrhythmic beats will not be rejected. A typical example of this problem is the “count dropoff” phenomenon, in which shorter cardiac beats, but not short enough to be rejected, do not contribute counts to the later gating intervals of a “fixed temporal resolution” acquisition; this in turn causes “flickering” of gated SPECT images displayed in cinematic mode (Fig. 13-4).
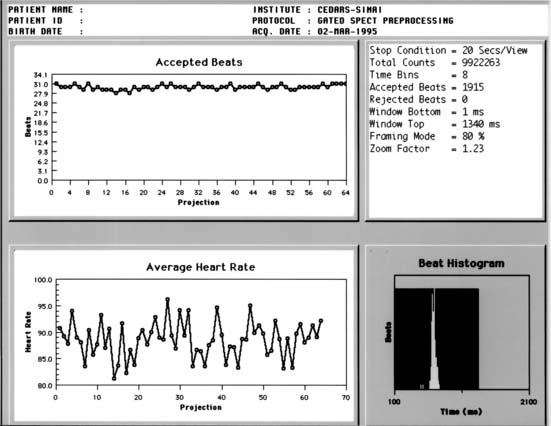
Excessive “bad beat” rejection can result in inadequate counting statistics for accurate function assessment from the remaining beats. In these circumstances, it is recommended that the ventricular function assessments not be considered valid. Examples of such arrhythmias are bigeminy, trigeminy, and frequent ventricular PVC couplets. In many laboratories, patients with more than 20% PVCs present are considered poor candidates for ventricular function measurements with gated SPECT.4 To detect cases in which arrhythmias develop during a gated acquisition employing a wide window, however, additional quality-control strategies can be useful, including (1) the generation, from an independent heart monitor, of paper printouts of the patient’s heart rate throughout the acquisition, (2) the use of software that aims at detecting gating errors from postacquisition analysis of the relative counts and count patterns in the various gated frames,5 and (3) when provided by the camera manufacturer, the review of graphs of accepted counts or heart rate as a function of the projection angle, as well as beat length histograms (Fig. 13-5).
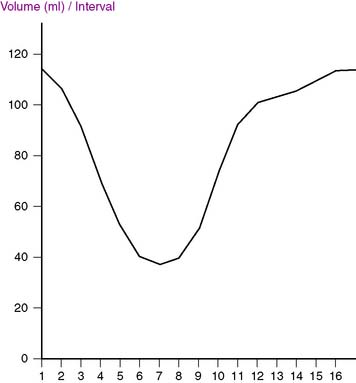
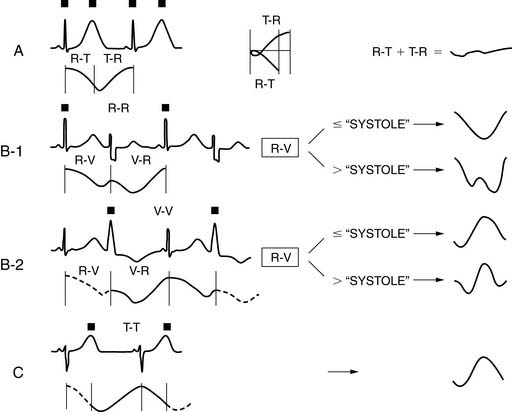
A simple yet effective quality-control tool that can easily be used postprocessing to identify gating errors is visual assessment of the time-volume curve generated by the quantification software available with most systems. A “canonical” curve would be expected to be approximately U-shaped, with the maximal volume (end-diastolic volume [EDV]) corresponding to the first gating interval, and the minimal volume (end-systolic volume [ESV]) slightly before the midpoint of the R-R interval (Fig. 13-6). If major deviations from this expected shape occur, the ECG gate has most likely sensed the R-R interval incorrectly or there have been excessive arrhythmic beats. As Figure 13-7 exemplifies, both arrhythmias and various gating errors are capable of causing severe deformations of the time-volume curve from which EDV, ESV, and left ventricular ejection fraction (LVEF) are calculated, naturally resulting in quantitative errors.
PROCESSING
As is the case with ungated acquisitions, projection images corresponding to the individual frames of a gated acquisition are tomographically reconstructed into transaxial images, which are in turn reoriented into short-axis images perpendicular to the long axis of the LV.6 Projection images are typically smoothed before reconstruction to reduce statistical noise; this is most frequently accomplished using a Butterworth filter, which in the frequency (f) domain is described by the following equation:
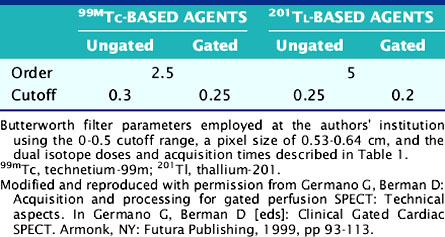
The degree of smoothing applied is proportional to fc, the critical or “cutoff” frequency, and depends to a lesser degree on n, the order of the filter. The cutoff frequency can be expressed as a value either in the 0 to 1 range or in the 0 to 0.5 range, depending on the particular convention adopted6—in any event, it is generally agreed that gated images must be smoothed more heavily than ungated or summed images because they contain fewer counts. A summary of the filters settings used at the authors’ institution can be found in Table 13-1.
Gated SPECT images are reconstructed using either the classic filtered backprojection approach, first described by Bracewell and Riddle for astronomical applications in 19677 and later extended to medical imaging by Shepp and Logan,8 or iterative reconstruction techniques. The latter have the potential advantages of reducing reconstruction artifacts caused by hepatic or other extracardiac activity,9 as well as the ease of incorporation of attenuation correction and other compensations into the reconstruction process. Iterative techniques are intrinsically slower than filtered backprojection; however, the speed of modern computers makes it both practical and advisable to reconstruct gated and ungated data sets using the same iterative reconstruction approach.
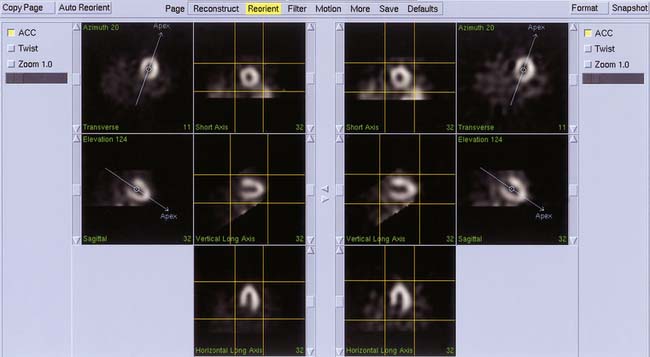
Automated algorithms to filter, reconstruct, and reorient gated SPECT images are widely available in modern nuclear cardiology10–13 and can greatly improve the accuracy and reproducibility of processing. One particularly useful feature of these approaches is that even though different filter cutoffs are used (see Table 13-1 and Fig. 13-8), the same reconstruction limits (see Fig. 13-8) and reorientation angles (Fig. 13-9) can be applied in lockstep to the gated and ungated image data sets, improving consistency between the perfusion and the function assessment.
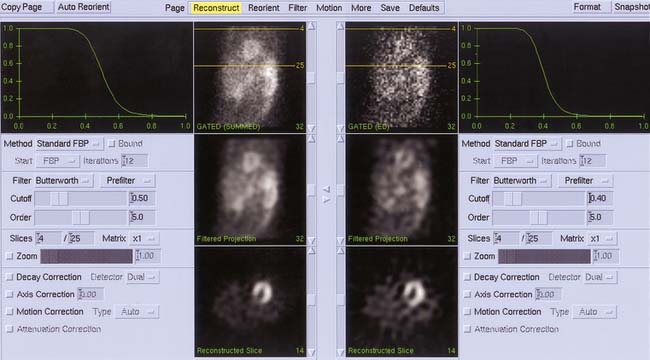
Figure 13-8 Simultaneous automated filtering and reconstruction of gated end-diastolic (right) and summed gated (left) projection images from a thallium-201 gated SPECT acquisition. Note that despite the difference in count statistics, the same reconstruction limits (yellow lines) are calculated for and applied to the two data sets. Cutoff frequencies are based on Table 13-1 but expressed using the 0 to 1 scale.
QUANTIFICATION
Gated perfusion SPECT images can be quantitatively analyzed with respect to a remarkable number of parameters of cardiac function, both global and regional, both systolic and diastolic. As Table 13-2 shows, global systolic function is typically characterized by measurement of the LVEF, EDV and ESV, whereas global diastolic function is similarly defined by assessment of the peak filling rate, time to PFR, peak ejection rate, time to PER, and mean filling fraction MFR/3. Regional parameters of LV function include myocardial wall motion and wall thickening. When these are semiquantitatively scored using a segmental model, the individual segment scores can be added to generate a global or summed wall motion score and a summed wall thickening score. Quantitative phase analysis can also be performed both in a global manner (synchrony of contraction of the LV as a whole) or regionally as the difference between the onset of contraction in different myocardial walls.
Table 13-2 Global and Regional Parameters of Systolic and Diastolic Left Ventricular Function Measured from Gated Myocardial Perfusion SPECT Images
| Parameter | Systolic | Diastolic |
|---|---|---|
| Global | ||
| Regional |
Global and regional parameters of systolic and diastolic LV function that can be effectively measured from gated myocardial perfusion SPECT images. EDV, end-diastolic volume; ESV, end-systolic volume; MFR/3, mean filling fraction; LVEF, left ventricular ejection fraction; PER, peak ejection rate; PFR, peak filling rate; SWM, summed wall motion score; SWT; summed wall thickening score; TPER, time to PER; TPFR, time to PFR; WM, myocardial wall motion; WT, myocardial wall thickening.
Gated SPECT imaging also offers interesting potential advantages, such as the ability to “freeze” LV motion so as to better identify mild perfusion defects,14–16 as well as the ability to measure gated transient ischemic dilation of the LV,17 which in its ungated form has proven a highly specific marker of severe and extensive coronary artery disease (CAD).18
Recent years have seen the development and validation of numerous algorithms aimed at quantifying parameters of cardiac function from gated SPECT images, and it is indeed estimated that the overwhelming majority of institutions and laboratories performing gated SPECT imaging today also employ quantification to some degree. Although many of those algorithms are important for historical reasons,19–27 only the four commercially available algorithms will be discussed in detail within this chapter. The algorithms are usually referred to as: (1) Cedars-Sinai’s software, or “Quantitative Gated SPECT” (QGS), also a component of AutoQUANT; (2) Emory University’s software, a component of the Emory Cardiac Toolbox (ECT); (3) the University of Michigan’s software, or 4D-MSPECT; and (4) Yale University’s CQ software.
The Cedars-Sinai Approach: Quantitative Gated SPECT
This approach is entirely automated and based in the 3D space. It starts with the segmentation of the LV myocardium using heuristic image thresholding, binarization, and clusterification, followed by iterative cluster refinement using pixel erosion and pixel growing. When a mask consistent with the expected size, shape, and location of the LV is obtained, ellipsoidal fitting is used to define a new sampling coordinate system, along which rays are drawn and count profiles measured normally to the myocardium. These count profiles are fitted to asymmetric Gaussian curves. The Gaussians’ maxima represent the midmyocardial surface, while the endocardial and epicardial surfaces are determined based on a phantom-determined fraction of the Gaussians’ standard deviations, and the valve plane is determined by fitting a plane to the most basal myocardial points. Surfaces can usually be accurately determined even in the apparent absence of perfusion, thanks to count gradient continuity constraints. LV cavity and myocardial volumes are calculated for each gating interval as the number of voxels bound by myocardial surfaces and the valve plane, and cavity volumes are displayed in the time-volume curve, from which diastolic function can be assessed, while the LVEF is derived from the EDV and ESV.28
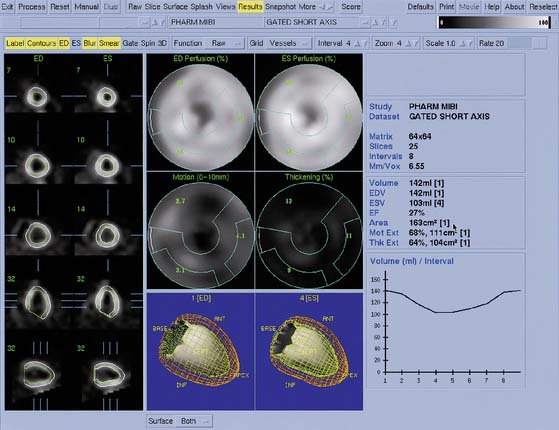
Myocardial motion is computed as the excursion of the endocardial surface from end-diastole to end-systole, and myocardial thickening is based on both geometric and count considerations.29 Synchrony of contraction can be measured for the LV as a whole, or as differences in the time of contraction of individual portions of the LV quantified.30 Both myocardial motion and thickening can be visualized through various 2D and 3D cinematic displays, and motion and thickening scores are calculated automatically using normal databases.31 A sample QGS display is presented in Figure 13-10, and a comprehensive description of the Cedars-Sinai approach can be found in Ref. 32.
The Emory University Approach: Emory Cardiac Toolbox
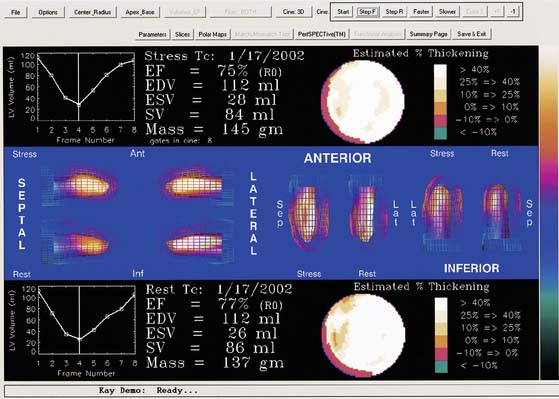
In this approach, maximal myocardial count samples are extracted at many locations about the LV during perfusion analysis for each gated frame of the study. Because of the SPECT point spread function, it is assumed that the maximum count value occurs in the middle of the myocardium at each sample. Therefore, these sample points define a midmyocardial surface at each frame. The frame where the volume of this midmyocardial surface is maximum is considered the probable end-diastolic frame, and the myocardium is assumed to be uniformly 1-cm thick at each sample of that frame.33 Wall thickening through the cardiac cycle at each myocardial sample is determined by fitting the change in counts to a cosine function and computing its amplitude. The ED wall thickness value of 1 cm is modified according to the percent thickening curve to compute wall thickness for each sample in each additional frame. Finally, the endocardial or epicardial surfaces are estimated at each frame by subtracting or adding, respectively, half of the thickness to the midmyocardial surface at each sample. Using these surfaces, a final calculation of volume is made for the endocardial surface to determine end-diastole, end-systole, LV volumes, and LVEF. A phase histogram from which global dyssynchrony measures are derived is also generated from the phase angles of the fitted cosine curves for each sample point.34 A sample ECT display is presented in Figure 13-11, and a comprehensive description of the Emory approach can be found in Ref. 35.
The University of Michigan Approach: 4D-MSPECT
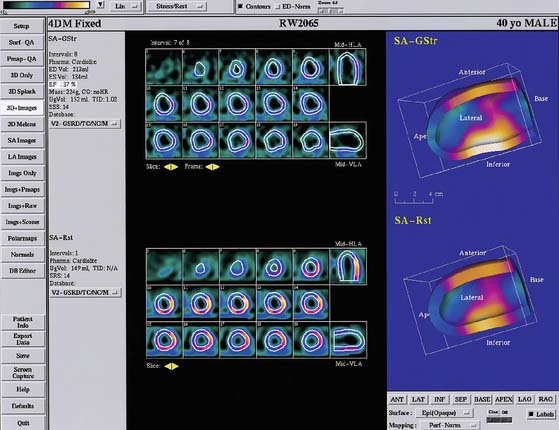
The surface estimation algorithm for 4D-MSPECT (4DM) utilizes a 2D gradient operator in conjunction with a segmented image and a contiguity constraint to provide initial surface estimates for the endocardial and epicardial surfaces. Weights are assigned based on measured intensity profiles within these initial surface boundaries. Using these weights and the estimated curvature of the heart, 2D and 1D weighted splines are utilized to “fill in” missing data (i.e., perfusion defects) while minimizing the inclusion of extracardiac activity.36 Using the intensity profiles bounded by these new surfaces, a Gaussian fit is used to find the peak activity and an estimate of the myocardial thickness. To compensate for the limited resolution of emission tomography, the myocardial thickness at end-diastole (max endocardial volume) is scaled to provide an average thickness of 10 mm. This scale factor in conjunction with a myocardial mass constraint is used to adjust the myocardial thickness throughout the cardiac cycle. Using the endocardial surfaces, a volume curve is generated that spans the cardiac cycle. From the volume curve data, systolic (LVEF, volumes, cardiac output, myocardial mass) and diastolic (peak and time to peak filling, and ejection rates) parameters are calculated. For diastolic function, a minimum of 16 frames of data are required to provide adequate sampling or the harmonic fitting to compute to the diastolic parameters. Use of 4DM also provides 2D and 3D regional wall motion and wall thickening maps with database comparisons, wall motion and wall thickening segmented scoring maps,37 and 2D and 3D cinematic displays for the visual interpretation of wall motion and wall thickening. To complement the functional estimates, 2D and 3D analysis of the myocardial intensity information within the detected LV surfaces is compared with normal databases to quantify myocardial perfusion, thereby providing correlative information of perfusion with function for the improved diagnosis of CAD. A sample 4DM display is presented in Figure 13-12, and a comprehensive description of the University of Michigan approach can be found in Ref. 38.
The Yale University Approach
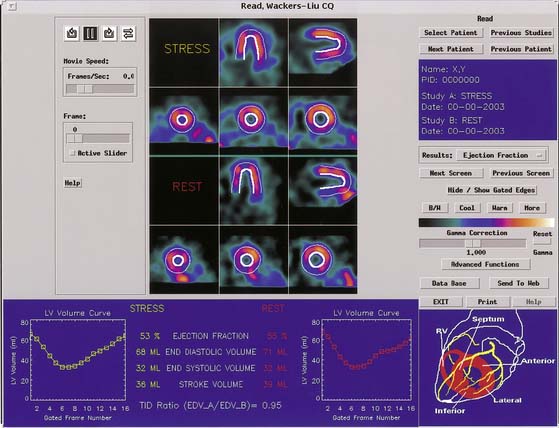
Quantification of regional myocardial wall thickening is based on the generation of circumferential maximal count profiles for each gating frame, and measurement of count changes in each sector from end-diastole to end-systole.39 End-diastole is defined as the first frame that corresponds to the R wave, and end-systole as the frame with maximal sectorial count density. The normalized maximal thickening profile is displayed in conjunction with the lower limit of normal wall thickening (mean thickening in normal subjects is 2SD). A sample Yale University display is presented in Figure 13-13, and a comprehensive description of the Yale approach can be found in Ref. 40.
EJECTION FRACTION

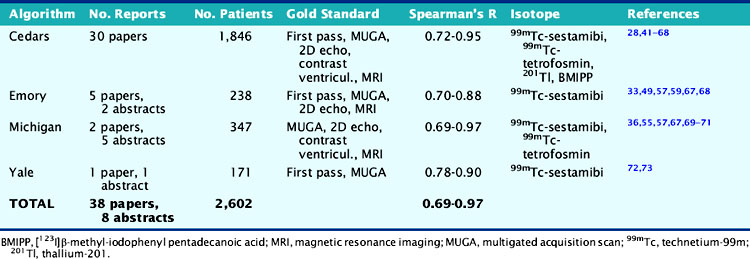
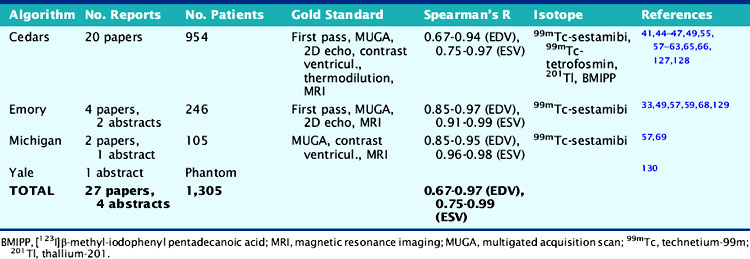
As Table 13-3 shows, the agreement between gated SPECT and reference standard measurements of quantitative LVEF is in the very good to excellent range and relatively independent of the isotope, protocol, standard, and algorithm used. Reproducibility (defined as the agreement between independent measurements of LVEF resulting from multiple applications of the same quantitative algorithm to the same gated SPECT study) is also excellent, being directly related to the degree of automation of the algorithm.22,57,66,67
Table 13-3 Clinical Validation of Quantitative Measurements of Left Ventricular Ejection Fraction Volume from Gated Perfusion SPECT
Repeatability (defined as the agreement between independent measurements of LVEF resulting from separate applications of the same quantitative algorithm to different, but presumably equivalent, gated SPECT studies) is also extremely good, both for sequential studies74–76 and for acquisition involving different isotopes,50,52,58,76–79 injected dose and acquisition time,80–82 acquisition orbit,83 cameras,84,85 number of gating intervals,53 and patient position.86,87 Moreover, the use of attenuation correction or resolution recovery in conjunction with gated SPECT imaging does not appear to greatly affect quantitative measurements of LVEF.88,89
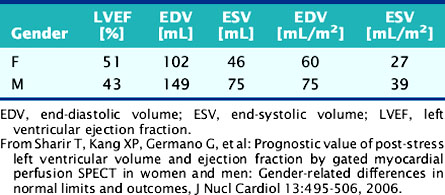
Cross-algorithm reproducibility (defined as the agreement between LVEF values measured by different quantitative algorithms applied to the same gated SPECT study) has been reported to be in the very good to excellent range. However, it is also well established that systematic differences among algorithms do exist and effectively prevent the direct comparison (or pooling) of differently analyzed data.55,59,90–95 Normal limits for LVEF are similarly algorithm dependent55,73,96–100 and also gender specific,98,100–108 as shown in Table 13-4 for the QGS software.
Table 13-4 Normal Limits for Quantitative Measurements of Global Left Ventricular Function from 8-Frame Gated Perfusion SPECT Images, Using the QGS Algorithm
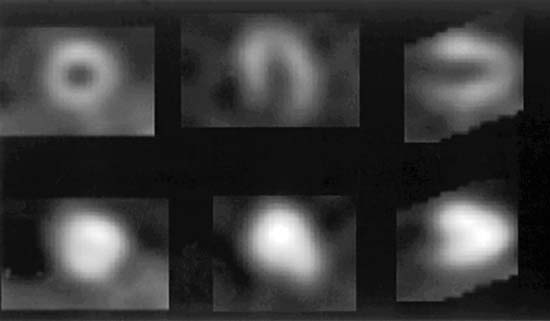
There are some limitations common to most algorithms connected with the quantification of LVEF from gated perfusion SPECT. For example, it is well known that the relatively low resolution of nuclear cardiology images may make it difficult to visualize small objects, such as the LV cavity of patients with small ventricles, particularly at end-systole (Fig. 13-14). This phenomenon, also referred to as partial volume effect,26 will lead to the underestimation of LV cavity volumes (particularly the ESV), with consequent overestimation of the LVEF.109–111 The problem can be alleviated through magnification of the LV either in acquisition (by employing a larger acquisition zoom) and/or in reconstruction (by employing zoomed centered or zoomed off-axis reconstruction),111–114 or by applying numerical modeling and compensation of blurring.115,116 However, a simpler solution is to discard the overestimated value and report the LVEF as being “in the normal range.”
Another limitation related to the partial volume effect is that nuclear cardiology techniques are incapable of measuring myocardial thickness with high accuracy. Most quantitative gated SPECT algorithms are either calibrated for the range of thicknesses most typically encountered in clinical practice28 or assume a fixed myocardial thickness in the normal range33; consequently, gated SPECT LVEFs measured in patients with left ventricular hypertrophy are likely to be underestimated.117
Gated SPECT imaging traditionally has been performed with 8-frame gating, which undersamples the time-volume curve compared to 16-frame gating, and thus leads to mild underestimation of the LVEF. However, Figure 13-15 shows that the degree of underestimation is small (3 to 4 LVEF percentage points) and remarkably uniform over a wide range of ejection fractions, as also confirmed by other published reports.28,53,54,56,118–120
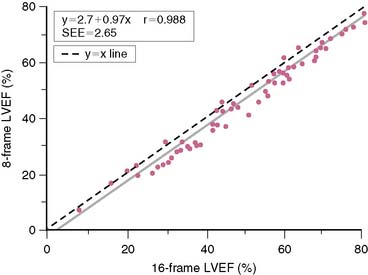
Figure 13-15 Left ventricular ejection fractions (LVEFs) measured by QGS on 65 patients, using 16-frame and 8-frame gated 99mTc-sestamibi SPECT, showing that the latter underestimates LVEF.28 The correlation between the two measurements is excellent, and the standard error of the estimate (SEE) low, making their relationship quite predictable.
(Reproduced with permission from Germano G, Berman D: Quantitative gated perfusion SPECT: Technical aspects. In Germano G, Berman D [eds]: Clinical Gated Cardiac SPECT. Armonk, NY: Futura Publishing, 1999, pp 115-146.)
Finally, most quantitative gated SPECT algorithms tend to assume a regular or “smooth” LV shape in areas with severely reduced or absent perfusion,28 and this would be expected to result in the “cutting off” of aneurysms, with consequent overestimation of the measured LVEF. Although a large number of published reports deny the presence of major discrepancies between true and quantitatively measured LVEF in patients with large perfusion defects and/or low LVEF,42,43,45,46,48,50,56,121–125 the possibility of aneurysms should always be considered in the presence of perfusion defects.69,126
END-SYSTOLIC AND END-DIASTOLIC VOLUME
As Table 13-5 shows, the agreement between gated SPECT and reference standard measurements of quantitative end-diastolic and end-systolic volumes is in the very good to excellent range and relatively independent of the isotope, protocol, standard, and algorithm used. These published findings are similar to those for LVEF (see Table 13-3), even though the LVEF can be considered relatively less vulnerable to errors in the EDV and ESV volume estimates (errors in the determination of EDV and ESV would be expected to occur in the same general direction and therefore would at least partially cancel out when the volumes are ratioed). As with LVEF, reproducibility is excellent,28,46,66,67,74 and repeatability has also been reported to be extremely high, both for sequential studies74 and for acquisition involving different isotopes,58,76,79 injected dose and acquisition time,80,81 number of gating intervals,53 and patient position.86,87 Cross-algorithm reproducibility of LV volume measurements at ES and ED has also been reported to be very high,57,94,95,99,129 although, as for LVEF, systematic differences among algorithms do exist and can be quite large.59,90,92,94,95
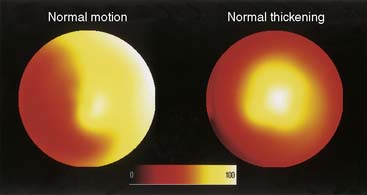
REGIONAL SYSTOLIC FUNCTION
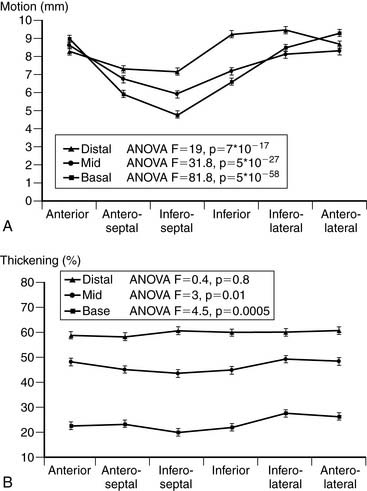
The quantitative measurement of regional LV myocardial wall motion and wall thickening from gated SPECT images poses a unique problem. While it is certainly possible to measure (at many sampling locations) the absolute motion of the endocardial surface of the LV or the “brightening” of the LV myocardium from ED to ES,29 these measurements are not as directly interpretable as regional measurements of myocardial perfusion. For example, neither myocardial wall motion nor thickening are uniform across the myocardium of a normal patient,131 as shown in Figure 13-16, so dark areas in the motion or thickening polar maps cannot be considered a visual clue that myocardial function is abnormal in those areas. Indeed, it has been demonstrated that normal regional myocardial contraction by gated myocardial perfusion SPECT is characterized by a substantial apex-to-base decline in thickening and circumferential heterogeneity in endocardial motion (Fig. 13-17).31