Determination of right ventricular (RV) size and function has gained more interest in recent years in adults and children, especially in patients with congenital heart disease. Data on normal RV size parameters in children are scant. The aim of this study was to investigate growth-related changes in RV internal dimensions in a healthy pediatric cohort and the predictive value of RV parameters in identifying enlarged right ventricles in children with secundum-type atrial septal defects (ASD). A prospective study was conducted in a group of 576 healthy children (aged 1 day to 18 years) and 37 children (aged 1.4 to 17.7 years) with moderate-sized to large ASDs. The effects of age, body length, body weight, and body surface area were determined on the following RV parameters: end-diastolic basal diameter, end-diastolic midcavity diameter, end-diastolic length, end-systolic length, end-diastolic area, and end-systolic area. The predictive value of normal values stratified for age, body weight, body length, and body surface area was tested in children with ASDs. RV end-diastolic basal diameter, end-diastolic midcavity diameter, end-diastolic length, end-systolic length, end-diastolic area, and end-systolic area showed positive correlations with age, body length, body surface area, and body weight. In this population, RV z scores showed high specificity for detecting patients with ASDs, with sensitivity up to 89%, especially in children <8 years of age. In conclusion, the normal ranges of pediatric RV internal dimensions are provided. The z scores of these RV parameters were also calculated. Normal RV z scores might be important predictors in identifying enlarged right ventricles in patients with ASDs.
Highlights
- •
Normal pediatric RV dimensions were measured and z scores calculated in 576 healthy children and 37 children with hemodynamically relevant ASDs.
- •
This is the first study presenting normal ranges of RV systolic and diastolic dimensions in children from infancy to 18 years of age.
- •
RV z scores > 2 SDs were predictive for detecting ASD in patients <8 years of age with enlarged right ventricles.
The importance of right ventricular (RV) internal dimensions has increasingly been recognized in pediatric and adult heart disease. Enlarged RV dimensions can provide relevant hints for the diagnosis of congenital heart defects (CHDs), such as atrial septal defect (ASD), and have been shown to be a major diagnostic criterion for arrhythmogenic RV dysplasia. RV volume and/or pressure overloading conditions after cardiac surgery for CHDs can cause remodeling and dysfunction of the right ventricle. Therefore, accurate assessment of RV size and function is critically important for guiding treatment and follow-up in a number of cardiovascular conditions. Reference values of various RV diameters for the adult population are available. On the basis of RV guidelines, 2-dimensional (2D) echocardiographic measurements from the apical 4-chamber view were described to be useful for the assessment of RV size: RV end-diastolic basal diameter (RVEDb-d), RV end-diastolic midcavity diameter (RVEDm-d), RV end-diastolic length (RVEDL), RV end-diastolic area (RVEDa), and RV end-systolic area (RVESa). These parameters are easy to determine and therefore may be used as noninvasive measurements to study RV size and performance also in children. In the pediatric age group, the influence of growing age, body length (BL), body weight (BW), and body surface area (BSA) on RV internal dimensions has not been appropriately analyzed to date. The first aim of our prospective study was to determine the normal z-score values for the RV variables RVEDb-d, RVEDm-d, RVEDL, RVESL, RVEDa, and RVESa, correlated with age, BL, BW, and BSA. The second aim of our study was to determine if using upper reference values (z score > 2) for these variables accurately predicted enlarged right ventricles in children with moderate-sized to large ASDs.
Methods
The healthy study group consisted of 576 pediatric patients (328 male, 248 female). Only subjects whose echocardiographic results were judged normal by one of our staff pediatric cardiologists were included. The study group encompassed neonates to adolescents (aged 1 day to 18 years, BW 2.8 to 98.0 kg, BSA 0.20 to 2.23 m 2 ), including 46 neonates and 64 infants. All patients with CHDs or acquired heart disease, chest and thoracic spine deformities, or chromosomal syndromes were excluded from analysis. Patients were examined in a rest state. Infants were allowed to be bottle fed during the examination. The ASD study group consisted of 37 patients (16 male, 21 female; median age 6.2 years, range 1.4 to 17.7) with unrepaired isolated secundum-type ASDs with moderate to large left-to-right shunting at the atrial level and signs of RV volume overload. The ASD size in our patients ranged from 6 to 16 mm on transthoracic examination. Our patients with ASD had normal RV systolic pressure as assessed by tricuspid regurgitation velocity (calculated from the modified Bernoulli equation).
Echocardiography was performed using a commercially available echocardiographic system (Sonos iE33; Philips Medical Systems, Andover, Massachusetts) using transducers of 5-1, 8-3, and 12-4 MHz depending on patient size and weight. Images were recorded digitally and later analyzed by one of the investigators (M.K.) using off-line software (Xcelera Echo; Philips Medical Systems, Eindhoven, the Netherlands). Echocardiographic images were considered to be of sufficient technical quality only if the entire endocardial surface of the RV cavity could be clearly visualized in the apical 4-chamber view. The apical 4-chamber view was orientated to obtain the maximum dimension of the right ventricle. From this view, the lateral side of the right ventricle and the right side of the interventricular septum lie parallel to the ultrasound beam. Optimal RV images were selected for measurement of the American Society of Echocardiography–recommended 2D RV parameters.
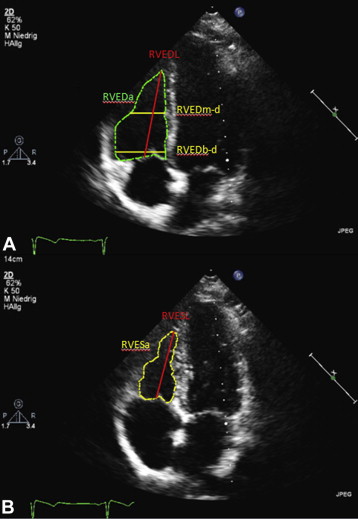
The following parameters were recorded: the RVEDa and RVESa were measured by outlining the endocardial borders of the right ventricle in end-diastole and end-systole in the apical 4-chamber view. RVEDb-d was measured as the distance between the RV free wall and septum, just distal to the tricuspid annulus. RVEDm-d was measured in the middle third of the right ventricle at the level of the left ventricular papillary muscles, measured in the apical 4-chamber view. The major axis of the right ventricle was defined as the distance between the RV apex and the midpoint of the tricuspid valve annulus in systole (RVESL) and diastole (RVEDL). Measurements of RVEDb-d, RVEDm-d, RVEDL, and RVEDa were performed at end-diastole, which was defined as the frame closest to the onset of the R wave of the electrocardiogram. RVEDb-d and RVEDm-d were measured from the leading edge to the leading edge of the endocardial signals. Measurements of RVESL and RVESa were performed at end-systole, which was defined as the time frame preceding tricuspid valve opening, showing the minimal RV area (in most instances, the time of the end of the T wave). To minimize variability, a strict institutional protocol for image acquisition for the measurement of RV dimensions was used. Age, BW, BL, and BSA were measured at the time of echocardiography, and BSA was calculated using the Mosteller formula. The echocardiographic measurement of the various RV internal dimensions is shown in Figure 1 .
All data were measured from 3 well-trained observers (M.K., B.N., and A.B.) from 3 to 5 consecutive beats and averaged as previously recommended. For data analysis, SPSS version 20 (SPSS, Inc., Chicago, Illinois) was used. Reliability of both the interobserver and intraobserver measurements was analyzed by using a random-effects model analysis of variance (intraclass correlation coefficient [ICC]). Intraobserver reliability was high for all measured parameters (RVEDb-d ICC 0.97, 95% confidence interval [CI] 0.93 to 0.98; RVEDm-d ICC 0.98, 95% CI 0.95 to 0.99; RVEDL ICC 0.97, 95% CI 0.93 to 0.99; RVEDa ICC 0.99, 95% CI 0.98 to 1.00; RVESL ICC 0.98, 95% CI 0.96 to 0.99; RVESa ICC 0.99, 95% CI 0.97 to 0.99). Interobserver reliability was high for all measured parameters (RVEDm-d ICC 0.94, 95% CI 0.88 to 0.97; RVEDL ICC 0.96, 95% CI 0.91 to 0.98; RVEDa ICC 0.99, 95% CI 0.98 to 1.00; RVESL ICC 0.96, 95% CI 0.91 to 0.98; RVESa ICC 0.98, 95% CI 0.96 to 0.99), except for RVEDb-d (ICC 0.88, 95% CI 0.73 to 0.94). Data are presented as mean ± 2 SDs. After plotting the data from healthy children and adolescents, we compared linear, quadratic, cubic, and logarithmic models. If the more complex model did not result in significant improvement in the correlation coefficient, the simpler model was used. Data were examined for heteroscedasticity to determine whether the SD of the residuals varied across the range of values for the independent variable. When significant heteroscedasticity was detected, weighted least square methods were used. The resulting residuals (differences between observed data and predicted values from the model) were examined and tests for normality were applied to determine whether they conformed to a normal distribution. Examination of residuals was crucial for the development of z scores that would accurately predict the normal ranges. To test the final models, their ability to identify children with ASDs was analyzed. Therefore, sensitivity, specificity, negative predictive value, and positive predictive value for a cut-off score of +2 SDs was calculated. Furthermore receiver-operating characteristic curves were plotted, and the best cut-off score was computed.
This study complies with all institutional guidelines related to patient confidentiality and research ethics, including institutional review board approval (26-328 ex 13/14) of the Ethics Board of the Medical University of Graz.
Results
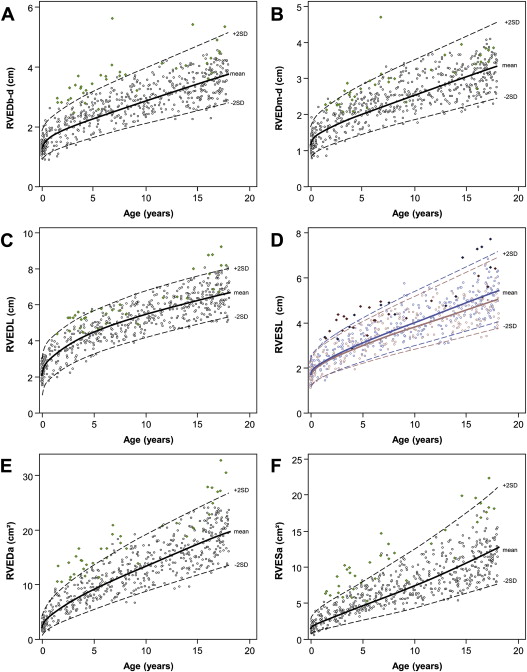
All investigated RV variables, RVEDb-d, RVEDm-d, RVEDL, RVESL, RVEDa, and RVESa, increased from neonates to adolescents in a nonlinear way. The RVEDb-d RVEDm-d, RVEDL, RVESL, RVEDa, and RVESa data are shown in Figures 2 and 3 , listed in Tables 1–3 , and shown in Supplementary Figures A and B .
| Regression Model | n | R 2 | Model estimates β | |||||
|---|---|---|---|---|---|---|---|---|
| intercept (a) | (b) | |||||||
| EDb-d | age | (years) | e ˆ (a+b*age ˆ .5) | 576 | 0.79 | 0.28 | 0.25 | |
| BSA | (m 2 ) | e ˆ (a+b*ln(BSA)) | 575 | 0.85 | 0.99 | 0.48 | ||
| BW | (kg) | a+b*weight ˆ .5 | 575 | 0.81 | 0.70 | 0.37 | ||
| BL | (cm) | a+b*body length | 576 | 0.81 | 0.41 | 0.02 | ||
| EDm-d | age | (years) | e ˆ (a+b*age ˆ .5) | 576 | 0.79 | 0.15 | 0.25 | |
| BSA | (m 2 ) | e ˆ (a+b*ln(BSA)) | 575 | 0.81 | 0.87 | 0.49 | ||
| BW | (kg) | e ˆ (a+b*ln(weight)) | 575 | 0.81 | -0.30 | 0.35 | ||
| BL | (cm) | a+b*body length | 576 | 0.81 | 0.35 | 0.02 | ||
| EDL | age | (years) | a+b*age ˆ .5 | 576 | 0.86 | 2.03 | 1.10 | |
| BSA | (m 2 ) | e ˆ (a+b*ln(BSA)) | 575 | 0.86 | 1.60 | 0.52 | ||
| BW | (kg) | a ˆ b*weight ˆ .5 | 575 | 0.86 | 1.14 | 0.71 | ||
| BL | (cm) | a+b*body length | 576 | 0.87 | 0.53 | 0.04 | ||
| EDa | age | (years) | (a+b*age ˆ .5) ˆ 2 | 576 | 0.88 | 1.47 | 0.70 | |
| BSA | (m 2 ) | e ˆ (a+b*ln(BSA)) | 575 | 0.90 | 2.42 | 0.98 | ||
| BW | (kg) | e ˆ (a+b*ln(weight)) | 575 | 0.90 | 0.09 | 0.70 | ||
| BL | (cm) | e ˆ (a+b*ln(body length)) | 576 | 0.89 | -5.48 | 1.63 | ||
| ESL | age | (years) | e ˆ (a+b*age ˆ .5) | female | 248 | 0.84 | 0.39 | 0.50 |
| male | 328 | 0.85 | 0.45 | 0.50 | ||||
| BSA | (m 2 ) | e ˆ (a+b*ln(BSA)) | 574 | 0.85 | 1.30 | 0.54 | ||
| BW | (kg) | e ˆ (a+b*ln(weight)) | 574 | 0.85 | 0.02 | 0.38 | ||
| BL | (cm) | e ˆ (a+b*body length ˆ .5) | 575 | 0.85 | -0.76 | 0.18 | ||
| ESa | age | (years) | e ˆ (a+b*age ˆ .5) | 576 | 0.84 | 0.42 | 0.50 | |
| BSA | (m 2 ) | e ˆ (a+b *ln(BSA)) | 575 | 0.88 | 1.87 | 1.00 | ||
| BW | (kg) | e ˆ (a+b*ln(weight)) | 575 | 0.88 | -0.50 | 0.71 | ||
| BL | (cm) | e ˆ (a+b*ln(body length)) | 576 | 0.87 | -6.19 | 1-67 | ||
| RVEDb-d z-Score | RVEDm-d z-Score | RVEDL z-Score | RVEDa z-Score | RVESL z-Score | RVESa z-Score | ||||||||||||||
|---|---|---|---|---|---|---|---|---|---|---|---|---|---|---|---|---|---|---|---|
| −2 | 0 | 2 | −2 | 0 | 2 | −2 | 0 | 2 | −2 | 0 | 2 | −2 | 0 | 2 | −2 | 0 | 2 | ||
| month | 1 | 1.0 | 1.4 | 2.0 | 0.9 | 1.2 | 1.7 | 1.2 | 2.3 | 3.3 | 1.0 | 2.6 | 4.9 | 1.3 | 1.7 | 2.4 | 1.3 | 1.8 | 2.5 |
| 2 | 1.0 | 1.4 | 2.0 | 0.9 | 1.3 | 1.8 | 1.4 | 2.4 | 3.5 | 1.2 | 2.9 | 5.4 | 1.3 | 1.8 | 2.5 | 1.3 | 1.8 | 2.6 | |
| 3 | 1.1 | 1.5 | 2.1 | 0.9 | 1.3 | 1.9 | 1.5 | 2.5 | 3.6 | 1.4 | 3.2 | 5.7 | 1.3 | 1.9 | 2.6 | 1.4 | 1.9 | 2.6 | |
| 4-6 | 1.1 | 15 | 2.2 | 1.0 | 1.4 | 1.9 | 1.6 | 2.7 | 3.8 | 1.6 | 3.6 | 6.3 | 1.4 | 1.9 | 2.7 | 1.4 | 2.0 | 2.7 | |
| 7-12 | 1.2 | 1.6 | 2.3 | 1.0 | 1.4 | 2.0 | 1.9 | 3.0 | 4.1 | 2.1 | 4.3 | 7.3 | 1.5 | 2.1 | 2.8 | 1.5 | 2.1 | 2.9 | |
| year | 2 | 1.3 | 1.8 | 2.5 | 1.1 | 1.6 | 2.2 | 2.3 | 3.4 | 4.5 | 2.8 | 5.4 | 8.8 | 1.7 | 2.3 | 3.1 | 1.7 | 2.3 | 3.2 |
| 3 | 1.4 | 2.0 | 2.7 | 1.2 | 1.7 | 2.4 | 2.6 | 3.8 | 4.9 | 3.7 | 6.6 | 10.4 | 1.8 | 2.5 | 3.4 | 1.9 | 2.6 | 3.6 | |
| 4 | 1.5 | 2.1 | 2.9 | 1.3 | 1.9 | 2.6 | 2.9 | 4.1 | 5.3 | 4.5 | 7.7 | 11.8 | 2.0 | 2.7 | 3.7 | 2.1 | 2.8 | 3.8 | |
| 5 | 1.6 | 2.2 | 3.1 | 1.4 | 2.0 | 2.8 | 3.2 | 4.4 | 5.6 | 5.2 | 8.7 | 13.1 | 2.1 | 2.9 | 4.0 | 2.2 | 3.0 | 4.1 | |
| 6 | 1.7 | 2.4 | 3.3 | 1.5 | 2.1 | 2.9 | 3.4 | 4.6 | 5.8 | 5.9 | 9.7 | 14.3 | 2.3 | 3.1 | 4.2 | 2.4 | 3.2 | 4.4 | |
| 7 | 1.8 | 2.5 | 3.4 | 1.6 | 2.2 | 3.0 | 3.6 | 4.8 | 6.1 | 6.6 | 10.6 | 15.5 | 2.4 | 3.3 | 4.4 | 2.5 | 3.4 | 4.6 | |
| 8 | 1.9 | 2.6 | 3.6 | 1.7 | 2.3 | 3.2 | 3.8 | 5.0 | 6.3 | 7.2 | 11.4 | 16.6 | 2.5 | 3.4 | 4.7 | 2.7 | 3.6 | 4.8 | |
| 9 | 2.0 | 2.7 | 3.7 | 1.7 | 2.4 | 3.3 | 4.0 | 5.2 | 6.5 | 7.9 | 12.3 | 17.7 | 2.6 | 3.6 | 4.9 | 2.8 | 3.8 | 5.1 | |
| 10 | 2.1 | 2.8 | 3.9 | 1.8 | 2.5 | 3.5 | 4.1 | 5.4 | 6.7 | 8.5 | 13.1 | 18.8 | 2.8 | 3.8 | 5.1 | 2.9 | 3.9 | 5.3 | |
| 11 | 2.1 | 2.9 | 4.0 | 1.9 | 2.6 | 3.6 | 4.3 | 5.6 | 6.9 | 9.1 | 13.9 | 19.8 | 2.9 | 3.9 | 5.3 | 3.1 | 4.1 | 5.5 | |
| 12 | 2.2 | 3.1 | 4.2 | 2.0 | 2.7 | 3.7 | 4.5 | 5.8 | 7.1 | 9.7 | 14.7 | 20.8 | 3.0 | 4.1 | 5.5 | 3.2 | 4.3 | 5.8 | |
| 13 | 2.3 | 3.2 | 4.3 | 2.1 | 2.8 | 3.9 | 4.6 | 5.9 | 7.2 | 10.4 | 15.5 | 21.8 | 3.1 | 4.2 | 5.8 | 3.4 | 4.5 | 6.0 | |
| 14 | 2.4 | 3.3 | 4.5 | 2.1 | 2.9 | 4.0 | 4.7 | 6.1 | 7.4 | 11.0 | 16.3 | 22.7 | 3.2 | 4.4 | 6.0 | 3.5 | 4.6 | 6.2 | |
| 15 | 2.5 | 3.4 | 4.6 | 2.2 | 3.0 | 4.1 | 4.9 | 6.2 | 7.6 | 11.6 | 17.1 | 23.7 | 3.4 | 4.6 | 6.2 | 3.6 | 4.8 | 6.4 | |
| 16 | 2.6 | 3.5 | 4.8 | 2.3 | 3.1 | 4.2 | 5.0 | 6.4 | 7.7 | 12.1 | 17.8 | 24.6 | 3.5 | 4.7 | 6.4 | 3.8 | 5.0 | 6.7 | |
| 17 | 2.7 | 3.6 | 4.9 | 2.4 | 3.2 | 4.4 | 5.1 | 6.5 | 7.9 | 12.7 | 18.6 | 25.5 | 3.6 | 4.9 | 6.6 | 3.9 | 5.2 | 6.9 | |
| 18 | 2.7 | 3.7 | 5.1 | 2.4 | 3.3 | 4.5 | 5.3 | 6.6 | 8.0 | 13.3 | 19.3 | 26.4 | 3.7 | 5.0 | 6.8 | 4.1 | 5.4 | 7.1 | |
| BL (cm) | RVEDb-d z-Score | RVEDm-d z-Score | RVEDL z-Score | RVEDa z-Score | RVESL z-Score | RVESa z-Score | ||||||||||||
|---|---|---|---|---|---|---|---|---|---|---|---|---|---|---|---|---|---|---|
| −2 | 0 | 2 | −2 | 0 | 2 | −2 | 0 | 2 | −2 | 0 | 2 | −2 | 0 | 2 | −2 | 0 | 2 | |
| 50 | 0.7 | 1.3 | 1.9 | 0.6 | 1.2 | 1.7 | 1.3 | 2.3 | 3.3 | 1.5 | 2.5 | 4.0 | 1.2 | 1.7 | 2.3 | 0.8 | 1.4 | 2.4 |
| 55 | 0.8 | 1.4 | 2.0 | 0.7 | 1.2 | 1.8 | 1.5 | 2.5 | 3.5 | 1.8 | 2.9 | 4.7 | 1.3 | 1.8 | 2.4 | 1.0 | 1.6 | 2.8 |
| 60 | 0.9 | 1.5 | 2.1 | 0.7 | 1.3 | 1.9 | 1.6 | 2.6 | 3.7 | 2.1 | 3.3 | 5.4 | 1.4 | 1.9 | 2.6 | 1.1 | 1.9 | 3.2 |
| 65 | 1.0 | 1.6 | 2.2 | 0.8 | 1.4 | 2.0 | 1.8 | 2.8 | 3.9 | 2.4 | 3.8 | 6.1 | 1.5 | 2.0 | 2.7 | 1.3 | 2.2 | 3.6 |
| 70 | 1.0 | 1.7 | 2.3 | 0.9 | 1.5 | 2.1 | 1.9 | 3.0 | 4.0 | 2.7 | 4.3 | 6.8 | 1.6 | 2.1 | 2.9 | 1.5 | 2.4 | 4.1 |
| 75 | 1.1 | 1.8 | 2.4 | 1.0 | 1.6 | 2.2 | 2.1 | 3.2 | 4.2 | 3.0 | 4.8 | 7.6 | 1.7 | 2.2 | 3.0 | 1.6 | 2.7 | 4.6 |
| 80 | 1.2 | 1.9 | 2.5 | 1.0 | 1.7 | 2.3 | 2.3 | 3.3 | 4.4 | 3.4 | 5.3 | 8.4 | 1.7 | 2.4 | 3.2 | 1.8 | 3.1 | 5.1 |
| 85 | 1.3 | 2.0 | 2.6 | 1.1 | 1.7 | 2.4 | 2.4 | 3.5 | 4.6 | 3.7 | 5.9 | 9.2 | 1.8 | 2.5 | 3.3 | 2.0 | 3.4 | 5.6 |
| 90 | 1.4 | 2.1 | 2.8 | 1.2 | 1.8 | 2.5 | 2.6 | 3.7 | 4.8 | 4.1 | 6.4 | 10.1 | 1.9 | 2.6 | 3.5 | 2.2 | 3.7 | 6.1 |
| 95 | 1.4 | 2.1 | 2.9 | 1.2 | 1.9 | 2.5 | 2.8 | 3.9 | 5.0 | 4.5 | 7.0 | 11.0 | 2.0 | 2.7 | 3.7 | 2.5 | 4.1 | 6.7 |
| 100 | 1.5 | 2.2 | 3.0 | 1.3 | 2.0 | 2.6 | 2.9 | 4.0 | 5.2 | 4.9 | 7.7 | 11.9 | 2.1 | 2.8 | 3.8 | 2.7 | 4.4 | 7.3 |
| 105 | 1.6 | 2.3 | 3.1 | 1.4 | 2.1 | 2.7 | 3.1 | 4.2 | 5.4 | 5.4 | 8.3 | 12.8 | 2.2 | 3.0 | 4.0 | 2.9 | 4.8 | 7.9 |
| 110 | 1.7 | 2.4 | 3.2 | 1.5 | 2.1 | 2.8 | 3.3 | 4.4 | 5.5 | 5.8 | 8.9 | 13.8 | 2.3 | 3.1 | 4.2 | 3.2 | 5.2 | 8.5 |
| 115 | 1.7 | 2.5 | 3.3 | 1.5 | 2.2 | 2.9 | 3.4 | 4.6 | 5.7 | 6.3 | 9.6 | 14.8 | 2.4 | 3.2 | 4.4 | 3.4 | 5.6 | 9.1 |
| 120 | 1.8 | 2.6 | 3.4 | 1.6 | 2.3 | 3.0 | 3.6 | 4.8 | 5.9 | 6.7 | 10.3 | 15.8 | 2.5 | 3.4 | 4.5 | 3.7 | 6.0 | 9.8 |
| 125 | 1.9 | 2.7 | 3.5 | 1.7 | 2.4 | 3.1 | 3.7 | 4.9 | 6.1 | 7.2 | 11.0 | 16.8 | 2.6 | 3.5 | 4.7 | 3.9 | 6.4 | 10.4 |
| 130 | 2.0 | 2.8 | 3.6 | 1.8 | 2.5 | 3.2 | 3.9 | 5.1 | 6.3 | 7.7 | 11.7 | 17.9 | 2.7 | 3.7 | 4.9 | 4.2 | 6.8 | 11.1 |
| 135 | 2.1 | 2.9 | 3.7 | 1.8 | 2.6 | 3.3 | 4.1 | 5.3 | 6.5 | 8.2 | 12.5 | 19.0 | 2.9 | 3.8 | 5.1 | 4.5 | 7.3 | 11.8 |
| 140 | 2.2 | 3.0 | 3.8 | 1.9 | 2.6 | 3.4 | 4.2 | 5.5 | 6.7 | 8.8 | 13.3 | 20.1 | 3.0 | 4.0 | 5.3 | 4.8 | 7.7 | 12.5 |
| 145 | 2.2 | 3.1 | 3.9 | 2.0 | 2.7 | 3.5 | 4.4 | 5.6 | 6.9 | 9.3 | 14.0 | 21.2 | 3.1 | 4.1 | 5.5 | 5.1 | 8.2 | 13.2 |
| 150 | 2.3 | 3.1 | 4.0 | 2.0 | 2.8 | 3.5 | 4.6 | 5.8 | 7.0 | 9.8 | 14.8 | 22.3 | 3.2 | 4.3 | 5.7 | 5.4 | 8.7 | 14.0 |
| 155 | 2.4 | 3.2 | 4.1 | 2.1 | 2.9 | 3.6 | 4.7 | 6.0 | 7.2 | 10.4 | 15.6 | 23.5 | 3.3 | 4.4 | 5.9 | 5.7 | 9.2 | 14.7 |
| 160 | 2.5 | 3.3 | 4.2 | 2.2 | 3.0 | 3.7 | 4.9 | 6.2 | 7.4 | 11.0 | 16.5 | 24.7 | 3.5 | 4.6 | 6.1 | 6.0 | 9.7 | 15.5 |
| 165 | 2.6 | 3.4 | 4.3 | 2.3 | 3.0 | 3.8 | 5.1 | 6.3 | 7.6 | 11.6 | 17.3 | 25.9 | 3.6 | 4.8 | 6.3 | 6.4 | 10.2 | 16.3 |
| 170 | 2.6 | 3.5 | 4.4 | 2.3 | 3.1 | 3.9 | 5.2 | 6.5 | 7.8 | 12.2 | 18.2 | 27.1 | 3.7 | 4.9 | 6.5 | 6.7 | 10.7 | 17.1 |
| 175 | 2.7 | 3.6 | 4.5 | 2.4 | 3.2 | 4.0 | 5.4 | 6.7 | 8.0 | 12.8 | 19.1 | 28.4 | 3.9 | 5.1 | 6.7 | 7.0 | 11.2 | 17.9 |
| 180 | 2.8 | 3.7 | 4.6 | 2.5 | 3.3 | 4.1 | 5.6 | 6.9 | 8.2 | 13.5 | 20.0 | 29.6 | 4.0 | 5.3 | 7.0 | 7.4 | 11.8 | 18.7 |
| 185 | 2.9 | 3.8 | 4.7 | 2.6 | 3.4 | 4.2 | 5.7 | 7.0 | 8.3 | 14.1 | 20.9 | 30.9 | 4.1 | 5.5 | 7.2 | 7.8 | 12.3 | 19.6 |
| 190 | 3.0 | 3.9 | 4.8 | 2.6 | 3.4 | 4.3 | 5.9 | 7.2 | 8.5 | 14.8 | 21.8 | 32.2 | 4.3 | 5.6 | 7.4 | 8.1 | 12.9 | 20.4 |
Stay updated, free articles. Join our Telegram channel

Full access? Get Clinical Tree


