The aim of the present study was to investigate effects of aerobic interval training (AIT) versus moderate continuous training (MCT) on coronary atherosclerosis in patients with significant coronary artery disease on optimal medical treatment. Thirty-six patients were randomized to AIT (intervals at ≈ 90% of peak heart rate) or MCT (continuous exercise at ≈ 70% of peak heart rate) 3 times a week for 12 weeks after intracoronary stent implantation. Grayscale and radiofrequency intravascular ultrasounds (IVUS) were performed at baseline and follow-up. The primary end point was the change in plaque burden, and the secondary end points were change in necrotic core and plaque vulnerability. Separate lesions were classified using radiofrequency IVUS criteria. We demonstrated that necrotic core was reduced in both groups in defined coronary segments (AIT −3.2%, MCT −2.7%, p <0.05) and in separate lesions (median change −2.3% and −0.15 mm 3 , p <0.05). Plaque burden was reduced by 10.7% in separate lesions independent of intervention group (p = 0.06). No significant differences in IVUS parameters were found between exercise groups. A minority of separate lesions were transformed in terms of plaque vulnerability during follow-up with large individual differences between and within patients. In conclusion, changes in coronary artery plaque structure or morphology did not differ between patients who underwent AIT or MCT. The combination of regular aerobic exercise and optimal medical treatment for 12 weeks induced a moderate regression of necrotic core and plaque burden in IVUS-defined coronary lesions.
Physical activity is associated with reduced mortality risk in patients with coronary artery disease (CAD). Aerobic capacity is also found to be a strong predictor of mortality in patients with CAD. The mechanisms responsible for the favorable effects of exercise are not completely understood and may include both modification of cardiovascular risk factors and a direct effect on atherosclerosis. It is hypothesized that increased endothelial shear stress (ESS) produced by bouts of exercise acts antiatherogenically through the modulation of endothelial cell phenotypes. However, high ESS produced by exercise may also increase vulnerability in established plaques, possibly leading to coronary events. Three previous trials have documented favorable effects of exercise on CAD evaluated by coronary angiography. However, there is a paucity of data demonstrating effects of exercise on coronary atherosclerosis evaluated by intravascular ultrasound (IVUS). In the present study, we assessed the effects of 2 different aerobic exercise protocols on coronary plaque structure and morphology in patients with CAD using grayscale intravascular ultrasound (GS-IVUS) and radiofrequency intravascular ultrasound (RF-IVUS).
Methods
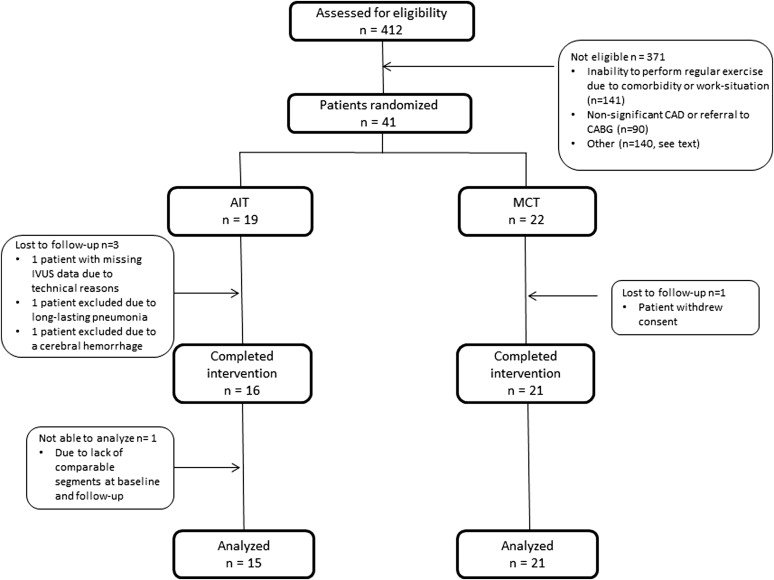
This was a single-center, open, parallel, randomized controlled trial. The study protocol was approved by the Regional Ethics Committee of Central Norway (2010/1112), registered at the ClinicalTrials.gov (identifier NCT01228201 ) and performed according to the Declaration of Helsinki. Written informed consent was obtained from all participants. Forty-one patients with angina pectoris or non-ST elevation acute coronary syndrome treated with stent implantation were found eligible and enrolled in the study from December 2010 to April 2012. An overview of the study, including the exclusion criteria, is presented in Figure 1 . All patients received standard in-hospital care and optimal medical treatment according to the current guidelines. After baseline data acquisition, patients were randomized to aerobic interval training (AIT, 19 patients) or moderate continuous training (MCT, 22 patients) by block randomization using a Web-based randomization tool. Data acquisition was repeated at follow-up 2 to 3 days after completed intervention.
An individually adjusted cardiopulmonary exercise test was performed on treadmills (Woodway PPS55, Weil am Rhein, Germany), and gas exchange data were analyzed (Oxycon Pro; Jaeger, Hoechberg, Germany). Peak oxygen uptake (VO 2peak ) was calculated as the mean of the 3 highest VO 2 measurements during the test. The highest heart rate (HR) during the test was recorded as peak HR, and HR recovery was defined as the change in peak HR to HR after 1 minute of rest. Subjective perception of exertion was assessed using the Borg 6-20 scale.
All patients exercised on treadmills 3 times a week for 12 weeks with attendance ≥ 90% of sessions in all patients. Training sessions were supervised by experienced staff, and patients used HR monitors (Polar Electro, Kempele, Finland) to help achieve target HR during exercise. The AIT program was based on previous protocols from our research group and consisted of 10 minutes of warm-up followed by intervals of 4 times 4 minutes, with an active pause of 3-minute in-between intervals and at the end. The target HR was 85% to 95% of the peak HR during intervals and 70% of peak HR in the active pause. The MCT program was isocaloric to the AIT program and consisted of continuous walking or light running for 46 minutes at 70% of maximum HR.
Quality of life parameters were assessed by the MacNew Heart Disease Health-Related Quality of Life Questionnaire. A fasting venous blood sample was analyzed for glucose, total cholesterol, low-density lipoprotein cholesterol, high-density lipoprotein cholesterol, triglycerides, glycosylated hemoglobin, N-terminal pro-brain natriuretic peptide, and C-reactive protein. Endothelial-dependent vasodilation in the brachial artery was estimated by flow-mediated vasodilation (FMD) according to guidelines using a 12-MHz Doppler Probe (Vivid 7 System; GE Vingmed Ultrasound, Horten, Norway). Images were analyzed by an independent observer using an automatic edge detection software (Vascular Research Tools 5; Medical Imaging Applications LLC, Coralville, IA). The percentage FMD normalized for shear rate was reported.
Coronary angiography and percutaneous coronary intervention with stent implantation were performed in accordance with international guidelines. Drug-eluting stents (Xience Everolimus Eluting Stents, Abbot Vascular, Santa Clara, CA or Resolute Integrity Zotarolimus Eluting Stents, Medtronic Inc, Minneapolis, MN) were used in all patients except 4 (1 in the AIT group and 3 in the MCT group) who received bare metal stents (Integrity, Medtronic Inc). GS- and RF-IVUS were performed without complications, after intracoronary administration of 200 μg of nitroglycerin, using the Eagle Eye Platinum IVUS 20 MHz probe (Volcano Corporation, Rancho Cordova, CA) with a pullback rate of 0.5 mm/s (Volcano R100 pullback device). RF backscatter data were collected with a dedicated console (Volcano Corporation) at every R-peak on the electrocardiogram. The IVUS probe was advanced as far distally as possible and >10 mm beyond the distal stent edge, and pullbacks were continued through the stented region and proximally into the ostium of the index artery. Data were stored digitally for analyses at an independent core laboratory (Krakow Cardiovascular Research Institute, Krakow, Poland). All analysts were blinded to clinical data and randomization group.
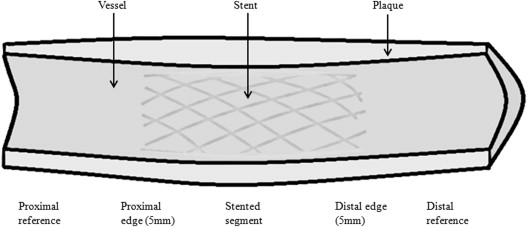
Intravascular data were analyzed (QIvus software 2.1; Medis Medical Imaging Systems, Leiden, The Netherlands) by automatic contour detection of lumen and vessel according to current recommendations. The analyst optimized contours through image characteristic settings and compared the correctness of each edge of automatically drawn contours. Matched coronary segments at baseline and follow-up were identified using fiduciary points, such as side braches and the implanted stent. Parts of segments that were not visible in both pullbacks were excluded. Two regions of interest were defined in the analytic plan: the distal segment, starting distally as far as possible to 5 mm from the distal stent edge, and the proximal segment, starting 5 mm from the proximal stent edge to as far proximally as possible ( Figure 2 ). The following GS-IVUS parameters were computed: minimal lumen area, plaque burden (plaque plus media area divided by the vessel area), total atheroma volume (cross-sectional area of external elastic membrane minus cross-sectional area of lumen) normalized for segment length, and remodeling index (cross-sectional area of external elastic membrane at minimal lumen area divided by the cross-sectional area of external elastic membrane at the smallest plaque burden). The RF-IVUS parameters were computed based on spectral analysis of the backscattered RF data. Absolute volumes and percentage volumes of fibrous, fibro-fatty, necrotic core, and dense calcium components were analyzed (data not shown for other tissue components than necrotic core).
Morphologic patterns were classified by identifying plaques with a plaque burden >40% over 3 consecutive frames separated by 5 mm lengths of artery with a plaque burden <40% (defined as separate lesions). Separate lesions were classified according to the American Heart Association histological classification adapted for RF-IVUS and in terms of vulnerability in the following order: intimal medial thickening, pathologic intimal thickening, fibrotic or fibrocalcific, fibroatheroma or calcified fibroatheroma, and thin-capped fibroatheroma (TCFA) or calcified thin-capped fibroatheroma (CaTCFA), with TCFA or CaTCFA being highest risk plaques. Inter- and intraobserver variability for RF-IVUS analyses (performed on 221 regions of interest) showed good to excellent correlation between 2 different analysts and for a single analyst (κ = 0.79 and κ = 1, respectively).
The primary end point was defined as change in plaque burden for the proximal and distal coronary segment and for separate lesions. The secondary end points were defined as change in necrotic core for the proximal and distal coronary segment and for separate lesions and change in plaque vulnerability for separate lesions. Data were analyzed using SPSS (version 20.0; IBM, Chicago, IL), Stata (version 12.1; StataCorp, College Station, TX), and Minitab (version 16.2.1; Minitab, State College, PA). Data are given as frequencies and percentages or medians with 95% confidence intervals in parenthesis because many variables were not normally distributed. Baseline characteristics were compared using the chi-square test or Mann-Whitney U test. Data measured twice were analyzed using repeated measures analysis of variance and linear mixed models with maximum likelihood estimation. Where appropriate, plaques in each patient were clustered by patient number. Variables were logarithmically transformed if necessary to achieve adequate model fit. p values <0.05 were considered statistically significant.
Results
One patient in the AIT group was excluded because of a cerebral hemorrhage. Otherwise, there were no adverse events in the study. Furthermore, 3 patients did not complete intervention, and data from 1 patient were not possible to analyze ( Figure 1 ).
Baseline clinical characteristics are given in Table 1 . The distal segment length was longer in the MCT group (p <0.05), and therefore, total atheroma volume was normalized for segment length in the analyses as recommended. Twelve patients in the AIT group and 7 patients in the MCT group had used statins for >6 months before study inclusion (difference between groups, p <0.05). Otherwise, statins were initiated at the time of admission ± 1 day. To account for potential confounding from differences in statin use, changes in plaque burden and necrotic core were calculated between the different categories of statin users, with and without inclusion of exercise group affiliation. There were no differences in the reduction of necrotic core or plaque burden between the different statin groups in any analyses (data not shown, p >0.5 for all tests).
| Variable | Aerobic Interval Training (n = 15) | Moderate Continuous Exercise (n = 21) |
|---|---|---|
| Age (years) | 55.5 (50–60.5) | 60.5 (56.5–63.5) |
| Male/female | 14/1 | 15/6 |
| Current smoker | 3 (20%) | 3 (14%) |
| Hypertension | 8 (53%) | 12 (57%) |
| Diabetes mellitus | 5 (33%) | 3 (14%) |
| Hypercholesterolemia | 4 (27%) | 7 (33%) |
| Prior myocardial infarction | 1 (7%) | 4 (19%) |
| Prior percutaneous coronary intervention | 3 (20%) | 5 (24%) |
| Current diagnosis | ||
| Angina pectoris | 7 (47%) | 11 (52%) |
| NSTE-ACS | 8 (53%) | 10 (48%) |
| No. of coronary arteries narrowed | ||
| 1 | 11 (73%) | 13 (62%) |
| 2 | 3 (20%) | 8 (38%) |
| 3 | 1 (7%) | 0 (0%) |
| Target coronary artery location | ||
| Left ascending | 9 (60%) | 10 (48%) |
| Circumflex | 2 (13%) | 4 (19%) |
| Right | 4 (27%) | 7 (33%) |
| Segments assessed | ||
| Distal to the stent | 11 | 17 |
| Proximal to the stent | 9 | 14 |
| Segment lengths (mm) | ||
| Distal to the stent | 14.1 (7.1–22.0) | 25.0 (19.2–31.6) ∗ |
| Proximal to the stent | 13.5 (7.5–23.0) | 15.2 (9.8–20.7) |
| Identified separate lesions | 52 (36%) | 92 (64%) |
| Medication | ||
| Aspirin | 15 (100%) | 21 (100%) |
| Clopidogrel | 15 (100%) | 21 (100%) |
| Statins | 15 (100%) | 21 (100%) |
| Simvastatin 40 mg | 12 (80%) | 15 (71%) |
| Atorvastatin 40 mg | 3 (20%) | 6 (29%) |
| Beta blockers | 12 (80%) | 15 (71%) |
| ACE enzyme inhibitors or angiotensin II receptor antagonists | 8 (53%) | 11 (52%) |
Table 2 presents anthropometric data, biomarkers, and FMD. There was a trend for improvement in FMD in both groups (p = 0.07), with no difference between groups. Quality of life parameters (emotional, physical, and social domains) improved in both groups (p <0.05), with no difference between groups (data not shown). VO 2peak improved in both groups (p <0.001), and the improvement was larger in the AIT group (p <0.05, Table 3 ).
| Aerobic Interval Training | Moderate Continuous Exercise | |||
|---|---|---|---|---|
| Baseline | Follow-Up | Baseline | Follow-Up | |
| Body mass index (kg/m 2 ) | 27.3 (25.3–29.4) | 27.4 (25.6–29.2) | 26.3 (24.7–28.3) | 26.3 (24.5–28.3) |
| Waist circumference (cm) | 100 (93–104) | 100 (92–102) | 100 (94–104) | 97 (92–102) |
| C-reactive protein (mg/L) | 3.65 (1.55–5.93) | 2.30 (1.35–3.63) | 2.57 (1.59–3.75) | 1.93 (1.17–3.9) |
| N-terminal pro-brain natriuretic peptide (ng/L) | 65 (45–161) | 67 (28–199) | 189 (104–372) | 118 (75–207) |
| Glucose (mmol/L) | 5.8 (5.5–7.2) | 6.0 (5.5–6.9) | 5.8 (5.5–6.2) | 5.8 (5.5–6.3) |
| Glycosylated hemoglobin (%) | 5.8 (5.5–7.1) | 5.8 (5.5–6.5) | 5.9 (5.7–6.2) | 5.8 (5.6–6.1) |
| Total cholesterol (mmol/L) | 4.3 (3.8–4.6) | 4.2 (3.7–4.7) | 4.4 (4.2–4.6) | 4.4 (4.2–4.7) |
| LDL-cholesterol (mmol/L) | 2.4 (2.2–2.7) | 2.2 (2.0–2.6) | 2.4 (2.2–2.7) | 2.3 (2.2–2.5) |
| HDL-cholesterol (mmol/L) | 1.2 (1.0–1.4) | 1.2 (1.1–1.4) | 1.3 (1.1–1.5) | 1.4 (1.2–1.6) |
| Triglycerides (mmol/L) | 1.1 (0.9–1.9) | 1.2 (1.0–1.7) | 1.2 (1.0–1.5) | 1.3 (1.0–1.8) |
| Flow-mediated vasodilation (%) | 8.4 (5.2–12.1) | 11.3 (7.3–16.7) | 11.9 (7.2–17.0) | 15.1 (9.8–24.6) |
| Aerobic Interval Training | Moderate Continuous Training | |||
|---|---|---|---|---|
| Baseline | Follow-Up | Baseline | Follow-Up | |
| Resting heart rate (beats/min) | 61 (56–65) | 58 (52–63) | 58 (54–63) | 59 (55–63) |
| Peak heart rate (beat/min) | 158 (150–167) | 162 (154–169) | 155 (146–164) | 158 (148–168) |
| Heart rate recovery, 1 minute | 29 (24–33) | 30 (26–36) | 27 (24–31) | 27 (24–31) |
| Peak oxygen uptake (mL*kg −1 *min −1 ) | 31.2 (29.1–34) | 34.5 (32.3–37.9) ∗ † | 29.8 (27.5–33.7) | 31.8 (29.1–35.4) ∗ |
| Peak oxygen uptake (mL*min −1 ) | 2750 (2423–2954) | 3084 (2730–3385) ∗ † | 2545 (2146–2888) | 2722 (2307–3101) ∗ |
| Respiratory exchange ratio at peak oxygen uptake | 1.12 (1.09–1.14) | 1.12 (1.10–1.15) | 1.11 (1.09–1.14) | 1.11 (1.09–1.13) |
| Borg scale at peak oxygen uptake | 17 (16–17) | 18 (17–18) | 17 (16–18) | 18 (17–18) |
∗ Significant within-group difference from baseline to follow-up (p <0.05).
† Significant between-group difference from baseline to follow-up (p <0.05).
Twenty coronary segments and 52 separate lesions in the AIT group and 31 coronary segments and 92 separate lesions in the MCT group were analyzed ( Table 4 ). Necrotic core was significantly reduced, independent of intervention group, both in separate lesions and in distal coronary segments. In separate lesions, the median reduction was −2.3% (−4.4, −0.3) when analyzing all lesions (p <0.05) and −0.15 mm 3 (−0.04, −0.27) when lesions were clustered per patient (p <0.05). There was a strong trend toward a reduction in plaque burden of −10.7% (−21.7, 0.4) independent of intervention group in separate lesions (p = 0.06).


