In patients with patent foramen ovales (PFOs) and cryptogenic stroke, observational studies have demonstrated reductions in recurrent neurologic events with transcatheter PFO closure compared with medical therapy. Randomized controlled trials and meta-analyses have shown a trend toward benefit with device closure. The cost-effectiveness of PFO closure has not been described. Therefore, a detailed cost analysis was performed using pooled weighted outcome and complication rates from published randomized controlled trials, Medicare cost tables, and wholesale medication prices. Incremental cost per life-year gained and per quality-adjusted life-year (QALY) gained by PFO closure was calculated. The commonly accepted cost-effectiveness threshold of <$50,000/quality-adjusted life-year gained was used. At 2.6 years (the mean duration of randomized controlled trial follow-up), PFO closure was more costly ($16,213, 95% confidence interval [CI] $15,753 to $16,749) per patient, with a cost of $103,607 (95% CI $5,826 to $2,544,750) per life-year gained. The expenditure to prevent 1 combined end point (transient ischemic attack, stroke, and death) at 2.6 years was $1.09 million (95% CI $1.04 million to $1.20 million). Modeling the costs of medical treatment prospectively, PFO closure reached cost-effectiveness (<$50,000/quality-adjusted life-year gained) at 2.6 years (95% CI 1.5 to 44.2). At 30.2 years (95% CI 28.2 to 36.2), the per patient mean cost of medical therapy exceeded that of PFO closure. In conclusion, PFO closure is associated with higher expenditures related to procedural costs; however, this increase may be offset over time by reduced event rates and costs of long-term medical treatment in patients who undergo transcatheter PFO closure. In younger patients typical of cryptogenic stroke, PFO closure may be cost effective in the long term.
Highlights
- •
This study was a detailed cost analysis of pooled data from randomized controlled trials of PFO closure for patients with cryptogenic stroke.
- •
PFO closure was found to be immediately more costly per patient (incremental increased cost by PFO closure $16,213).
- •
PFO closure reached cost-effectiveness (<$50,000/QALY gained) at 2.6 years of follow-up.
- •
At 30.2 years, the per patient mean cost of medical therapy exceeded that of PFO closure.
- •
In younger patients typical of cryptogenic stroke, cost modeling supports the cost-effectiveness of PFO closure in the long term.
The weight of evidence from observational studies suggests an association between cryptogenic stroke and patent foramen ovale (PFO). Furthermore, the presence of a PFO is associated with a 3-fold increased risk for recurrent stroke. Therefore, it is has been postulated that closure of PFOs would result in a decreased risk for recurrent neurologic events (transient ischemic attack [TIA], stroke, or death due to stroke) through the elimination of the conduit for paradoxical embolism. Current guidelines recommend consideration of PFO closure only after a second cryptogenic stroke on medical therapy. Recent randomized controlled trials (RCT) and meta-analyses of RCTs have demonstrated a nearly statistically significant trend toward a benefit of PFO closure in this population. However, a cost analysis of PFO closure in the context of these 3 RCTs has not been performed. Therefore, the purpose of this analysis was to perform a detailed cost analysis to investigate whether transcatheter closure of a PFO in addition to medical therapy compared with medical therapy alone is cost effective.
Methods
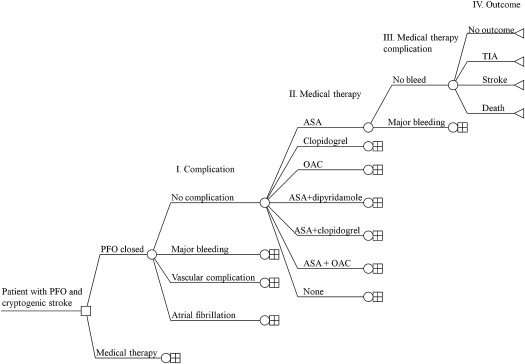
A decision tree was constructed ( Figure 1 ) to ensure that all permutations of outcome probabilities, complication probabilities, procedural and medication probabilities, and medication complication probabilities were accounted for in the cost calculations.
End point and complication costs were calculated assuming an even distribution of event risk across all patients, and on the basis of the previously reported end point event rates, pooled weighted probabilities for stroke, TIA, and death were annualized. Each annualized end point event probability ( Table 1 ) was multiplied by the cost of that particular outcome to determine the annual end point event cost per patient. The annualized cost of complications (atrial fibrillation, major bleeding, and vascular complications) per patient was also estimated in a similar manner. Vascular complications were assumed to occur only in the immediate and reported follow-up period. Assuming an even distribution of complication risk across all patients, and on the basis of the previously reported complication event rates, pooled and weighted probabilities for atrial fibrillation, major bleeding, and vascular complications were annualized. Each annualized complication event probability ( Table 1 ) was multiplied by the cost of that particular complication to determine the annual complication cost per patient.
| Event | Annual Probability of Event | |
|---|---|---|
| PFO Closure | Medical Therapy | |
| Death | 0.0023 | 0.0037 |
| Transient Ischemic Attack | 0.0087 | 0.0102 |
| Stroke | 0.0084 | 0.0120 |
| Atrial Fibrillation | 0.0133 | 0.0027 |
| Major Bleeding | 0.0046 | 0.0024 |
| Major vascular complication | 0.0063 | 0.0000 |
Procedural costs were calculated assuming the Medicare cost for diagnosis-related group 251, for “percutaneous cardiac procedure without PCI,” for fiscal year 2011 in a patient aged 45 to 64 years, given that the average patient age in the meta-analysis of the RCTs was 45.7 years.
Medication costs were calculated on the basis of the RCT-reported rates of specific medication regimens and assuming an even distribution of medication probability across all patients. The pooled and weighted daily probabilities were calculated for a patient to receive a specific medication regimen for 1 to 30, 31 to 90, 91 to 180, and >180 days. These probabilities were multiplied by the number of days they were prescribed, the daily medication cost, and the associated costs for that medication regimen. The annual medication cost was determined from the sum of these medication costs over the length of follow-up.
Medication-associated major bleeding complications were assumed to begin after the conclusion of study reported follow-up, because each study reported the complications that occurred during the follow-up period. Individual medication bleeding costs were determined as the sum of the products of each medication regimen: the probability of bleeding multiplied by the probability of a patient receiving the specific medication regimen multiplied by the cost of major bleeding. The annual probability of major bleeding on the basis of the medication regimen was determined from previously published rates of major bleeding for the each individual medication regimen.
Total costs were estimated by summing the procedural costs, end point event costs, complication costs, medication costs, and medication-associated major bleeding costs over the duration of follow-up.
Next, an incremental cost per life-year analysis for PFO closure was performed using the average patient in the RCTs : a 45.7-year-old man. The presumed life expectancy for this 46-year-old man was determined from 2009 Social Security tables ( Table 2 ). The presumed life expectancy was used to calculate life-years lost because of death. The life-years lost because of stroke and TIA were determined by multiplying the annual probability of death after TIA or stroke by the presumed life expectancy ( Table 2 ). The annual incremental risk for death, TIA, and stroke was calculated between PFO closure and medical therapy and multiplied by each respective life-year lost and then summed to determine the annual life-years gained by a patient who underwent PFO closure. To determine the cost per life-year gained, the incremental cost increase per PFO closure for the length of follow-up was divided by the life-years gained by closure for the length of follow-up. To determine the cost per quality-adjusted life-year (QALY) gained, the incremental cost increase per PFO closure for the length of follow-up was divided by the QALYs gained by closure for the length of follow-up. QALYs gained were calculated from previously published QALY adjustments: 0.87 for TIA and 0.52 for stroke. A willingness-to-pay threshold of <$50,000/QALY gained was used to define incremental cost-effectiveness.
| Reference | ||
|---|---|---|
| Mean Age | 45.7 years | |
| Mean Gender | Male | |
| Annual probability of death (FY2009, assume 46 year old male) | 0.003703 | http://www.ssa.gov/oact/STATS/table4c6.html ; Accessed 05NOV13 |
| Presumed life expectancy (FY2009, assume 46 year old male) | 32.8 years | http://www.ssa.gov/oact/STATS/table4c6.html ; Accessed 05NOV13 |
| Predicted age of death | 78.5 years | http://www.ssa.gov/oact/STATS/table4c6.html ; Accessed 05NOV13 |
| Annual probability of death after TIA | 0.047 | van Wijk et al Lancet 2005; 365:2098-2104 |
| QALY adjustment for TIA | 0.87 | Tengs TO, Lin LH Pharmacoeconmonics 2003; 21:191-200 |
| QALY lost by TIA | 5.81 | |
| Life-Year lost by TIA | 1.54 | |
| Annual probability of death after stroke | 0.091 | Dennis MS et al Stroke 1993; 24: 796-800 |
| QALY adjustment for stroke | 0.52 | Tengs TO, Lin LH Pharmacoeconmonics 2003; 21:191-200 |
| QALY lost by stroke | 18.7 | |
| Life-Year lost by stroke | 2.98 |
The Amplatzer device (St. Jude Medical, St. Paul, Minnesota) has been shown to result in a statistically significant reduction in stroke. Therefore, a sensitivity analysis using the same modeling was also completed for only those RCTs in which the Amplatzer device was implanted.
Results
The pooled length of study follow-up was 2.6 years. When modeled to study conclusion (2.6 years), the per patient costs associated with PFO closure were more than for medical therapy alone, primarily as a result of PFO closure procedural costs ( Table 3 ). The expenditure to prevent 1 combined end point (TIA, stroke, or death) at 2.6 years was in excess of $1.0 million. At study conclusion, the incremental cost per life-year gained was slightly greater than $100,000.
| Base Case | 95% Confidence Interval | Amplatzer™ Only | 95% Confidence Interval | |
|---|---|---|---|---|
| Time of follow up (years) | 2.6 | 2.0–4.1 | 4.1 | 2.6–4.1 |
| Total cost at study conclusion | ||||
| PFO closure group | $19,365 | $18,103–$20,899 | $18,852 | $18,496–$19,909 |
| Medical therapy group | $3,152 | $2,312–$4,112 | $4,505 | $3,211–$6,115 |
| Difference | $16,213 | $15,753–$16,749 | $ 14,346 | $13,794–$15,284 |
| Cost per event prevented | CEP: $1,085,334 | $1.04–$1.20 million | Stroke: $648,044 ∗ | $486,799–$856,615 |
| Incremental cost per LY gained at study conclusion | $103,607 | $5,826–$2,544,750 | $72,047 | -$16,750– † |
| Incremental cost per QALY gained at study conclusion | $50,692 | $29,264–$101,356 | $26,466 | $4,120–$154,090 |
| Time to <$50,000/QALY (years) | 2.6 | 1.5–44.2 | 2.38 | 0.5–10.0 |
| Time to <$50,000/LY (years) | 4.9 | 1.6– † | 5.5 | 2.5– † |
| Time to total medical costs > PFO closure costs (years) | 30.2 | 28.2–36.2 | 22.1 | 18.3–28.3 |
∗ Stroke, as opposed to CEP, is reported for Amplatzer™ as this is the only endpoint where PFO closure was shown in meta-analysis to result in a statistically significant benefit.
† Upper limit cannot be estimated due to 95% Confidence interval absolute risk difference crossing zero.
At study conclusion, medicine costs and outcome costs were greater in the medical therapy group. However, complication costs and procedural costs were greater in the PFO closure group ( Table 4 ). The complication costs were higher in the PFO closure group for atrial fibrillation, vascular complications, and major bleeding. When costs were extrapolated to 5 years, the medication cost remained higher in the medical group and the difference in outcomes costs for medical therapy group compared with closure became larger. At 5 years, the major bleeding cost associated with PFO closure was smaller than that for medical therapy; however, the cost from atrial fibrillation remained higher in the PFO closure group ( Table 4 ).
| PFO Closure | Medical Therapy | |
|---|---|---|
| PFO Closure Procedure Cost † | $17,403.00 | $0.00 |
| Outcomes | ||
| Death | $69.13 | $112.43 |
| TIA | $53.45 | $62.45 |
| Stroke | $181.96 | $259.43 |
| Annual Sum | $304.54 | $434.31 |
| Complications | ||
| Atrial Fibrillation | $115.60 | $23.72 |
| Major Bleeding | $40.67 | $21.13 |
| Major vascular complication | $27.04 | $0.00 |
| Annual Sum | $183.31 | $44.85 |
| Medical therapy | ||
| Mean Weighted Cost (1st 30 days) | $178.51 | $48.32 |
| Mean Weighted Cost (30–180 days) | $440.03 | $241.61 |
| Mean Weighted Cost (after 180 days) | $33.37 | $719.11 |
| Annual Cost (1st 365 days) | $651.90 | $1009.05 |
| Annual Cost (after 1st 365 days) | $26.03 | $560.85 |
| Follow-up (years) | 2.6 | 2.6 |
| Costs at study completion (2.6 years) | ||
| Procedural cost | $17,403.00 | $0.00 |
| Outcomes | $791.81 | $1129.21 |
| Complications | $476.61 | $116.62 |
| Medical regimen | $693.55 | $1906.41 |
| Total | $19,364.97 | $3152.23 |
| Annual cost of complications after follow-up (after 2.6 years) | ||
| Atrial Fibrillation | $115.60 | $23.72 |
| Major Bleeding | $47.97 | $62.68 |
| Major vascular complication | $0.00 | $0.00 |
| Annual Sum | $163.56 | $86.40 |
| Modeling to 5.0 years (after 2.6 years) | ||
| Procedural cost | $0.00 | $0.00 |
| Outcomes | $730.90 | $1042.35 |
| Complications | $392.55 | $207.36 |
| Medical regimen | $62.46 | $1346.03 |
| Total (costs after 2.6 years) | $1185.91 | $2595.74 |
| Costs at study completion (up to 2.6 years) | $19,364.97 | $3152.23 |
| Total cost modeled to 5.0 years | $20,550.88 | $5747.97 |
Stay updated, free articles. Join our Telegram channel

Full access? Get Clinical Tree


