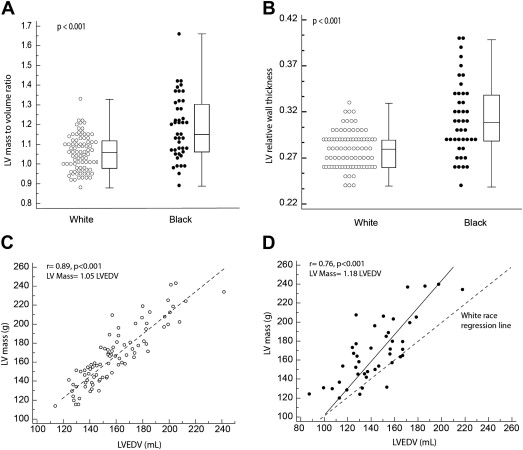
Athletic training is associated with increases in ventricular mass and volume. Recent studies have shown that left ventricular mass increases proportionally in white athletes with a mass/volume ratio approaching unity. The objective of this study was to compare the proportionality in ventricular remodeling and ventricular function in black versus white National Collegiate Athletic Association Division I football players. From 2008 to 2011, football players at Stanford University underwent cardiovascular screening with a 12-point history and physical examination, electrocardiography, and focused echocardiography. Compared with white players, black players had on average higher left ventricular mass indexes (77 ± 11 vs 71 ± 11 g/m 2 , p = 0.009), higher mass/volume ratios (1.18 ± 0.16 vs 1.06 ± 0.09 g/ml, p <0.001), and higher QRS vector magnitudes (3.2 ± 0.7 vs 2.7 ± 0.8, p = 0.002). Black race had an odds ratio of 14 (95% confidence interval 5 to 42, p <0.001) for a mass/volume ratio >1.2. Mass/volume ratio was inversely related to early diastolic tissue Doppler velocity e′ (r = −0.50, p <0.001) but not to QRS vector magnitude (r = 0.065, p = 0.034). With regard to systolic indexes, there was no significant difference in the left ventricular ejection fraction, velocity of circumferential shortening, and isovolumic acceleration. In conclusion, black college football players exhibit more concentric ventricular remodeling, lower early diastolic annular velocities, and increased ventricular voltage compared with white players. Ventricular mass increases proportionally to volume in white players but not in black players.
Athletic training is usually associated with an increase in left ventricular (LV) wall thickness, mass, and volume. These changes in cardiac structure are referred to as “athlete’s heart.” Caselli et al recently showed that the increase in LV mass in Olympic athletes was proportional to the increase in ventricular volume, resulting in a mass/volume ratio approaching unity (i.e., 1 g/ml). Turkbey et al also recently showed in a large community-based study that the level of activity does not influence the age-adjusted LV mass/volume ratio. At present, it is not well established whether the increase in ventricular mass in black athletes is proportional to the increase in ventricular volume. In this study, we sought to compare the proportionality of ventricular remodeling between black and white college football athletes and to determine whether differences in diastolic and electrocardiographic parameters are associated with differences in ventricular mass/volume ratios.
Methods
Since 2008, athletes participating in National Collegiate Athletic Association Division IA college football at Stanford University have undergone cardiovascular screening that involves a complete history and physical examination, electrocardiography, and focused echocardiography. Blood pressure at rest is also recorded on the same day as echocardiography. The institutional review board at Stanford approved the research protocol, and informed consent was obtained from each player.
All football players participating in Division IA football from 2008 to 2011 were considered for inclusion in the study (n = 143). During the first year of the screening program, freshmen and sophomores were screened, but from 2009 onward, the screening program included mainly freshmen, who account for 28 to 32 new players yearly. Race was assigned by self-assessment using a questionnaire filled in by participants. For the purpose of comparing ventricular remodeling in black and white players, we excluded participants of Pacific Islander race (n = 7) or mixed race (n = 1). The terms “black” and “white” for races were chosen to be consistent with United States census terminology. In addition, participants in whom echocardiography was not available for review were also excluded from the study (n = 5). Before initiation of the study, we also decided to exclude from the analysis participants with potentially pathologic forms of ventricular remodeling or dysfunction according to the following criteria: LV wall thickness >13 mm or LV ejection fraction (LVEF) <45%; 1 participant with an LVEF of 42% and significant LV enlargement was excluded from the analysis and referred to the cardiomyopathy clinic. The final cohort consisted of 129 players, of whom 43 were black. Football players were further characterized according to whether they played in the lineman position or not. Linemen were defined to include tackles, guards, defensive ends, and offensive centers. Linemen tend to be physically larger than other players, and their role favors highly isometric physical exertion directly against each other in order to protect offensive players (offensive linemen) or interrupt offensive play (defensive linemen).
Echocardiographic images were acquired using a Philips iE33 system (Philips Medical Systems, Andover, Massachusetts). The focused echocardiographic protocol consisted of parasternal long-axis views of the left ventricle, long-axis views of the aortic root and ascending aorta, basal short-axis views of the origin of the coronary arteries, midpapillary short-axis views of the left ventricle, and apical 4-chamber views and pulsed tissue Doppler of the lateral mitral annulus. Digitized images of 3 beats were stored. The acquisition time averaged 7 min/study. All measurements were averaged over 3 consecutive cycles.
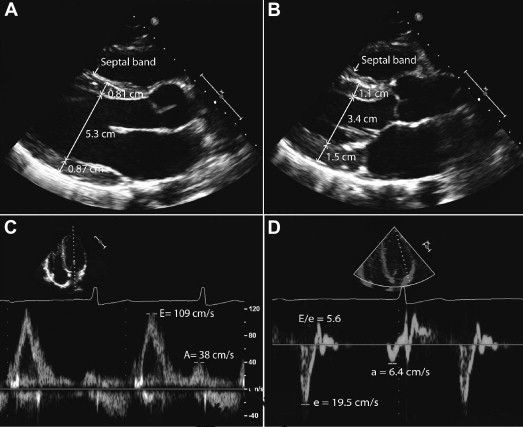
Digitized images were analyzed by a cardiologist (F.H.) blinded to the race, age, position, and blood pressure of study participants. LV internal dimension (LVID), septal wall thickness, and posterior wall thickness were measured in the parasternal long-axis view at end-diastole and end-systole according to the guidelines of the American Society of Echocardiography. In measuring septal thickness, we excluded right ventricular septal bands, and in measuring LV posterior wall thickness, we excluded the posterior wall chordae ( Figure 1 ). Left atrial linear dimension was measured from the parasternal long-axis view.
Relative wall thickness was defined in diastole as the ratio of (septal wall thickness + posterior wall thickness) to LVID. LV mass was calculated on the basis of a prolate ellipse model of the left ventricle according to the following formula: LV mass = 0.8 × {1.04[(LVID + posterior wall thickness + septal wall thickness) 3 − (LVID in diastole) 3 ]} + 0.6 g. LV volume was calculated using the Teichholz method as [7/(2.4 + LVID)] × LVID 3 . LV dimensions and mass were indexed to body surface area (BSA) as well as to height using a validated scaling exponential factor of 2.7. LV hypertrophy was defined as a ventricular mass >116 g/m 2 for men on the basis of American Society of Echocardiography guidelines or >48 g/m 2.7 when based on LV mass indexed for height to the 2.7th power. The LVEF was calculated using the monoplane Simpson’s method. The velocity of circumferential shortening was calculated as the ratio of fractional shortening divided by systolic time. Myocardial acceleration of isovolumic contraction represents a less load dependent measure of ventricular contractility and was measured from the pulsed tissue Doppler signal of mitral annular motion. Ventriculoarterial coupling was estimated from the ratio of end-systolic arterial elastance and end-systolic pressure to volume. This represents a simplification because ventricular volume at rest is not equal to zero.
LV diastolic parameters were derived from the tissue Doppler signal of the lateral mitral annulus. The early maximal diastolic velocity (e′) represents a surrogate for myocardial relaxation ( Figure 1 ). Isovolumic relaxation time was measured as the time between the end of the systolic tissue Doppler signal and the beginning of the early diastolic tissue Doppler velocity. Tissue Doppler LV myocardial performance index was calculated as the ratio of isovolumic relaxation and contraction times divided by the ejection time. Myocardial performance index represents a measure of systolic and diastolic function. A higher myocardial performance index value is associated with decreased ventricular function.
The electrocardiograms were acquired using a Philips TraceMaster system (Philips Medical Systems, Best, The Netherlands). The electrocardiograms were interpreted by an investigator blinded to the echocardiographic findings (V.F.). The main voltage criterion consisted of the sum of the absolute values of the S wave in lead V 2 and the R wave in lead V 5 . This criterion reflects total net voltage across the precordium in healthy subjects. Similar to the Sokolow-Lyon criteria, it has been traditionally been viewed as a correlate of LV mass.
Results are expressed as mean ± SD for continuous variables and as number of cases and percentage for categorical variables. Comparison of groups was performed using Student’s t test for continuous variables and chi-square tests. Regression analysis was used to determine relations between continuous variables. Logistic regression analysis was also used to determine factors associated with the mass/volume ratio, indexed ventricular mass, and e′ velocity. For the mass/volume ratio, a value of 1.2 was used as the upper limit of normal on the basis of values from the study of Caselli et al (the upper limit of control values in their study). A threshold higher or lower than the 75th percentile of the study cohort was used to categorize indexed ventricular mass and e′ velocity. Variables considered in the models included age, race, position played, systolic blood pressure, and for e′ velocity mass/volume ratio or indexed mass. A p value <0.05 was considered significant in the multivariate models. To determine intra- and interreader variability, the studies were blindly read by the same investigator as well as by a separate investigator. A random sample of 50 studies was chosen to calculate intra- and interreader variability. Intra- and interreader variability was quantified using mean differences as well as intraclass correlation coefficients. Statistical analysis was performed using PASW version 18.0 (SPSS, Inc., Chicago, Illinois).
Results
Baseline characteristics of the black and white football players are listed in Table 1 . In our cohort, black players had lower BSAs compared with white players (2.2 ± 0.21 vs 2.3 ± 0.20 m 2 , p <0.01). In addition, white players were also more likely to be linemen than black players (50% vs 19%, p <0.01).
| Variable | White (n = 86) | Black (n = 43) | p Value |
|---|---|---|---|
| Age (yrs) | 19.8 ± 1.6 | 19.4 ± 1.4 | 0.10 |
| Height (m) | 190 ± 6 | 185 ± 5 | <0.001 |
| Weight (kg) | 107.2 ± 18.0 | 96.4 ± 19.1 | 0.002 |
| Body mass index (kg/m 2 ) | 29.7 ± 4.8 | 28.2 ± 4.9 | 0.10 |
| BSA (m 2 ) | 2.3 ± 0.20 | 2.2 ± 0.21 | <0.001 |
| Systolic blood pressure (mm Hg) | 127 ± 14 | 125 ± 11 | 0.51 |
| Heart rate (beats/min) | 70 ± 11 | 68 ± 10 | 0.29 |
| Position (lineman/other) | 50% | 19% | 0.001 |
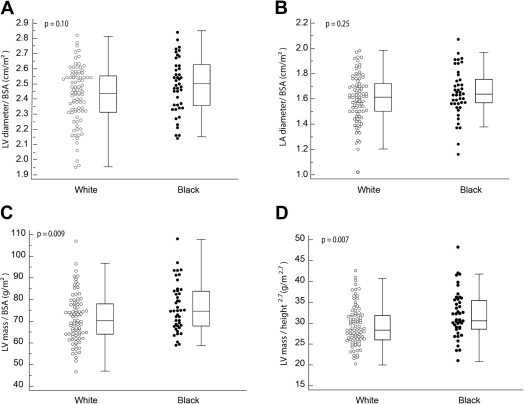
Table 2 and Figures 2 and 3 summarize the parameters of ventricular remodeling between black and white players. No patients in our cohort met the criteria for LV hypertrophy when scaled to BSA or height 2.7 . Compared with white players, black players had higher LV mass when indexed to BSA or height 2.7 , as well as higher relative wall thicknesses and mass/volume ratios. Black race was the only variable independently associated with a mass/volume ratio of 1.2 on the basis of values from Caselli et al’s study (the upper limit of control values in their study), with an odds ratio of 14 (95% confidence interval [CI] 5 to 42, p <0.001). Black race and age were the 2 variables independently associated with higher indexed ventricular mass (>75th percentile, i.e., >80 g/m 2 ), with odds ratios of 4.9 (95% CI 1.8 to 13.6, p <0.001) and 1.45 per additional year (95% CI 1.1 to 1.9, p <0.01), respectively. The variables entered in the multivariate models were age, race, position played, and systolic blood pressure.
| Variable | White (n = 86) | Black (n = 43) | p Value |
|---|---|---|---|
| Left-sided cardiac linear measures | |||
| Interventricular septal thickness (cm) | 0.77 ± 0.08 | 0.83 ± 0.09 | <0.001 |
| Posterior wall thickness (cm) | 0.80 ± 0.07 | 0.86 ± 0.11 | 0.003 |
| LVID (cm) | 5.7 ± 0.4 | 5.4 ± 0.4 | 0.002 |
| LVID indexed to BSA (cm/m 2 ) | 2.4 ± 0.2 | 2.5 ± 0.2 | 0.10 |
| Left atrial diameter (cm) | 3.7 ± 0.5 | 3.6 ± 0.5 | 0.09 |
| Left atrial diameter indexed to BSA (cm/m 2 ) | 1.6 ± 0.2 | 1.6 ± 0.2 | 0.25 |
| LV volume | |||
| End-diastolic volume indexed to height (ml/m) | 84 ± 12 | 78 ± 13 | 0.02 |
| End-diastolic volume indexed to BSA (ml/m 2 ) | 68 ± 9 | 66 ± 9 | 0.19 |
| LV mass | |||
| LV mass indexed to BSA (g/m 2 ) | 71 ± 11 | 77 ± 11 | 0.009 |
| LV mass indexed to height (g/m) | 88 ± 15 | 91 ± 17 | 0.24 |
| LV mass indexed to height 2.7 (g/m 2.7 ) | 29.5 ± 4.8 | 32.1 ± 5.6 | 0.007 |
| Remodeling indexes | |||
| Relative wall thickness | 0.24 ± 0.20 | 0.31 ± 0.04 | <0.001 |
| Mass/volume ratio | 1.06 ± 0.09 | 1.18 ± 0.16 | <0.001 |
| Systolic phase indexes | |||
| LVEF (%) | 62 ± 4 | 62 ± 4 | 0.75 |
| Velocity of circumferential shortening (circumference per second) | 1.1 ± 0.15 | 1.2 ± 0.13 | 0.32 |
| Isovolumic acceleration (m/s 2 ) | 2.5 ± 0.4 | 2.5 ± 0.3 | 0.85 |
| Ventriculoarterial coupling | 1.7 ± 0.3 | 1.7 ± 0.3 | 0.50 |
| Tissue Doppler indexes | |||
| Diastolic e′ velocity (cm/s) | 19 ± 2 | 18 ± 2 | 0.043 |
| Isovolumic relaxation time (ms) | 61 ± 6 | 68 ± 6 | <0.001 |
| LV myocardial performance index | 0.38 ± 0.04 | 0.41 ± 0.05 | 0.001 |