The characteristics of coronary artery calcium responsible for vulnerable plaque remain incompletely elucidated. We used optical coherence tomography to investigate the characteristics of coronary calcium in acute myocardial infarction (AMI), unstable angina pectoris (UAP), and stable angina pectoris (SAP). We evaluated calcium deposits in the culprit lesions (30-mm segment) using optical coherence tomography in 187 patients with AMI (n = 44), UAP (n = 73), or SAP (n = 70). The arc, area, and length of calcium were significantly smaller in those with AMI and UAP than in those with SAP (p <0.001). The number of spotty calcium deposits (with an arc of <90°) per patient was significantly larger in the AMI and UAP groups than in the SAP group (p <0.001). The number of large calcium deposits (with an arc of >90°) per patient was significantly lower in the AMI and UAP groups than in the SAP group (p <0.001). The minimum distance between the inner edge of the calcium and the luminal surface was significantly shorter in the AMI and UAP groups than in the SAP group (p <0.001). Plaque rupture frequency correlated positively with the number of spotty calcium deposits (r = 0.479, p <0.001) and inversely with the number of large calcium deposits (r = −0.219, p = 0.003). In conclusion, calcium was very spotty and more superficial in the culprit lesions of AMI and UAP. These characteristics of calcium might play an important role in the pathogenesis of plaque vulnerability.
Calcium deposits are an important process of coronary atherosclerosis, although the biologic role for plaque calcification remains unknown. In the past, arterial calcium deposits have been considered part of the passive process involved in the degeneration of vascular cells. However, recent basic studies have revealed that calcium deposits are part of the active process in atherosclerotic progression. Furthermore, clinical studies have shown that coronary artery calcium is an independent marker of cardiovascular risk. Multislice computed tomography and intravascular ultrasound have been used for the identification of coronary calcium deposits and revealed their characteristics in coronary artery disease (CAD). In addition, small calcium deposits in fibrous caps have been shown to contribute to plaque instability. Based on mechanical stress considerations, the calcified plaque interface area was thought to play an important role in plaque stability. However, multislice computed tomography and intravascular ultrasound have limitations for determining the precise location and size of calcium deposits and the tissue characterization over the calcified plaque because of their resolutions. Intravascular optical coherence tomography (OCT) has been used as a high-resolution imaging modality for plaque characterization. The aim of the present study was to analyze the characteristics of calcium deposits using OCT at the sites of culprit lesions in patients with acute myocardial infarction (AMI), unstable angina pectoris (UAP), and stable angina pectoris (SAP).
Methods
A total of 189 consecutive patients with CAD were enrolled in the present study. The patients were divided into 3 groups according to the disease type: AMI (n = 46), UAP (n = 73), and SAP (n = 70). The diagnosis of AMI was based on a history of ischemic chest pain, characteristic electrocardiographic changes, and elevated levels of creatine kinase. UAP was defined as angina of new onset, angina with a crescendo pattern (more severe, prolonged, or frequent chest pain), or angina at rest. SAP was defined as exertional angina pectoris with nonprogressive ischemic chest pain. The criteria for exclusion from OCT were the presence of congestive heart failure, a history of myocardial infarction, and cardiogenic shock.
The Ethics Committee of Wakayama Medical University approved the study protocol, and all patients provided informed consent before participation. The study was conducted in compliance with the Declaration of Helsinki.
Oral aspirin (162 mg) and intravenous heparin (100 U/kg) were administered before coronary catheterization. The patients did not receive any thrombolytic therapy before angioplasty. Coronary catheterization was performed according to the conventional femoral approach using 6F sheaths and catheters. The culprit lesion was identified from the coronary angiographic, electrocardiographic, and transthoracic echocardiographic findings. After diagnostic coronary angiography, aspiration thrombectomy was performed using an aspiration catheter (Export, Medtronic Japan, Tokyo) if the coronary flow was Thrombolysis In Myocardial Infarction grade 0, I, or II. Next, optical coherence tomographic examination of the culprit coronary artery was performed before percutaneous coronary intervention in the same manner as described previously. A 0.016-in. optical coherence tomographic imaging catheter (ImageWire, LightLab Imaging, Westford, Massachusetts) was advanced to the distal end of the culprit lesion through a 3F occlusion balloon catheter (Helios, LightLab Imaging). To remove blood cells from the field of view during image acquisition, the occlusion balloon was inflated to 0.5 atm proximal to the culprit lesion, and lactated Ringer’s solution was infused into the coronary artery from the distal tip of the occlusion balloon catheter at a rate of 0.5 ml/s. For proximal lesions, a continuous flushing (nonocclusive) technique was used instead of the balloon occlusion technique, as described previously. In this continuous flushing technique, a mixture of commercially available dextran 40 and lactated Ringer’s solution (low-molecular-weight Dextran L Injection, Otsuka Pharmaceutical Factory, Tokushima, Japan) was infused from the guiding catheter at 2.5 to 4.5 ml/s using an injector pump (Mark V, Medrad, Warrendale, Pennsylvania) to remove the blood during image acquisition. The culprit coronary artery lesions were imaged with an automatic pullback device at a rate of 1 mm/s.
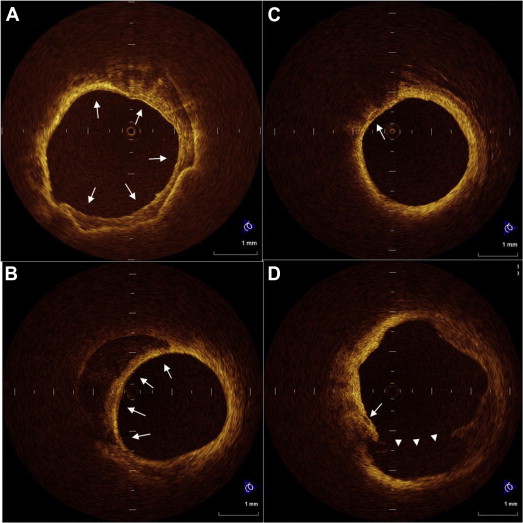
All optical coherence tomographic images were recorded digitally and analyzed by 2 independent investigators (M.M. and H.K.) who were blinded to the clinical presentations. In cases of discordance between the observers, a consensus reading was obtained. A 30-mm segment of the culprit lesion (15 mm proximal and 15 mm distal to the culprit lesion site) was used for assessment of plaque morphology. The optical coherence tomographic images were analyzed using previously validated criteria for plaque characterization, and the fibrous cap thickness was determined as described previously. Plaque rupture was identified by the presence of fibrous cap discontinuity and cavity formation in the plaque. Lipid plaque was semiquantified according to the number of involved quadrants on the cross-sectional image. When lipid was present in ≥2 quadrants in any of the images within a plaque, the plaque was considered to be lipid-rich. A thin-cap fibroatheromas was defined as a plaque with lipid content in ≥2 quadrants and a thin fibrous cap of <70 μm. We analyzed calcium deposits for the number, maximum arc, and longitudinal length, and the minimal distance between the inner edge of calcium and the luminal surface. Each calcium deposit was categorized into 1 of 2 groups according to the arc: (1) spotty calcium: small calcium deposit within an arc of ≤90° in >1 cross-sectional image of the culprit lesion, and (2) large calcium: calcium deposit with an arc of >90°. Representative OCT images of calcium deposits are shown in Figure 1 .
PASW Statistics, version 17.0 (SPSS, Chicago, Illinois) software was used for statistical analysis. Categorical variables were compared using Fisher’s exact test. Continuous variables were compared using the Kruskal-Wallis test and are expressed as the median and interquartile range (quartile 1 to quartile 3). If significant, pair wise comparisons using the Bonferroni test were performed for multiple analyses. Categorical data are summarized as frequencies and percentages. The relation between the frequency of plaque rupture and the number of calcifications was analyzed using Spearman’s rank order correlation. A value of p <0.05 was considered significant.
Results
Of 189 patients with CAD, 1 patient with congestive heart failure and 1 with cardiogenic shock were excluded from the OCT examination. Thus, 187 patients with CAD constituted the final study population. The clinical characteristics of all 187 patients are summarized in Table 1 . No significant differences were seen in age, gender, classic coronary risk factors, or culprit vessels among the patients in the 3 groups.
| Variable | AMI (n = 44) | UAP (n = 73) | SAP (n = 70) | p Value |
|---|---|---|---|---|
| Age (yrs) | 67 (57–77) | 65 (57–75) | 70 (60–76) | 0.172 |
| Men | 31 (70) | 56 (77) | 52 (74) | 0.753 |
| Systemic hypertension | 34 (77) | 50 (68) | 51 (73) | 0.583 |
| Diabetes mellitus | 19 (43) | 23 (32) | 33 (47) | 0.145 |
| Dyslipidemia ∗ | 25 (57) | 44 (60) | 45 (64) | 0.720 |
| Smoker | 19 (43) | 38 (52) | 32 (46) | 0.623 |
| Obesity † | 22 (50) | 37 (51) | 38 (54) | 0.875 |
| Renal insufficiency ‡ | 2 (5) | 3 (4) | 2 (3) | 0.879 |
| Culprit coronary artery | 0.259 | |||
| Left anterior descending | 14 (32) | 34 (47) | 34 (48) | |
| Left circumflex | 10 (23) | 14 (19) | 16 (23) | |
| Right | 20 (45) | 25 (34) | 20 (29) |
∗ Total cholesterol level >220 mg/dl, low-density lipoprotein level >140 mg/dl, or triglycerides >150 mg/dl.
† Body mass index >25 kg/m 2 .
‡ Estimated glomerular filtration rate <60 ml/min/1.73 m 2 .
Culprit arteries were successfully observed in all patients using OCT without any serious complications. The OCT findings and the characteristics of the calcium deposits in the culprit lesions are summarized in Tables 2 to 4 . Lipid-rich plaque was more frequently observed in the AMI and UAP groups than in the SAP group (p <0.001). The average arc, area, and length of calcium were significantly smaller in the AMI and UAP groups than in the SAP group (p <0.001). The number of spotty calcium deposits per patient was significantly greater in the AMI and UAP groups than in the SAP group (p <0.001). Consequently, the ratio of spotty calcium deposits to all calcium deposits in each culprit lesion was significantly greater in the AMI and UAP groups than in the SAP group (p <0.001).
| Variable | AMI (n = 44) | UAP (n = 73) | SAP (n = 70) | p Value |
|---|---|---|---|---|
| Lipid-rich plaque | 39 (89) ∗ | 59 (81) † | 20 (29) | <0.001 |
| Thin cap fibroatheroma | 38 (86) ∗ | 56 (77) † | 13 (19) | <0.001 |
| Rupture | 39 (89) ∗,‡ | 48 (66) † | 3 (4) | <0.001 |
| Thrombus | 39 (89) ∗ | 50 (69) † | 2 (3) | <0.001 |
| Minimum lumen area (mm 2 ) | 1.1 (0.6–1.8) | 0.8 (1.0–2.3) | 1.4 (0.5–1.5) | 0.214 |
| Lumen area stenosis (%) | 88 (81–93) | 89 (81–93) | 81 (72–92) | 0.134 |
| Variable | AMI (n = 44) | UAP (n = 73) | SAP (n = 70) | p Value |
|---|---|---|---|---|
| Arc (°) | 49.5 (28.5–80.0) ∗ | 48.0 (30.0–80.0) † | 100.0 (60.0–135.0) | <0.001 |
| Area (mm 2 ) | 0.38 (0.13–0.83) ∗ | 0.38 (0.17–0.82) † | 0.89 (0.49–1.78) | <0.001 |
| Length (mm) | 1.6 (1.1–2.8) ∗ | 1.9 (1.1–2.6) † | 2.8 (1.8–4.0) | <0.001 |
| Location (μm) | 65.0 (30.0–110.0) ∗ | 60.0 (30.0–120.0) † | 150.0 (80.0–245.0) | <0.001 |
| Variable | AMI (n = 44) | UAP (n = 73) | SAP (n = 70) | p Value |
|---|---|---|---|---|
| Calcium deposits per patient (n) | ||||
| Spotty | 2.0 (1.0–3.0) ∗ | 2.0 (1.0–3.0) † | 1.0 (0.0–2.0) | <0.001 |
| Large | 0 (0–1.0) ∗ | 0 (0–1.0) † | 1.0 (1.0–3.0) | <0.001 |
| Distance between inner edge of calcium and luminal surface (μm) | ||||
| Spotty | 60 (42–90) ∗ | 70 (41–105) † | 193 (120–260) | <0.001 |
| Large | 70 (35–140) | 140 (65–188) | 160 (86–238) | 0.601 |
Stay updated, free articles. Join our Telegram channel

Full access? Get Clinical Tree


