Fig. 35.2 ECG of right ventricular hypertrophy (RVH). Unremarkable P waves. Normal PR interval. Borderline right axis deviation, QRS axis ≥ 90° (iso-electric R wave aVL, where R = S wave, and positive QRS leads III, aVF). Narrow complex QRS, generally normal aside from leads V1/2. In V1 there is a large Q wave, then a large R wave, which is termed dominant as the R wave ≥ Q/S wave. The T wave is inverted. Lead V2 shows similar abnormalities. There is a differential diagnosis of a dominant R wave in lead V1, which includes right bundle branch block (QRS too narrow here), Wolff–Parkinson–White syndrome (normal PR interval, QRS normal duration here), old posterior infarction (no inferior wall myocardial infarction here), skeletal dystrophy (which usually shows rather diffuse ST changes, not present here) and pulmonary hypertension (primary or secondary). This patient had congenital cyanotic heart disease.
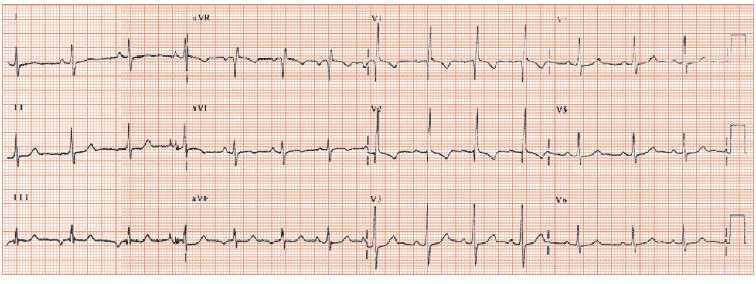
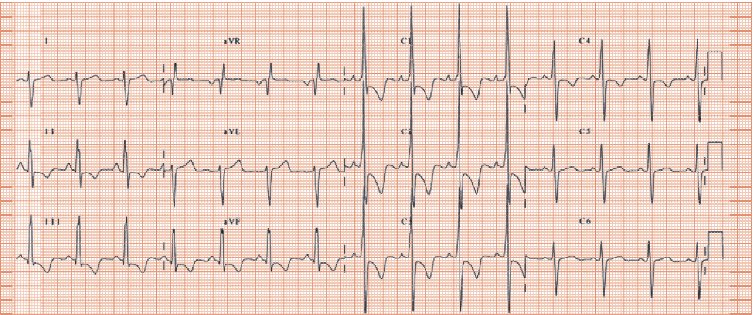
Fig. 35.3 ECG of human immunodeficiency virus (HIV)-related pulmonary hypertension. P wave tall and peaked in lead II, V1 indicating right atrial enlargement. QRS axis swung to the right (123° by computer; negative in lead I, positive in leads II and III) and very dominant R wave in V1 (i.e. R wave much greater than S wave), both indicating right ventricular hypertrophy. Inverted T waves in leads V1–4 occur due to ‘strain’. The ECG findings shown here are classical for severe pulmonary hypertension, though are rarely found: as a generalization, the younger the patient, the more likely are classic ECG findings, and vice versa, be it for pulmonary hypertension or any disease process. So, patients with congenital heart disease and pulmonary hypertension almost always show right axis deviation, and a dominant R wave in lead V1, whereas those with acquired pulmonary hypertension presenting in middle age or older rarely do. The ECG does not establish the cause of pulmonary hypertension.
Pulmonary hypertension occurs when the pulmonary artery pressure rises above its normal value, of 30 mmHg systolic (Table 35.1). The causes are:
- Any left-sided cardiac disease sufficiently severe to cause heart failure, e.g. aortic/mitral valve disease, left ventricular dysfunction, hypertensive heart disease, etc. The ECG shows, in addition to any changes relating to pulmonary hypertension, left ventricular hypertrophy (LVH) (aortic valve/hypertensive heart disease), Q waves (ischaemic heart disease [IHD]), diffuse ST/T wave changes and loss of R wave height, or left bundle branch block (dilated cardiomyopathy).
- Lung diseases that destroys the pulmonary arterial circulation, e.g. chronic obstructive pulmonary disease (COPD), fibrotic lung disease (e.g. cryptogenic fibrosing alveolitis) or that result in hypoxic vasoconstriction (obesity related sleep apnoea syndromes).
- Thromboembolic lung disease
Stay updated, free articles. Join our Telegram channel

Full access? Get Clinical Tree


