4 Pulmonary Function Testing
Note 1: This book is written to cover every item listed as testable on the Entry Level Examination (ELE), Written Registry Examination (WRE), and Clinical Simulation Examination (CSE).
The listed code for each item is taken from the National Board for Respiratory Care’s (NBRC) Summary Content Outline for CRT and Written RRT Examinations (http://evolve.elsevier.com/Sills/resptherapist/). For example, if an item is testable on both the ELE and WRE, it is shown simply as (Code: …). If an item is testable only on the ELE, it is shown as (ELE code: …). If an item is testable only on the WRE, it is shown as (WRE code: …).
MODULE A
3. Pulmonary mechanics (e.g., maximum inspiratory pressure, vital capacity) (Code: IA7b) [Difficulty: ELE: R; WRE: Ap]
MODULE B
1. Perform bedside spirometry tests
a. Recommend lung mechanics (bedside spirometry) tests to obtain additional data (Code: IC7) [Difficulty: ELE: R, Ap; WRE: An]
The bedside lung mechanics tests typically include the following:
2. Tidal volume
a. Perform the procedure (Code: IB9d) [Difficulty: ELE: R; WRE: Ap, An]
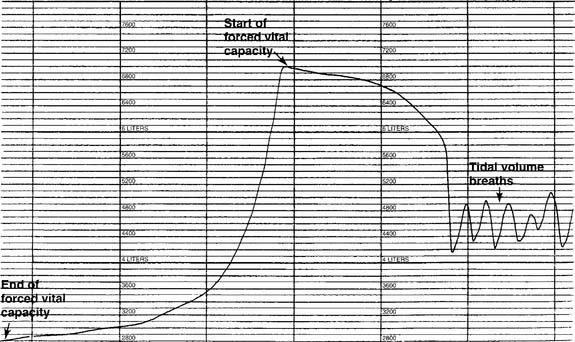
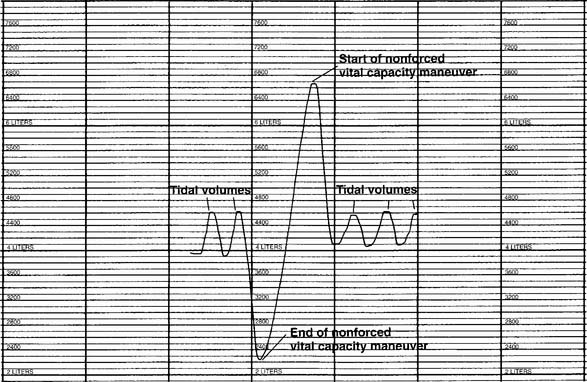
The tidal volume (VT) is the volume of gas breathed out in each respiratory cycle. Realize that individual tidal volumes are rarely identical. Figure 4-1 shows several different tidal volumes before and after a nonforced (slow) vital capacity (VC). For that reason, it is recommended that the tidal volumes be accumulated for 1 minute (thus providing a minute volume [ ]) and the respiratory rate (f) counted. An average VT is found by dividing the
  by the f. If this cannot be done, find the average volume of at least six breaths. The average predicted tidal volume for a resting, afebrile, alert adult should be about
For example, the predicted tidal volume range of a 154-lb (70-kg) patient is calculated as follows:
3. Minute volume
b. Interpret the results (Code: IB10d) [Difficulty: ELE: R, Ap; WRE: An]
The predicted range for a minute volume in a resting, afebrile, alert adult should be 5 to 10 L/min. The wide range is found in part because the minute volume is a product of two factors: tidal volume and respiratory rate. It is possible for either one or both of these factors to be normal, abnormally high, or abnormally low. For these reasons, the minute volume must be evaluated along with the tidal volume and respiratory rate to reach any conclusion about the patient’s condition. The same factors that have an impact on the tidal volume affect the patient’s minute ventilation.
4. Alveolar ventilation
5. Maximum inspiratory pressure
a. Perform the procedure (Code: IB79n [Difficulty: ELE: R, Ap; WRE: An]
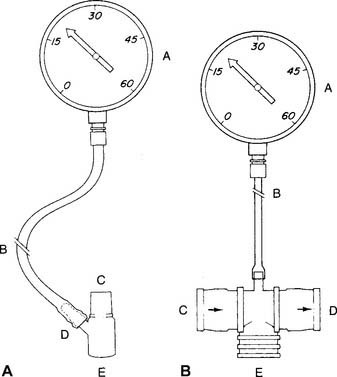
A study of the literature reveals that a number of measurement devices have been assembled and that different bedside techniques have been used to determine the effort of a patient breathing naturally, an intubated patient, and a patient breathing with assistance from a mechanical ventilator. Branson and colleagues (1989) and Kacmarek and colleagues (1989) make a strong case for the use of a double one-way valve to connect the intubated patient to the manometer (Figure 4-2). Use of the one-way valve lets the patient exhale but prevents an inhalation when the practitioner occludes the opening. This forces the patient to inhale from closer to residual volume with each breathing effort. These researchers also recommend that the patient make inspiratory efforts for 15 to 20 seconds.
Steps in the MIP procedure for a normally breathing patient include the following:
b. Interpret the results (Code: IB10n) [Difficulty: ELE: R, Ap; WRE: An]
Black and Hyatt (1969) published MIP prediction formulas for spontaneous breathing in nonintubated adults 20 to 86 years old who are breathing from residual volume; these formulas are presented in Table 4-1. The values are in centimeters of water pressure (cm H2O). As can be seen, the older the patient, the lower the predicted negative inspiratory force.
TABLE 4-1 Age and Gender in Predicting Negative Inspiratory Force
| Age and Gender | Lower Limits of Normal |
|---|---|
| Males: 143 – (0.55 × age) | − 75 cm H2O |
| Females: 104 – (0.51 × age) | − 50 cm H2O |
6. Maximum expiratory pressure
a. Perform the procedure (Code: IB9n) [Difficulty: ELE: R, Ap; WRE: An]
As with the MIP test, a study of the literature reveals that a number of measurement devices have been assembled and that different bedside techniques have been used to determine the effort of a patient breathing naturally and the effort of one who is intubated and breathing by way of a mechanical ventilator. A strong case can be made for the use of a double one-way valve to connect the intubated patient to the manometer (see Figure 4-2). Use of the one-way valves lets the patient inhale but prevents an exhalation when the practitioner occludes the expiratory opening. This forces the patient to exhale from closer to TLC with each breathing effort. However, the expiratory efforts should not be held for longer than 3 seconds. This test is similar to the Valsalva maneuver and can cause a reduction in cardiac output because of the high intrathoracic pressure.
Steps in the MEP procedure for a normally breathing patient include the following:
b. Interpret the results (Code: IB10d) [Difficulty: ELE: R, Ap; WRE: An]
Black and Hyatt published MEP prediction formulas for spontaneously breathing, nonintubated adults 20 to 86 years old who are breathing from TLC; these formulas are presented in Table 4-2. The values are in centimeters of water pressure. As can be seen, the older the patient, the lower the predicted maximum expiratory force.
TABLE 4-2 Age and Gender in Predicting Maximum Expiratory Force
| Age and Gender | Lower Limits of Normal |
|---|---|
| Males: 268 – (1.03 × age) | +140 cm H2O |
| Females: 170 – (0.53 × age) | +95 cm H2O |
7. Vital capacity
a. Perform the test (Code: IB9d) [Difficulty: ELE: R; WRE: Ap, An]
The nonforced (slow) vital capacity (VC or SVC) is the greatest volume of gas the patient can exhale after the lungs have been completely filled. The therapist should demonstrate the procedure to the patient. He or she must understand that there is no need to blow out fast while emptying the lungs. The measurement device can be a simple handheld spirometer if a printout of the result is not needed. A portable, computer-based spirometer can be used, if needed, to generate a printout of the results or a graphic tracing. Normally at least three efforts are made, and the largest is recorded.
b. Interpret the results (Code: IB10d) [Difficulty: ELE: R, Ap; WRE: An]
See Figure 4-1 for a graphic tracing of a nonforced VC. Compare it with the tracing on Figure 4-3, which shows a forced vital capacity (FVC). In a patient without obstructive lung disease, the same volume should be found in a nonforced VC and an FVC. A patient with asthma or chronic obstructive lung disease may have a smaller FVC than nonforced VC because of small airway collapse during the maximum effort. The following discussion on the FVC includes predicted values for male and female patients and guidelines on the interpretation.
c. Monitor the vital capacity (Code: IA7b) [Difficulty: ELE: R; WRE: Ap]
The VC and other simple spirometry values are commonly measured at the bedside in patients with neuromuscular disease and those who are being weaned from mechanical ventilation. A VC that is increasing toward the normal, predicted patient value is a good sign, because it indicates that the patient is recovering. If the VC is decreasing, the patient likely is becoming weaker and will not be able to cough out secretions effectively. Mechanical ventilation may be needed. See Module C for more discussion on the vital capacity. See Chapter 15 for more discussion on how the VC is used to evaluate a patient’s need for mechanical ventilation.
A bedside vital capacity test is widely used to help in the assessment of a mechanically ventilated patient’s ability to breathe effectively. This issue and weaning guidelines are discussed in Chapter 15. In general, a decreasing VC is a sign that the patient is tired and failing. (Racial adjustment and BTPS correction are not typically done when the VC is used for bedside spirometry.)
8. Forced expiratory volume in one second
MODULE C
2. Exhaled nitric oxide
3. Forced vital capacity
a. Perform the test (Code: IB9e and IIIE7a) [Difficulty: ELE: R, Ap; WRE: An]
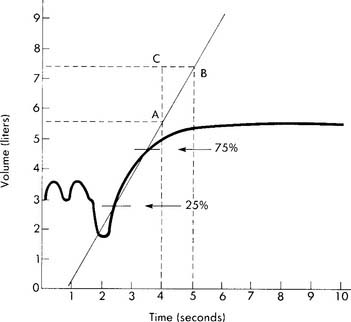
If the measurement instrument does not give a printout, simply record the patient’s efforts in the chart. If the measurement instrument does give a printout, include copies of the efforts. See Figure 4-3 for the tracing of a properly performed FVC. The tracing allows comparison of the volumes exhaled in a series of 1-second intervals. Because of this, the tracing often is referred to as a volume-time curve. Note that the start of the effort is smooth and without interruption. The initial fast flow of gas from the upper airway is seen as the nearly vertical part of the tracing. The rest of the tracing is smooth without any coughing or other interruptions in the patient’s effort. The tracing becomes progressively more horizontal as the end of the effort is reached. Encourage the patient to try to push out as much air as possible as the end approaches. To provide an acceptable FVC, the patient must show maximum effort without coughing or closing the glottis, and the expiratory effort must last at least 6 seconds. The patient’s final 2 seconds of expiratory effort should show no appreciable airflow. Each of the three acceptable FVCs must show these traits and close similarity of the patient’s efforts.
b. Interpret FVC and spirometry graphics
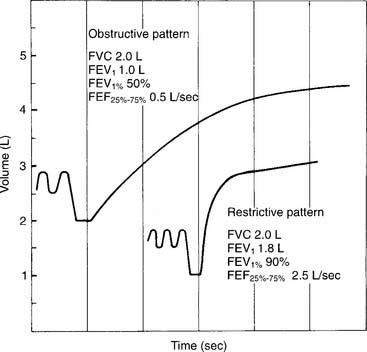
Figure 4-3 was made on a chain-compensated, water-seal spirometry system. Note how the tracing progresses from the right to the left. The Stead-Wells system shows the same tracing “upside down” compared with the chain-compensated system. The tracing starts on the left and moves to the right (Figures 4-4 and 4-5). Other tracings may show either the chain-compensated or the Stead-Wells tracings in a mirror image or opposite shape.
c. Interpret the results (Code: IB10e and IIIE7a) [Difficulty: ELE: R, Ap; WRE: An]
Normal racial differences in the FVC must be taken into consideration. Most modern pulmonary function systems automatically adjust the measured values for racial differences when so programmed by the operator. If not, the predicted values should be mathematically adjusted by the therapist. The predicted normal values, in liters, for the FVC in Caucasian patients were reported by Morris, Koski, and Johnson (1971) as:*
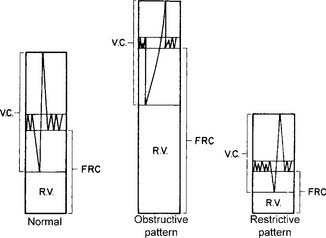
Restrictive problems, such as advanced pregnancy, obesity, ascites, neuromuscular disease, sarcoidosis, and chest wall or spinal deformity, can result in a small FVC. Patients with chronic obstructive lung diseases, such as emphysema, bronchitis, asthma, cystic fibrosis, and bronchiectasis, commonly have a small FVC. (Figure 4-5 shows a comparison of the spirometry tracings of a normal, an obstructed, and a restricted patient.)
4. Peak flow
a. Perform the procedure (Code: IB9d) [Difficulty: ELE: R; WRE: Ap, An]
For bedside spirometry or home care, the patient’s effort is easily measured directly with a handheld peak flowmeter. Usually at least three efforts are required to find two that are acceptably close. PF values that are consistent and low despite variable patient efforts probably indicate a malfunctioning unit that should not be used. It is reasonable to record the patient’s effort in liters per second, because the effort takes place in about that much time. However, do not be confused by some measurement instruments and other prediction equations giving the value in liters per minute. Simply multiply or divide by 60 to convert your patient’s effort from one time frame to the other. For example, a young man’s PF might be recorded as 10 L/sec or 600 L/min. Cherniack and Raber (1972) published the following formulas for predicting PF in liters per second*:
Timed forced expiratory volume tests
All of the timed forced expiratory volume tests are derived from a properly performed FVC test (see Figure 4-3). When the FVC is done correctly, the following values can be properly calculated and evaluated to determine the patient’s condition. As discussed earlier, an FVC within 80% of predicted is interpreted as within normal limits. Therefore, if the results of the following tests show patient values within 80% of predicted, the results are interpreted as being within normal limits.
5. Forced expiratory flow25%-75% (FEF25%-75%)
a. Perform the procedure (Code: IB9u) [Difficulty: ELE: R, Ap; WRE: An]
The FEF25%-75% is the mean forced expiratory flow during the middle half of an acceptable FVC (Figure 4-6). The FVC effort to use for this test is the one that has the greatest combination of FVC volume and FEV1. As mentioned earlier, the patient must give his or her best effort. The measurement usually is recorded in liters per second but may be recorded in liters per minute.
b. Interpret the results (Code: IB10u) [Difficulty: ELE: R, Ap; WRE: An]
The results are normally less than in the PF test, because the flow being measured comes from medium-size and small airways (smaller than 2 mm in diameter). The results should decline with age and should be lower in women than in men. A patient with a restrictive lung disease may have a normal or increased value, whereas a low value is seen in a patient with obstructive lung disease. A small FEF25%-75% value when the FVC and FEV1 values are normal often is taken to indicate early small airway disease. A normal, 68-kg (150-lb) young man should have values of 4 to 5 L/sec or 240 to 300 L/min. The following formulas were developed by Morris, Koski, and Johnson (1971) and can be used to calculate the predicted values in liters per second:
6. Forced expiratory volume timed (FEVT)
a. Perform the procedure (Code: IB9u) [Difficulty: ELE: R, Ap; WRE: An]
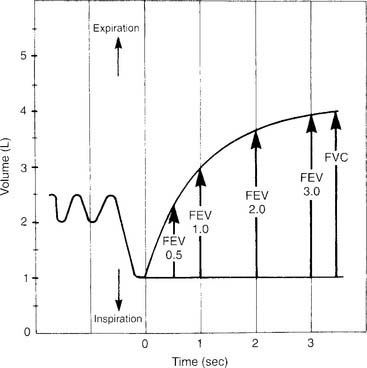
The timed forced expiratory volumes (FEV0.5, FEV1, FEV2, FEV3) effectively “cut” the FVC into sections based on how much volume the patient forcibly exhales in 0.5, 1, 2, and 3 seconds. Some patients with severe obstructive lung disease require several more seconds to exhale completely. In these cases, simply keep measuring the volume exhaled in each additional second. Figure 4-7 shows an FVC tracing that is subdivided at 0.5-, 1-, 2-, and 3-second intervals. Some bedside units give a numeric value for some or all of the timed intervals; however, it is best to have a spirometer that produces a printed copy of the patient’s FVC effort. The individual volumes can be determined by marking the vertical distance on the volume scale from the baseline (total lung capacity) to the respective arrow tips.
b. Interpret the results (Code: IB10u) [Difficulty: ELE: R, Ap; WRE: An]
The FEVT values often are reduced in both restrictive and obstructive lung diseases. Patients with a severe restrictive lung disease exhale almost all of their small FVC within the first second. Patients with severe obstructive lung disease show low values at all time intervals, with the volumes at FEV2, FEV3, and so on, becoming progressively smaller. The most commonly evaluated values are the FEV1 and the FEV1%. The following formulas* were developed by Morris, Koski, and Johnson (1971) and can be used to calculate the predicted values for FEV1 in liters:
7. Forced expiratory volume/forced vital capacity ratio (FEVT/FVC or FEVT%)
a. Perform the procedure (Code: IB9u) [Difficulty: ELE: R, Ap; WRE: An]
The FEVT to FVC ratio compares, by division, the volume exhaled at 0.5, 1, 2, and 3 (or more) seconds (see Figure 4-7) with the FVC. This results in a series of decimal fractions. These are multiplied by 100 to convert the answers to percentages.
| FEV0.5 | 50% to 60% of the FVC |
| FEV1 | 75% to 85% of the FVC |
| FEV2 | 94% of the FVC |
| FEV3 | 97% of the FVC |
b. Interpret the results (Code: IB10u) [Difficulty: ELE: R, Ap; WRE: An]
Patients with restrictive lung diseases often exhale the FVC more quickly than expected. This happens because these patients have a smaller than normal FVC and stiff lungs, which recoil more quickly than expected to their resting volume. See Figure 4-4 to compare the FVC curves of a patient with restrictive lung disease with the FVC curves of a patient with obstructive lung disease.


 ) is the volume of gas exhaled in 1 minute. It usually is a more stable value than are individual tidal volumes. The minute volume is found by adding the accumulated tidal volumes for 1 minute. A simple handheld spirometer often is used to accumulate the tidal volume breaths. If the patient cannot perform the test for 1 minute, do it for 30 seconds and double the value.
 ) is the volume of gas that reaches the alveoli in 1 minute. It is found by multiplying the alveolar volume by the respiratory rate in 1 minute.


