Pulmonary Circulation
INTRODUCTION: HISTORY AND EVOLUTION
The discovery of the pulmonary circulation was reported in the 13th century by Ibn al-Nafis (1213–1288) in the “Commentary on Anatomy in Avicenna’s Canon” and, probably independently, in the 16th century by Michael Servetus (1511–1553) in the “The Restoration of Christianity.”1 However, it has only been recently realized that the pulmonary circulation as a separate high-flow low-pressure system is the end result of an evolutionary process aimed at the optimization of gas exchange of endothermic birds and mammals.2 Evolution from ancestors of fishes to amphibians, reptiles, and finally birds and mammals has led to progressively greater oxygen consumption requiring thinner pulmonary blood–gas barrier. The alveolocapillary membrane in mammals is a vulnerable structure only 0.3 μm thick. Preservation of the integrity of this barrier has been made possible by the complete separation of the pulmonary circulation from the systemic circulation. This evolution has been accompanied by a progressive unloading and reshaping of the right ventricle (RV) as a thin-walled flow generator.
The extreme potential physiological stresses on the pulmonary circulation are exercise and hypoxia. Exercise increases oxygen uptake and carbon dioxide output up to some 20-fold above resting values, and increases cardiac output up to some sixfold. Strenuous exercise may eventually alter gas exchange because of excessive capillary filtration and stress failure, or expose the RV to excessive loading resulting in a limitation of maximum cardiac output. Hypoxia adds the burden of further increase in pulmonary vascular pressures due to hypoxic pulmonary vasoconstriction.
PULMONARY VASCULAR PRESSURES AND RESISTANCE
 LIMITS OF NORMAL
The pulmonary circulation is characterized by an inflow pressure or pulmonary artery pressure (Ppa), an outflow pressure or left atrial pressure (Pla), and a pulmonary blood flow (Q) approximately equal to systemic cardiac output. Pulmonary vascular pressures and flows are pulsatile. However, a simple and clinically useful description of the functional state of the pulmonary circulation may be provided by a calculation of pulmonary vascular resistance (PVR) from mean values of Ppa (mPpa), Pla, and Q.
![]()
Measurements of pulmonary vascular pressures and cardiac output are usually performed during a catheterization of the right heart with a fluid-filled balloon-tipped thermodilution catheter (Fig. 13-1). This procedure allows for the estimation of Pla from a balloon-occluded (Ppao) or wedged (Ppw) Ppa and Q by thermodilution.
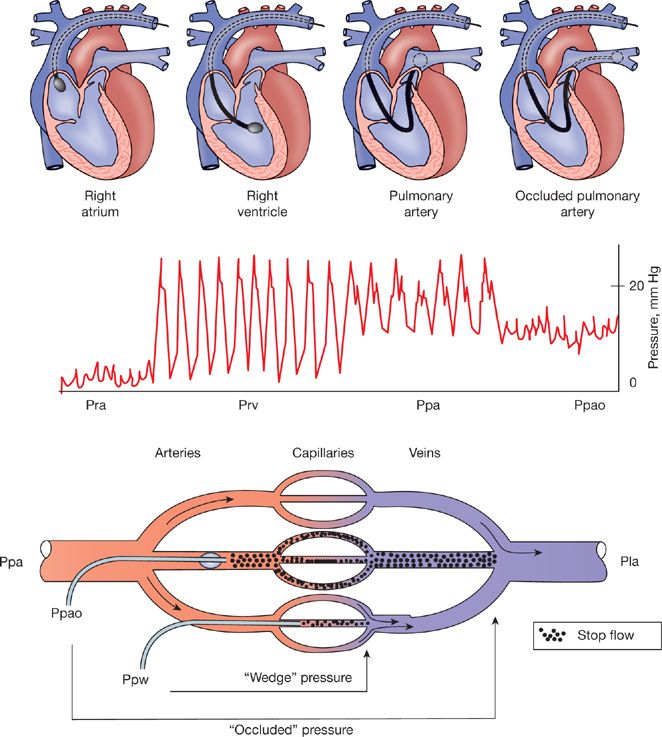
Figure 13-1 Right heart catheterization with flow-directed balloon-tipped catheter with successive measurements of right atrial pressure (Pra), right ventricular pressure (Prv), pulmonary artery pressure (Ppa), and occluded Ppa (Ppao). Because of the fractal structure of the arterial and venous branching of the pulmonary vascular tree, occluded or wedged Ppa prolongs the fluid column of the catheter until same diameter pulmonary vein, which is a satisfactory estimate of left atrial pressure or left ventricular end-diastolic pressure.
 METHODOLOGICAL ASPECTS
The frequency response of fluid-filled catheters is considered to be sufficient for meaningful measurements of systolic and diastolic Ppa (sPpa and dPpa), and derived calculation of mPpa. However, errors may be caused by overdamping or underdamping of signals related to the insufficient or excessive flushing or excessive length of tubing systems.3 A comparison of pulse pressure (PP, or sPpa – dPpa) measured with fluid-filled catheters compared to gold standard high fidelity micromanometer-tipped catheters in eight dogs with pulmonary hypertension induced either by ensnarement of the pulmonary arteries or injection of microbeads is illustrated in Figure 13-2.4 Measurements of PP were highly correlated, with an analysis according to Bland and Altman5 showing almost no bias, indicating excellent accuracy. However, the limits of agreement reached ± 8 mm Hg, which may be insufficiently precise in certain clinical circumstances.
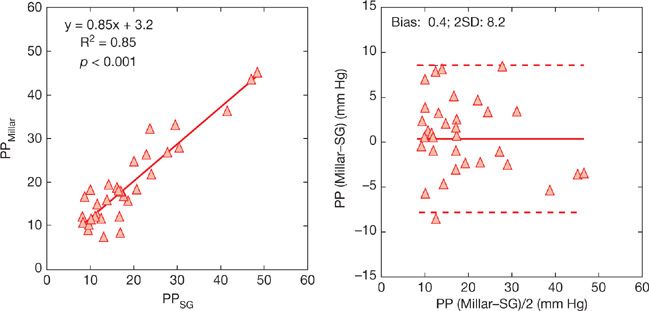
Figure 13-2 Correlation between pulmonary arterial pulse pressure (PP) measured using fluid-filled Swan–Ganz (SG) versus high-fidelity micromanometer-tipped Millar catheters and same measurements presented as Bland and Altman plots. The bias was negligible, indicating accuracy of fluid-filled catheter measurements, but the limits of agreement were of ± 8 mm Hg, indicating limited precision. (Data from Pagnamenta A, Vanderpool R, Brimioulle S, Naeije R. Proximal pulmonary arterial obstruction decreases the time constant of the pulmonary circulation and increases right ventricular afterload. J Appl Physiol. 2013;114:1586–1592.)
Estimations of Pla by Ppw are generally believed to be accurate based on earlier reports of high levels of correlations.6 This was recently revisited in a large quality-control study in almost 4000 patients with pulmonary hypertension who underwent measurements of Ppw during a right heart catheterization and Pla estimated by left ventricular (LV) end-diastolic pressure during a left heart catheterization.7 The results showed a bias of –3 mm Hg, corresponding to an expected pressure gradient from small pulmonary veins to the left ventricle at end diastole, thus indicating excellent accuracy, but limits of agreement ranged from –15 to +9 mm Hg, indicating insufficient precision for cut off number-derived individual diagnosis.
Thermodilution Q compared to gold standard direct Fick measurements has been reported to present with little bias, ±0.1 L/min, and thus excellent accuracy, even in patients with severe pulmonary hypertension and tricuspid regurgitation (TR). The limits of agreement were ±1 L/min, which is relatively large but probably often of minor clinical relevance.8
Fluid-filled catheters measure vascular pressures with a zero-leveled external manometer. The best reference is the hydrostatic indifference point, at the level of the tricuspid valve, where pressure is independent of body position.9 This is midchest or 5 cm below the Louis angle in the supine position, with midaxillary intersection at the two inferior fourths of the rib cage to consider when measurements are in the upright position. Zero leveling at the catheterization table is associated with an overestimation of Ppa and Ppw.
Measurements are generally performed at end expiration, when the lungs are at functional residual capacity (FRC). Lung volumes below or above FRC are associated with increased PVR, because of predominant increased alveolar vessel resistance at high lung volumes, and increased extra-alveolar vessel resistance at lower lung volumes.10 Thus patients with obstructed airways as a cause of increased FRC may present with an increased PVR. Furthermore, these patients have important intrathoracic pressure swings, which are predominantly positive during expiration.11 This is illustrated in Figure 13-3. Measurements at end expiration may then overestimate Ppa and Ppw.
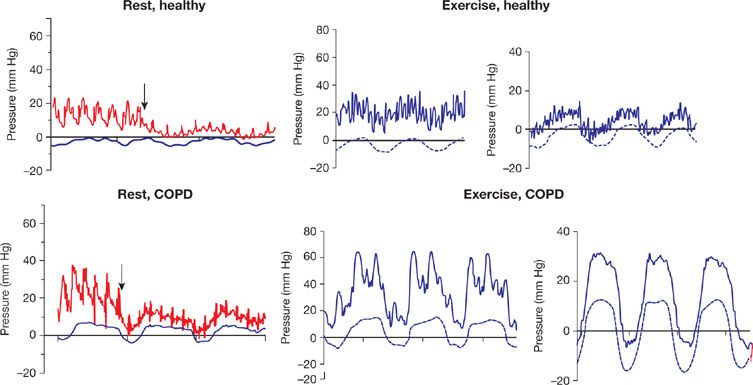
Figure 13-3 Simultaneous pressure recordings of pulmonary artery pressure (Ppa) and wedged Ppa (Ppw) with esophageal pressure (Pes) in a healthy subject and a patient with chronic obstructive pulmonary disease (COPD), at rest and at exercise. The arrows represent the moment of balloon inflation. Note the large influence of intrathoracic pressure on the Ppa and Ppw during exercise in COPD. (Reproduced with permission from Robert Naeije and Bart G. Boerrigter. Pulmonary hypertension at exercise in COPD: does it matter? Eur Respir J. 2013;41:1002–1004.)
Sometimes a measurement of Pla or Ppao cannot be obtained, and a total PVR (TPVR) is calculated as:
![]()
Since Pla is not negligible with respect to Ppa, TPVR is larger than PVR and this difference may be flow dependent. Thus TPVR is not a correct characterization of the flow-resistive properties of the pulmonary circulation when Pla is increased. On the other hand, TPVR may be a more realistic estimate of RV afterload. The RV is exposed to Ppa and not to the difference between Ppa and Pla.
PULMONARY CAPILLARY PRESSURE
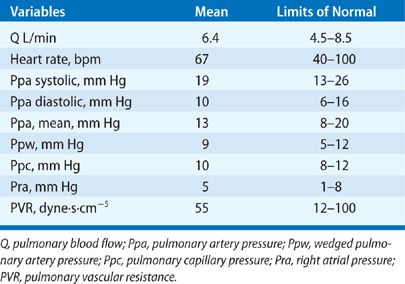
While wedged or occluded Ppa measurements (Ppw) are acceptable estimates of Pla, micropuncture studies have shown that pulmonary capillary pressure (Ppc) is higher than Ppw, about halfway between arterial and venous pressures.12 Thus wedged or occluded Ppa should not be called “capillary” or “capillary-wedge” pressure. Estimates of Ppc can be obtained from the analysis of Ppa decay curves after arterial occlusion (Fig. 13-4).13 The limits of normal of Ppc measured in healthy volunteers at rest using single arterial occlusion14 are shown in Table 13-1. Based on measured distribution of resistances in perfused normal lungs, with 60% arterial resistance and 40% capillary plus venous resistance, Ppc can be estimated from the equation:
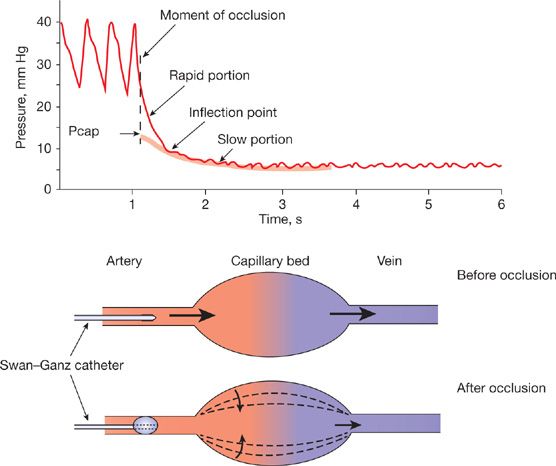
Figure 13-4 Analysis of the pressure transient after pulmonary arterial occlusion for the estimation of pulmonary capillary pressure (Pcap) either by the intersection of the fast and the slow components of the pressure decay curve, or by the extrapolation of the exponential fitting of the slow component of the pressure decay curve to the moment of occlusion.
TABLE 13-1 Limits of Normal of Pulmonary Vascular Pressures and Pulmonary Blood Flow at Rest

 THE CALCULATION OF PVR
A vascular resistance calculation derives from the physical law that governs laminar flows of newtonian fluids through nondistensible, straight cylindric tubes, originally proposed by the French physician Poiseuille and later put in mathematical equation by the German physicist Hagen. Poiseuille showed experimentally that flow was inversely related to the fourth power of the internal radius, and confirmed previous demonstrations that arterial pressure remains high in arteries down to 2 mm in diameter while venous pressure is low in animals. The Hagen–Poiseuille law states that resistance R to flow of a single tube is equal to the product of the length l of the tube and viscosity η and a constant 8 divided by the product of π and the fourth power of the internal radius r. More generally R can be calculated as a pressure drop ΔP to flow Q ratio:
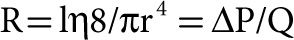
The ratio of pressure drop to flow through an entire vascular bed accounts for the resistances in series and in parallel of the individual vessels. The fact that r in the equation is to the fourth power explains why R is exquisitely sensitive to small changes in caliber of these small vessels (a 10% change in radius results in almost 50% change in resistance). Accordingly, PVR is a good indicator of the state of constriction or dilatation of pulmonary-resistive vessels and is useful for detecting changes in arteriolar vessel caliber due to changes in tone and/or structure.
 EFFECTS OF AGE, SEX, AND BODY POSITION
The limits of normal of resting pulmonary vascular pressures and flows as derived from invasive measurements in 60 resting supine young adult healthy volunteers14,16–18 are shown in Table 13-1. In that study population, cardiac output was lower in women, who are smaller than men, and thus PVR in women was higher. However, there were no sex differences in pulmonary hemodynamics after correction for body dimensions. These data have been confirmed by a recent review of invasive measurements reported in 47 studies on a total of 1187 individuals, of whom 225 were identified as women and 717 as men.19
Aging is associated with an increase in PVR. This is due to a slight increase in mPpa and a more important decrease in cardiac output leading to a doubling of PVR over a period of five decades.20,21 However, measurements in healthy elderly individuals are few, so that the exact limits of normal of the pulmonary circulation as a function of age are not exactly known.
Body position affects PVR through associated changes in systemic venous return. In the upright position, Pla, right atrial pressure (Pra), and cardiac output are lower in the supine position. Because of pulmonary vascular derecruitment, mPpa remains essentially the same. Accordingly, PVR is higher upright. This difference in upright versus supine PVR is important to keep in mind when examining PVR changes during exercise performed upright as compared to supine (Fig. 13-5).22
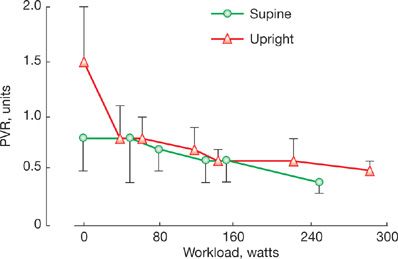
Figure 13-5 Pulmonary vascular resistance (PVR) at rest and during progressively increased workload in healthy volunteers in the upright (triangles) versus the supine position (circles). Resting PVR was higher in the upright position. As soon as at moderate workload, upright and supine PVR converge, with mild further decline with increasing levels of exercise. Vertical bars indicate SDs. (Data from Reeves JT, Dempsey JA and Grover RF. Pulmonary circulation during exercise. In: Pulmonary Vascular Physiology and Physiopathology. Edited by Weir EK and Reeves JT. New York: Marcel Dekker; 1989:107–133.)
EFFECTS OF PULMONARY BLOOD FLOW
The inherent assumption in a PVR calculation is that the mPpa–flow relationship is constant and crosses the pressure axis at a value equal to Pla (such that when flow is zero, theoretically, mPpa = Pla). Then, PVR is constant, independent of the absolute pressure or flow.
The relationship between (mPpa–Pla) and Q has been shown to be reasonably well described by a linear approximation over a limited “physiological” range of flows, with a zero extrapolated pressure intercept in well-oxygenated lungs in supine resting intact animals including man, suggesting complete recruitment and minimal distension of the normal well-oxygenated pulmonary circulation. However, hypoxia and a number of cardiac and respiratory diseases increase both the slope and the extrapolated intercepts of multipoint mPpa–Q plots.23
While an increase in the slope of mPpa–Q is easily understood as being caused by a decreased cross-sectional area of pulmonary-resistive vessels, the nonzero and typically positive extrapolated pressure intercept has inspired various explanatory models.
 THE STARLING RESISTOR MODEL OF THE PULMONARY CIRCULATION
To explain the nonzero and positive pressure intercept, Permutt et al.24 conceived a vascular “waterfall” or “Starling resistor” model made of parallel collapsible vessels with a distribution of nonzero and positive closing pressures. The waterfall analogy refers to the fact that the flow rate (Q) over a waterfall is independent of its height (the pressure difference between upstream and downstream). Instead, an “external” factor (in the case of a waterfall, fluid momentum) controls the flow rate. The Starling resistor itself was actually a device: A collapsible tube inside of a closed chamber that could be pressurized, thus providing an “external” control over the flow rate through the collapsible tube. Starling used this device in the circuit of his heart–lung preparation to control blood pressure. Permutt postulated that in the pulmonary circulation, as flow decreased, arteries would be progressively derecruited, accounting for a low-flow mPpa–Q curve that is concave to the flow axis, and intercepts the pressure axis at the lowest closing pressure needed to be overcome to generate a flow. At higher flows, complete vessel recruitment and negligible distension account for a linear mPpa–Q curve with an extrapolated pressure intercept representing a weighted mean of closing pressures. In this model, the mean closing pressure is the effective outflow pressure of the pulmonary circulation. At higher flows, Pla is equal to the mean closing pressure. However, at lower flows, Pla is less than the mean closing pressure and becomes irrelevant to flow, analogous to the height of water below a waterfall (Fig. 13-6).
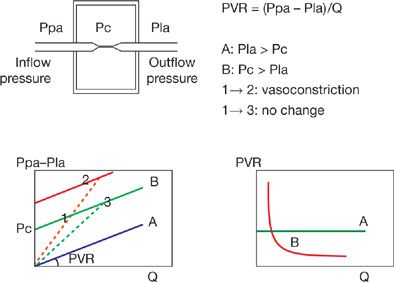
Figure 13-6 Starling resistor model to explain the concept of closing pressure within a circulatory system. Flow (Q) is determined by the gradient between an inflow pressure or mean pulmonary artery pressure (Ppa), and an outflow pressure which is either closing pressure (Pc) or left atrial pressure (Pla). When Pla > Pc, the (Ppa – Pla)/Q relationship crosses the origin (A curve) and PVR is constant. When Pc > Pla, the (Ppa – Pla)/Q relationship has a positive pressure intercept (B curve), and PVR decreases curvilinearly with increasing Q. The B curve is curvilinear a low flow representing recruitment. Also shown are possible misleading PVR calculations: PVR, the slope of (Ppa – Pla)/Q may remain unchanged in the presence of a vasoconstriction (from 1 to 2) or decrease (from 1 to 3) with no change in the functional state of the pulmonary circulation (unchanged pressure/flow line). (Adapted with permission from Naeije R. Pulmonary vascular resistance: a meaningless variable? Intens Care Med. 2003;29:526–529.)
A characteristic typical of a vascular system made up of collapsible vessels is the functional dissociation between inflow pressures, outflow pressures, and flow rate when the closing pressure is higher than the (apparent) outflow pressure (Fig. 13-7). The functional dissociation of inflow and outflow pressures is a feature of derecruited upright upper lung zone 1 described by West et al.25 It has been reported in pulmonary hypertension associated with acute lung injury26,27 and in patients who have undergone a cardiac transplantation.28
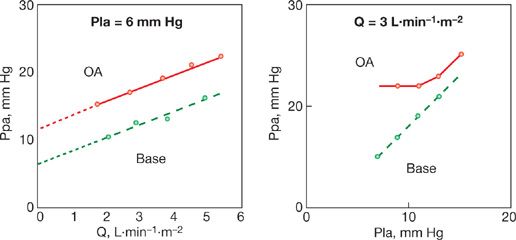
Figure 13-7 Mean pulmonary artery pressure (Ppa) as a function of cardiac output (Q) at constant left atrial pressure (Pla), left panel, and Ppa as a function of Pla at constant Q in an anesthetized dog before (stippled line) and after (full line) injection of oleic acid (OA) to produce an acute lung injury. Lung injury was associated with a shift of linear Ppa–Q relationship to higher pressures, with increased extrapolated pressure intercept (small stipple line). Pla was transmitted to Ppa in a close to 1/1 relationship before oleic acid, but only at a pressure equal to the extrapolated pressure intercept of Ppa–Q after oleic acid, which is compatible with an increased closing pressure becoming the effective downstream pressure of the pulmonary circulation. (Reproduced with permission from Leeman M, Lejeune P, Closset J, Vachiéry JL, Mélot C and Naeije R. Nature of pulmonary hypertension in canine oleic acid pulmonary edema. J Appl Physiol. 1990;69:293–298.)
Thu Starling resistor model of the pulmonary circulation appears adequate to explain pressure–flow relationships in derecruited lung regions in healthy states and possibly in certain pathological states associated with an increased surrounding pressure of the small pulmonary-resistive arterioles, such as in lung edema. However, the model has failed to predict correctly mPpa–Q relationships in embolic pulmonary hypertension or after changes in hematocrit.29 Therefore distensibility models at variable hematocrit have been developed.
 DISTENSIBLE MODELS OF THE PULMONARY CIRCULATION
Zhuang modeled the feline pulmonary circulation taking into account not only morphometry but also mechanics (i.e., distensibility) of the pulmonary vascular tree and rheological properties of each of its branched segments.30 The authors predicted mPpa–Q curves with a slight curvilinearity concave to the flow axis over physiological ranges of flow that was progressively enhanced at decreasing flow. This curvilinearity was generated via arterial, capillary, and venous distensibility based on experimental data with no need to invoke a closing pressure. The distensible or compliant model of Zhuang has been shown to predict parallel shifts of Ppa–Q plots to higher pressures, induced by various interventions such as embolism, changes in lung volume, and hypoxia, and even a functional dissociation between Ppa and Pla at constant Q.30–32 The model was effective in accurate predictions of mPpa–Q curves at various levels of angiographically determined embolic pulmonary vascular obstruction33 (Fig. 13-8).
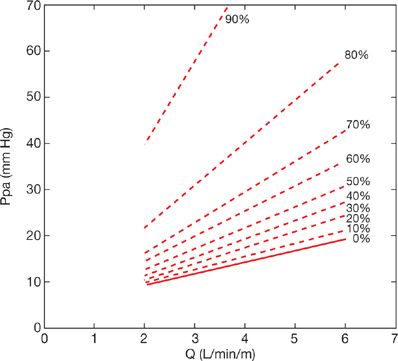
Figure 13-8 Mean pulmonary artery pressure (Ppa)–cardiac output (Q) relationships predicted by the viscoelastic model of Zhuang at increasing levels of angiographically determined embolic obstruction. An increase in mean Ppa above 25 mm Hg corresponding to the definition of pulmonary hypertension occurs after approximately 50% obstruction of the pulmonary vascular bed. A mean Ppa of 50 mm Hg as seen in severe pulmonary hypertension corresponds to 80% obstruction. These estimates are for a Q of 5 L/min, the Ppa–obstruction relationship is flow dependent. (Data from Mélot C, Delcroix M, Lejeune P, Leeman M and Naeije R. Starling resistor versus viscoelastic models for embolic pulmonary hypertension. Am J Physiol. 1995;267 (Heart Circ Physiol 36):H817–H827.)
Linehan reasoned that previously reported compliant models were too complex, requiring a large number of parameters not identifiable from pressure and flow measurements alone.29 Accordingly, he developed a simpler distensibility model and showed its adequacy to describe mPpa–Q relationships at variable hematocrits in perfused dog lung lobes. In this model, PVR is calculated with the introduction of a pulmonary-resistive vessel distensibility factor α:

The distensibility factor α corresponds to the % increase in diameter D0 per mm Hg increase in pressure:

This model allows for prediction of mPpa at given levels of resistance Pla, Q, hematocrit, and distensibility.34
Multipoint mPpa–Q plots disclose a slight curvilinearity, which is explained by the natural distensibility of resistive vessels (Fig. 13-9). When generated over a limited physiological range of flows, such curves can still be described by a linear approximation. It is then possible to calculate slope for the estimation of average resistance and an extrapolated pressure intercept to suggest a closing pressure. The slope of multipoint mPpa–Q plots offers a refined definition of the resistive properties of the pulmonary circulation, superior to isolated PVR calculations.23 Extrapolated pressure intercepts are of unclear significance and would overestimate any possible pulmonary closing pressure in proportion to increased distensibility (Fig. 13-9).
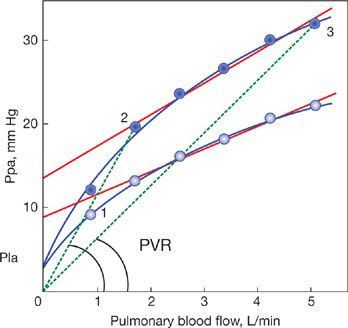
Figure 13-9 Pulmonary artery pressure (Ppa) as a function of blood flow (Q) in normoxia (empty circles) and in hypoxia (full circles). Left atrial pressure was 6 mm Hg. Pressure–flow relationships show a slight curvilinearity. Linear adjustment of data points is a cause of positive extrapolated pressure intercepts, and misleading pulmonary vascular resistance (PVR) calculations. Hypoxia-induced increase in Ppa because of hypoxic vasoconstriction is accompanied by unchanged PVR (from 1 to 2) or decreased PVR (from 1 to 3) depending on increased flow. (Data from Nelin LD, Krenz GS, Rickaby DA, Linehan JH and Dawson CA. A distensible vessel model applied to hypoxic pulmonary vasoconstriction in the neonatal pig. J Appl Physiol. 1992;73:987–994.)
Alternatively, from a given set of values of resistance, Ppam, Pla, and Q and at rest and during exercise, the Linehan equation permits recalculation of the distensibility coefficient α. Reeves et al.35 used reported pulmonary hemodynamic data obtained by right heart catheterization at rest and during exercise in healthy volunteers, and were able to recalculate a value of α equal to 2 ± 0.2%/mm Hg in normoxia. This value was remarkably identical on average to the 2%/mm Hg measured on isolated vessels from a variety of various mammalian species.36 Reeves also showed that α tends to decrease with aging, and with chronic but not acute hypoxic exposure.35 Similar values of α were calculated by Argiento et al.37 from Doppler echocardiographic measurements of pulmonary vascular pressures and flows in normal volunteers. In that study, α was lower in men compared to premenopausal women and decreased with age. The same noninvasive approach revealed a decreased α with chronic hypoxic exposure.38
VISCOSITY
Chronic hypoxic exposure is associated with an increased expression of erythropoietin, resulting in increased red blood cell mass, hematocrit, and hemoglobin levels. The upper limits of normal of hemoglobin in healthy subjects chronically exposed to hypobaric hypoxia at high-altitude dwellers has been estimated to be at 21 g/dL in men and 19 g/dL in women.39 In the Poiseuille–Hagen equation, resistance is directly proportional to viscosity.
The most often used reference equation describing a linear relationship between resistance and hematocrit was reported by Whittaker and Winton based on studies on hind limb vessels40:
![]()
where R0 is PVR at a hematocrit (HCT) of 45% and φ the measured hematocrit.
Linehan et al.29 reported an exponential relationship to explain the effect of hematocrit on mPpa–Q relationships in isolated dog lung experiments,
![]()
The effect of altered hematocrit on representative mPpa–Q relationships in healthy sea level and high-altitude dwellers38 is shown in Figure 13-10. Hematocrit was increased from 45% to 80% in both groups. There was a proportionally more important contribution of increased hematocrit to slope of mPpa–Q in the high-altitude dwellers due to their less distensible pulmonary circulation. Thus the impact of hematocrit on mPpa is enhanced in less distensible pulmonary circulations, for example, typically in old and chronically hypoxic subjects.
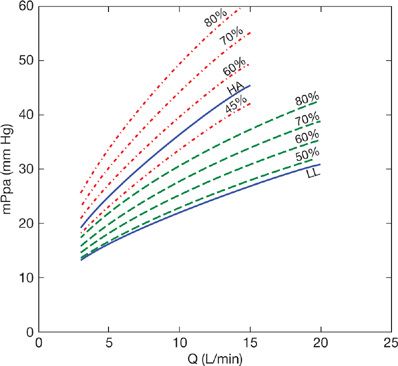
Figure 13-10 Averaged mean pulmonary artery pressure (mPpa)–flow (Q) relationships measured at high altitude in 15 high altitude dwellers (HA) and in 15 lowlander sojourners (LL), full lines at the hematocrit of 45% for LL and 52% for HH. The mPpa–Q curves where shifted to higher pressures due to increased hematocrits up to 80%, as modeled from measurements at increasing levels of exercise37 adjusted with the distensible model of Linehan and associated corrections for hematocrit.28 Increased hematocrit may be a cause of marked pulmonary hypertension at high altitudes.
LEFT ATRIAL PRESSURE AND THE TRANSPULMONARY PRESSURE GRADIENT
An increase in Pla is transmitted upstream to mPpa. The PVR equation assumes that this is in a 1/1 ratio at any given level of Q. Chronic increase in Pla may induce pulmonary vascular remodeling, and therefore lead to an “out of proportion” increase in mPpa.41 For this reason, clinicians like to reason in terms of a transpulmonary pressure gradient (TPG) for the differential diagnosis of purely passive increase in mPpa and increased mPpa resulting from pulmonary vascular disease.42 The TPG is equal to the difference between mPpa and Pla.

The upper limit of normal of the TPG is usually assumed to be 12 mm Hg.42 This corresponds to a PVR of 1.5 Wood units at a cardiac output at the upper limit of normal of 8 L/min. However, it has been recently realized that the TPG is often higher than 12 mm Hg in patients with left heart failure in whom purely passive upstream transmission could be demonstrated by observing an acute return of the TPG to <12 mm Hg after active diuresis or after a cardiac transplantation.28 In steady-flow conditions, an increase in Pla is transmitted upstream in a less than 1:1 ratio because the pulmonary-resistive vessels are distensible.43 In pulsatile flow conditions, an increased Pla increases pulse pressure (PP, or sPpa – dPpa) because of a decreased pulmonary arterial compliance.44 The latter effect is largely predominant.43 Furthermore, the TPG increases with Q because at any increase in flow mPpa increases more than Pla.43 These problems are limited or even avoided by using the gradient between dPpa and Pla, or the diastolic pressure gradient (DPG) instead.43 The upper limit of normal of the DPG is ∼5 mm Hg. The effects of increased Ppw on the TPG versus the DPG are modeled in Figure 13-11. Assuming an unchanged dPpa as a function of Ppw, which is reasonable, it can be seen that high Ppw is associated with a passive increase in TPG to more than 12 mm Hg because of a proportionally greater increase in mPpa.43
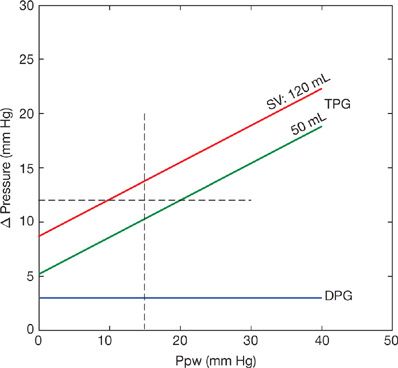
Figure 13-11 Effects of increased pulmonary artery wedge pressure (Ppw) on systolic, diastolic, and mean pulmonary artery pressures (sPpa, dPpa, mPpa) showing progressive increase of the transpulmonary pressure gradient mPpa – Ppw (TPG) with almost unchanged diastolic pressure gradient dPpa – Ppw (DPG). (Data from Naeije R, Vachiery J, Yerly P, Vanderpool R. The transpulmonary pressure gradient for the diagnosis of pulmonary vascular disease. Eur Respir J. 2013;41:217–223.)
GRAVITY
Pulmonary blood flow increases almost linearly from nondependent to dependent lung regions. This inequality of pulmonary perfusion is best demonstrated in an upright lung.25
Stay updated, free articles. Join our Telegram channel

Full access? Get Clinical Tree


