Body composition (fat mass [FM] and skeletal muscle mass [SMM]) predicts clinical outcomes. In particular, loss of SMM (sarcopenia) is associated with frailty and mortality. There are no data on the prevalence and impact of FM and SMM in patients undergoing transcatheter aortic valve implantation (TAVI). The objective of this study is to determine body composition from pre-TAVI computed tomography (CT) and evaluate its association with clinical outcomes in patients who underwent TAVI. A total of 460 patients (mean age 81 ± 8 years, men: 51%) were included. Pre-TAVI CTs of the aorto-ilio-femoral axis were analyzed for FM and SMM cross-sectional area at the level of the third lumbar vertebrae (L3). Regression equations correlating cross-sectional area at L3 to total body FM and SMM were used to determine prevalence of sarcopenia, obesity, and sarcopenic obesity in patients (64%, 65%, and 46%, respectively). Most TAVI procedures were performed through a transfemoral approach (59%) using a balloon-expandable valve (94%). The 30-day and mid-term (median 12 months [interquartile range 6 to 27]) mortality rates were 6.1% and 29.6%, respectively. FM had no association with clinical outcomes, but sarcopenia predicted cumulative mortality (hazard ratio 1.55, 95% confidence interval 1.02 to 2.36, p = 0.04). In conclusion, body composition analysis from pre-TAVI CT is feasible. Sarcopenia, obesity, and sarcopenic obesity are prevalent in the TAVI population, with sarcopenia predictive of cumulative mortality.
Body composition analysis involves the measurement of fat, fat-free mass (FFM), and total body water of a person. Skeletal muscle mass (SMM) and fat mass (FM) are important in epidemiologic studies as they are associated with survival in elderly populations, frailty, and clinical outcomes in chronic diseases. Furthermore, the combination of sarcopenia and obesity (sarcopenic obesity [low SMM-high FM]) has been linked to functional impairment, diabetes mellitus, coronary artery disease, and worse outcome after cardiac surgery. Transcatheter aortic valve implantation (TAVI) has emerged as the treatment of choice for patients with aortic stenosis and high or prohibitive surgical risk. However, no data exist on body composition and its prognostic value in the TAVI cohort. Demonstration of muscle mass loss and other measures of body composition traditionally requires bioelectrical impedance analysis or dual x-ray absorptiometry (DEXA) —techniques that are infrequently used in cardiovascular assessment. Fortuitously, computed tomographic (CT) evaluation of potential TAVI candidates has become routine in TAVI. In this study, we aim to (1) assess the feasibility of evaluating body composition by CT in the TAVI population; (2) determine the prevalence of sarcopenia, obesity, sarcopenic obesity; and (3) analyze the impact of differing body composition on 30-day and late clinical outcomes.
Methods
A total of 574 consecutive patients who underwent TAVI at 2 Canadian centers were included. Details of the evaluation process, TAVI procedure, major complications, procedural outcomes, and follow-up have been described elsewhere. In brief, a heart team evaluated all potential candidates for TAVI, and a systemic pre-TAVI workup protocol was performed including Doppler echocardiography, coronary angiography, and CT of the chest/abdomen/pelvis. A total of 114 patients were excluded because the acquired CT images had an inadequate image field of view to allow complete assessment of muscle and fat components at L3. The final study cohort consisted, therefore, of 460 patients, which exhibited similar baseline characteristics as those of excluded patients except for a lower rate of dyslipidemia and pulmonary hypertension.
Periprocedural data were prospectively collected on pre-set data collection forms. Clinical follow-up was conducted by clinical visits and/or telephone consultation. Patients were followed up at 1, 6, and 12 months and annually thereafter, with no patient lost to follow-up. The body composition as evaluated by CT was a post hoc retrospective analysis.
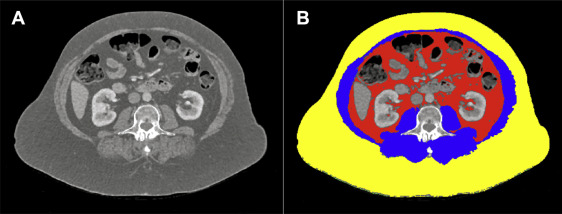
For the purpose of this study, 2 consecutive slices per patient were retrospectively obtained at the level of the mid-body of L3 ( Figure 1 ). Muscles that can be identified at L3 are psoas (major and minor), erector spinae, quadratus lumborum, transversus abdominis, external and internal obliques, and rectus abdominis. Abdominal adipose tissue at L3 was also subdivided into subcutaneous adipose tissue (SAT) and visceral adipose tissue. Cross-sectional area (CSA) was measured using SliceOmatic, version 4.3 (TomoVision, Magog, Quebec, Canada) and expressed in square centimeters (cm 2 ). CT Hounsfield unit thresholds of (−29 to +150) was used to define and quantify L3 muscle (−190 to −30) for SAT and (−150 to −50) for visceral adipose tissue ( Figure 1 ). SMM-CSA per patient was also indexed to patient height in meters squared (skeletal muscle mass index [SMMI] CSA in cm 2 /m 2 ) to allow for comparison with published data. Height and weight were recorded for each patient at their initial clinic assessment. Weight was measured in kilogram (kg) and height in meters (m). Body mass index (BMI) was calculated by weight (kg) divided by height squared (m 2 ).
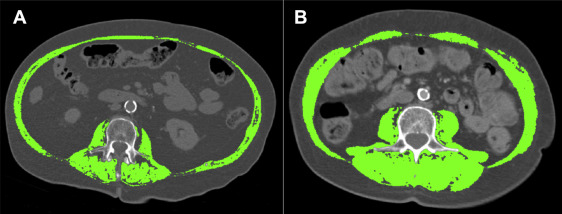
Sarcopenia was defined as an SMMI 2 SDs less than the mean SMMI of young, healthy gender-specific reference ranges. DEXA-measured gender-specific appendicular skeletal muscle mass (ASMM) index cutoffs for sarcopenia used in published literature are <7.26 kg/m 2 in men and <5.45 kg/m 2 in women. Although ASMM was not measured during the pre-TAVI workup, CT CSA at the lumbar region is linearly correlated with whole-body muscle mass. Furthermore, Mourtzakis et al demonstrated a correlation between CT and DEXA measurement of body composition (r = 0.89, p <0.001) and produced regression equations for the assessment of body composition from CT. Our study used published gender-specific CSA cut-off values for sarcopenia as measured by CT at L3 of <55.4 cm 2 /m 2 for men and <38.9 cm 2 /m 2 for women. Figure 2 shows an example of sarcopenia versus no sarcopenia in 2 female subjects of similar age and BMI. Obesity was defined as an estimated percentage whole-body fat mass (WBFM%) of >27% in men and 38% in women. Estimation of whole-body fat mass (WBFM) and WBFM% as described by Mourtzakis et al was performed by Equations 1 and 2, respectively:
WBFM ( kg ) = 0 . 042 × ( fat tissue at L 3 using CT [ cm 2 ] ) + 11.2
With a correlation of r = 0.88 (0.83 to 0.97), p <0.001 to DEXA.
Stay updated, free articles. Join our Telegram channel

Full access? Get Clinical Tree


