At present, traditional risk factors are used to guide cardiovascular management of asymptomatic subjects. Intensified surveillance may be warranted in those identified as high risk of developing cardiovascular disease (CVD). This study aims to determine the prognostic value of coronary computed tomography (CT) angiography (CCTA) next to the coronary artery calcium score (CACS) in patients at high CVD risk without symptoms suspect for coronary artery disease (CAD). A total of 665 patients at high risk (mean age 56 ± 9 years, 417 men), having at least one important CVD risk factor (diabetes mellitus, familial hypercholesterolemia, peripheral artery disease, or severe hypertension) or a calculated European systematic coronary risk evaluation of >10% were included from outpatient clinics at 2 academic centers. Follow-up was performed for the occurrence of adverse events including all-cause mortality, nonfatal myocardial infarction, unstable angina, or coronary revascularization. During a median follow-up of 3.0 (interquartile range 1.3 to 4.1) years, adverse events occurred in 40 subjects (6.0%). By multivariate analysis, adjusted for age, gender, and CACS, obstructive CAD on CCTA (≥50% luminal stenosis) was a significant predictor of adverse events (hazard ratio 5.9 [CI 1.3 to 26.1]). Addition of CCTA to age, gender, plus CACS, increased the C statistic from 0.81 to 0.84 and resulted in a total net reclassification index of 0.19 (p <0.01). In conclusion, CCTA has incremental prognostic value and risk reclassification benefit beyond CACS in patients without CAD symptoms but with high risk of developing CVD.
In the general population, the annual incidence of sudden cardiac death is estimated from 50 to 100 cases per 100,000 adults, both in Europe and North America, accounting for approximately 50% of all cardiac deaths. In at least half of these cases, sudden cardiac death is the first and only manifestation of cardiovascular disease (CVD) in an otherwise asymptomatic individual. Autopsy data show that >80% of these subjects had anatomically important, subclinical coronary artery disease (CAD). At present, traditional risk factors are used to guide cardiovascular management of asymptomatic subjects. Patients without symptoms or signs of CAD, but with diabetes mellitus (DM), familial hypercholesterolemia (FH), peripheral artery disease (PAD), severe hypertension, or a calculated European systematic coronary risk evaluation of >10% are considered at high risk of developing a cardiovascular event. Therefore, optimal primary prevention is required including preventive pharmacologic treatment and screening for organ damage. Studies have shown that the coronary artery calcium score (CACS) is useful for refined risk stratification in these patients at high risk, in particular, in those with DM. It has been postulated that asymptomatic patients at high risk might benefit from increased medical surveillance. Coronary computed tomography (CT) angiography (CCTA) offers a more detailed assessment of subclinical CAD and could be of incremental prognostic value, as previously demonstrated in symptomatic patients. The aim of this observational multicentre study was to determine whether CCTA improves risk prediction beyond CACS in patients without symptoms of CAD but at high risk of developing CVD.
Methods
Eligible patients (aged between 45 and 70 years) were clinically referred to the outpatient clinics of 2 academic hospitals by general practitioners or other physicians for optimized cardiovascular management and primary prevention according to current guidelines. For this observational study, we collected patients prospectively and retrospectively, who were considered at high risk of developing CVD, because of the presence of a markedly elevated single cardiovascular risk factor, such as DM, FH, PAD, severe hypertension, or a calculated European systematic coronary risk evaluation of >10%.
DM was defined as fasting glucose levels >7.0 mmol/L or >11.1 mmol/L 2 hours after an oral glucose tolerance test. FH was defined as the presence of a documented low-density lipoprotein receptor mutation or a low-density lipoprotein cholesterol level above the gender and age corrected 95th percentile in combination with typical clinical characteristics in the patient or a first degree relative. Severe hypertension was defined as a systolic blood pressure level >160 mm Hg or a diastolic blood pressure >100 mm Hg. PAD was defined as a history of targeted surgical, percutaneous, or medical treatment of atherosclerosis in a noncoronary artery.
All patients were receiving intense lifestyle counseling and/or medical therapy at baseline, and strict compliance was ensured by regular outpatient clinic visits. Exclusion criteria included a history of CAD, renal dysfunction (serum creatinine >120 mmol/L), contrast allergy, irregular heart rhythm, severe chronic obstructive pulmonary disease, or known pregnancy. The study complies with the Declaration of Helsinki, and the study protocol was approved by the institutional review boards. A waiver was obtained for the use of retrospective data. A proportion of patients was enrolled prospectively and provided written informed consent.
Image acquisition was performed on multidetector row CT scanners with ≥64 rows. Detection of coronary artery calcium was performed using an electrocardiogram-triggered axial scan and measured using the Agatston method. Patients were stratified in groups according to the extent of coronary artery calcification: 0, 1 to 100, 101 to 400, and >400 CACS. CCTA was performed during a single inspiration using an electrocardiogram-triggered axial scan with x-ray tube current modulation and tube voltage reduction when clinically feasible. A 17-segment coronary artery tree model (as recommended by the American Heart Association) was used to describe the presence, extent, and severity of CAD. In the case of severe movement or inappropriate contrast delivery, resulting in nondiagnostic image quality of >1 coronary artery or important proximal segments, the entire scan was considered nondiagnostic.
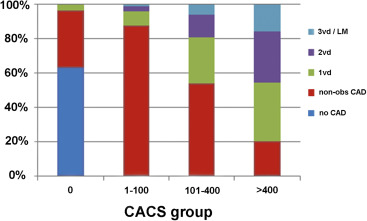
Stenosis grade was visually classified either as <29%, 30% to 49%, 50% to 69%, ≥70% luminal narrowing or occluded (100%). We used commonly applied methods of measuring extent of CAD. First, subjects were categorized in groups by most severe CAD lesion: “obstructive CAD” (≥1 plaque with ≥50% luminal stenosis), “nonobstructive CAD” (<49% luminal stenosis), or “absence of CAD”. Second, patients were classified by the number of coronary arteries with obstructive CAD into “3-vessel or left main obstructive CAD”, “2-vessel obstructive CAD”, “single-vessel obstructive CAD”, “nonobstructive CAD” or “absence of CAD”. In addition, to determine the overall coronary artery plaque burden, a segment stenosis score was calculated: <29% stenosis: score 0; 30% to 49%: score 1; 50% to 69%: score 2; and ≥70%: score 3. Finally, the number of segments with CAD ≥30% stenosis was determined.
The primary outcome measure was a combination of adverse events including all-cause mortality, nonfatal myocardial infarction (MI), unstable angina, or coronary revascularization beyond 90 days after the index CCTA. All-cause mortality was confirmed using the Dutch National Mortality Registry. Information regarding clinical events was acquired through questionnaires, outpatient visits, or electronic patient records. Nonfatal MI and unstable angina were defined according to current guidelines.
Statistical analyses were performed using SPSS software (SPSS Inc, Chicago, Illinois) and SAS software (SAS Institute, Cary, North Carolina). Categorical variables are presented as proportions and continuous variables are expressed as mean (±SD) or median (interquartile range), as appropriate. The cumulative incidence of adverse events over time was estimated according to the Kaplan–Meier method, whereas the log-rank test was applied to evaluate differences.
Univariate Cox regression analysis was applied to assess associations between clinical characteristics or imaging results and incidence of adverse events. Cox regression models including CACS and CCTA, adjusted for age and gender, were used to determine adjusted hazard ratios with 95% CIs. Improvement in discriminative model performance and reclassification was assessed by calculating C statistics and net reclassification index (NRI) at 2.5 years. NRI is a measure of correctly reclassified patients penalized for those incorrectly classified. Because no validated risk score is avaliable to determine baseline risk in this population, required for the calculation of NRI, we used a binary regression model with age and gender to substratify patients to low (<1%), intermediate (1% to 5%), or high baseline risk (>5%). Subsequently, CACS and CCTA information was added to calculate NRI. In addition, we examined the association between CCTA findings and incidence of adverse events in patients with zero, intermediate, and high CACS. All probability values refer to 2-tailed tests of significance and a p value <0.05 was considered significant.
Results
A total of 665 subjects were included from September 2006 to March 2013. The mean age was 56 ± 9 years and 417 patients (63%) were men ( Table 1 ). Most patients received medical therapy, and statins (492 patients [74%]) were the most frequently prescribed medication. No coronary artery calcium was detected in 174 patients (27%), whereas 127 patients (19%) had an Agatston score >400. On CCTA, 126 patients (19%) had no detectable CAD, 337 patients (51%) had nonobstructive CAD and obstructive CAD was noted in 192 patients (29%). We observed CAD on CCTA in 66 patients (38%) with zero CACS ( Figure 1 ). The median radiation dose of the calcium scan was 1.0 (interquartile range 0.7 to 1.4) mSv and 5.3 (3.4 to 8.4) mSv for CCTA using a conversion factor (k) of 0.014.
| Variable | All patients (n = 665) |
|---|---|
| Age, mean ± SD (Years) | 56 ± 9 |
| Men | 417 (63%) |
| Smoker | 150 (23%) |
| Blood pressure >130/80 mm Hg | 333 (50%) |
| Dyslipidemia ∗ | 423 (64%) |
| Diabetes mellitus | 378 (57%) |
| Positive family history of CAD | 295 (44%) |
| Body Mass Index >30 kg/m 2 | 173 (26%) |
| Medication | |
| Statin | 492 (74%) |
| Oral antidiabetics | 236 (35%) |
| Insulin | 207 (31%) |
| ACE inhibitor | 169 (25%) |
| Aspirin | 162 (24%) |
| Beta-blocker | 151 (23%) |
| AR-blocker | 129 (19%) |
| Calcium channel blocker | 78 (12%) |
| Coronary artery calcium score | |
| 0 | 174 (27%) |
| 1-100 | 239 (37%) |
| 100-400 | 115 (18%) |
| >400 | 127 (19%) |
| Coronary omputed Tomography Angiography | |
| No Coronary Artery Disease | 126 (19%) |
| Non-obstructive Coronary Artery Disease | 337 (51%) |
| Obstructive Coronary Artery Disease (≥50% diameter stenosis) | 192 (29%) |
| Number of coronary arteries with ≥50% diameter stenosis | |
| 1 | 103 (15%) |
| 2 | 59 (9%) |
| 3 or left main disease | 30 (5%) |
| Segment stenosis score, median (IQR) | 6 (2-12) |
| Segment involvement score, median (IQR) | 4 (1-7) |
∗ Dyslipidemia was defined as either known familial hypercholesterolemia, on statin treatment, or measured serum low-density lipoprotein cholesterol levels >190 mg/dl.
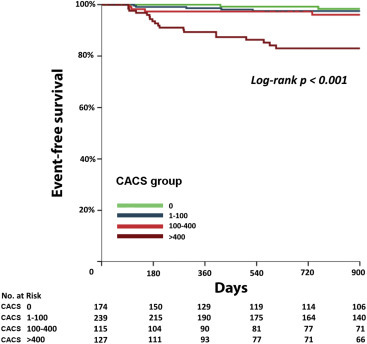
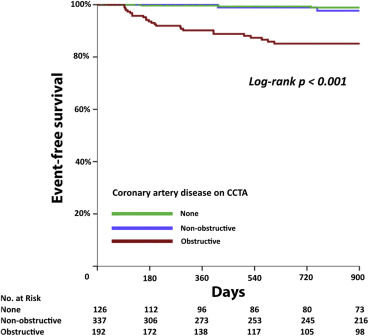
Follow-up was obtained for 620 patients (95%) with an interpretable scan during a median follow-up period of 3.0 (1.3 to 4.1) years. All-cause mortality was checked for all patients. The composite outcome occurred in 40 patients (6.0%) with an estimated annual incidence of 2.0% after a median period of 3 years. All-cause mortality was recorded in 9 patients, nonfatal MI in 3 patients, unstable angina in 3 patients, and late coronary revascularization in 25 subjects. The annual incidence of adverse events in patients with zero CACS (0.4% [CI 0.1% to 1.3%]) was significantly lower compared to patients with CACS >400 (6.8% [CI 4.8% to 9.4%]; Figure 2 ). Patients with obstructive CAD on CCTA (6.0% [CI 4.4% to 8.0%]) had a significantly higher incidence of adverse events compared to patients without (0.5% [CI 0.2% to 1.9%]) or nonobstructive CAD (0.5% [CI 0.2% to 1.2%]; Figure 3 ).
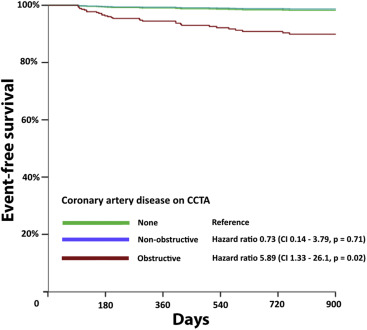
Univariate Cox regression analysis identified age, male gender, and DM as significant predictors of the composite outcome ( Table 2 ). There was a positive correlation between the occurrence of adverse events and CACS. Also, patients with obstructive CAD on CCTA had a higher incidence of adverse events compared to patients without obstructive CAD. The semiquantitative measures of plaque burden, segment stenosis score, or number of segments with CAD were significant predictors of adverse events. In multivariate Cox regression analysis, accounting for age, gender, and CACS, obstructive CAD on CCTA remained a significant predictor of adverse events ( Figure 4 ).
| Variable | Hazard ratio (95% Confidence Interval) | p value |
|---|---|---|
| Age, per year | 1.05 (1.01–1.09) | 0.01 |
| Man | 2.83 (1.25–6.40) | 0.01 |
| Cardiovascular risk factors | ||
| Smoker | 1.84 (0.95–3.59) | 0.07 |
| Blood pressure >130/80 mmHg | 1.80 (0.95–3.43) | 0.07 |
| Dyslipidemia ∗ | 0.83 (0.43–1.57) | 0.56 |
| Diabetes mellitus | 4.49 (2.05–9.81) | <0.001 |
| Positive family history of CAD | 0.77 (0.41–1.44) | 0.41 |
| Body Mass Index >30 kg/m 2 | 1.18 (0.59–2.36) | 0.65 |
| Coronary artery calcium score | ||
| 0 | Reference | NA |
| 1-100 | 1.84 (0.36 – 9.50) | 0.47 |
| 101-400 | 5.55 (1.18 – 26.17) | 0.03 |
| >400 | 17.56 (4.16 – 74.20) | <0.001 |
| Coronary Computed Tomography Angiography | ||
| No Coronary Artery Disease | Reference | NA |
| Non-obstructive Coronary Artery Disease | 0.87 (0.17–4.46) | 0.86 |
| Obstructive Coronary Artery Disease (≥50% diameter stenosis) | 11.23 (2.69–46.80) | 0.001 |
| Number of coronary arteries with ≥50% diameter stenosis | ||
| None | Reference | NA |
| 1 | 5.09 (1.10–23.65) | 0.04 |
| 2 | 14.54 (3.25–65.06) | <0.001 |
| 3 or left main disease | 26.12 (5.82–117.22) | <0.001 |
| Segment stenosis score (per point) | 1.13 (1.09–1.18) | <0.001 |
| Segment involvement score (per point) | 1.21 (1.13–1.30) | <0.001 |
∗ Dyslipidemia was defined as either known familial hypercholesterolemia, on statin treatment or measured serum LDL-C levels >190 mg/dl.
Most adverse events, that is, 32 (8.5%) in 378 patients, was observed in patients with DM, where the incidence of CAD detected with CCTA was also higher compared with patients without diabetes ( Supplementary Material ). The prognostic performance of both CCTA and CACS in these patients was equally well compared to the total study population.
The addition of CACS to a model with age and gender increased the C statistic to 0.81; subsequent addition of obstructive CAD increased the C statistic to 0.84 ( Table 3 ). With the addition of CACS, we observed an NRI of 0.35 (p <0.01). There was an additional reclassification observed with the addition of CCTA to age, gender plus CACS with an NRI of 0.19 (p <0.01).
| Model | C Statistic (95% Confidence Interval) | Total NRI | Proportion of non- events correctly reclassified | Proportion of events correctly reclassified |
|---|---|---|---|---|
| Model I: Age and gender | 0.66 (0.58–0.75) | |||
| Model II: Model I + CACS | 0.81 (0.74–0.87) | 0.35 ∗ | 0.32 ∗ | 0.02 |
| Model III: Model II + CCTA | 0.84 (0.78–0.90) | 0.19 ∗ | 0.16 ∗ | 0.02 |
Stay updated, free articles. Join our Telegram channel

Full access? Get Clinical Tree


