Aortic valve calcium (VC) detected on noncontrast cardiac computed tomography angiography (CCTA) is known to be associated with all-cause mortality in asymptomatic and primary prevention population. However, the clinical significance of aortic and mitral VC remains unknown in symptomatic patients with suspected coronary artery disease (CAD). The aim of the present study was to assess whether aortic and mitral VC is independently associated with cardiac events and all-cause mortality in symptomatic patients with suspected CAD. A total of 369 symptomatic patients (mean age 55 ± 11 years, 60% men) who were referred for CCTA because of suspected CAD were included in the study. Aortic and mitral VC was detected and quantified by volume on contrast CCTA. Median follow-up for events (coronary events and all-cause mortality) was 2.8 (interquartile range 1.6 to 4.0) with a maximum of 5.5 years. A total of 39 patients (11%) had VC. Increased age, hypertension, and increased Agatston coronary artery calcium score were associated with VC. During the follow-up, patients with VC had higher risk for a coronary event (38.8% vs 11%, log-rank p <0.001) and worse survival rate (92.3% vs 99.1%, log-rank p = 0.002) compared with those without VC. Volume of VC was independently associated with outcome after adjusting for clinical variables (hazard ratio 1.88, p <0.001), Agatston coronary artery calcium score (hazard ratio 1.47, p = 0.03), and significant CAD (hazard ratio 1.81, p = 0.001). In conclusion, aortic and mitral VC volume quantified on contrast CCTA was independently associated with coronary events and all-cause mortality in patients with suspected CAD.
Contrast-enhanced cardiac computed tomography angiography (CCTA) is nowadays used for the anatomic evaluation of coronary artery disease (CAD) in symptomatic patients with chest pain and low-to-intermediate probability of CAD. Besides CAD, valve calcium (VC) can be detected by contrast-enhanced CCTA. Aortic and mitral VC detected by CCTA has been associated with increased prevalence of CAD, cardiovascular events, and all-cause mortality in asymptomatic patients. However, little is known about the prognostic value of aortic and mitral VC detected by CCTA in symptomatic patients. Moreover, the value of VC quantification on contrast-enhanced CCTA has never been explored. Therefore, the aim of the present study was to assess the independent association between VC, detected and quantified on contrast CCTA, and prognosis in symptomatic patients with suspected CAD.
Methods
We included all symptomatic patients who underwent a clinically indicated contrast-enhanced CCTA for the evaluation of CAD from November 2007 to April 2010. Patients with previous diagnosis of CAD, congenital heart disease, mechanical valve prosthesis, and poor CCTA diagnostic image quality were excluded.
All scans were performed using a 64–detector row computed tomography scanner or a 320-row scanner according to established guidelines and local protocol. Scan parameters were 120 kV, 300 mA (depending on body mass index and thoracic anatomy), and collimation of 64 × 0.5 mm and 120 kV, 400 to 580 mA (depending on body mass index and thoracic anatomy), and collimation of 320 × 0.5 mm for 64- and 320-row scanners, respectively. Contrast-enhanced CCTAs were reconstructed at 75% of the RR interval with a slice thickness of 0.3 mm for the 64- and 0.5 mm, increment 0.25 mm, for the 320-detector scanner. Nonenhanced CCTAs were also reconstructed at 75% of the RR interval but with a slice thickness of 3 mm nonoverlapping. Reconstructed images were transferred to a remote workstation (Vital Images, Plymouth, Minnesota) for postprocessing with dedicated software.
The noncontrast scans were used to evaluate the total coronary artery calcium (CAC) score as described by Agatston et al applying a threshold of ≥130 Hounsfield units (HU) with commercially available software (ViTREA 2; Vital Images, Minnetonka, Minnesota).
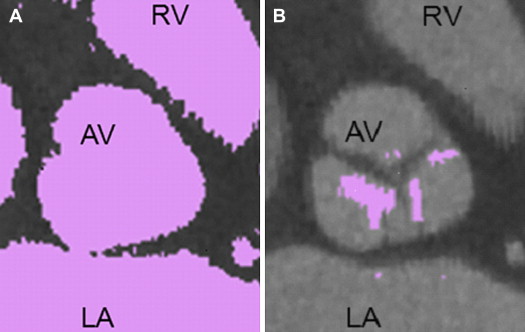
To quantify VC on contrast-enhanced CCTA, a novel automated data postprocessing software (customized research version of CalcScore V11.1 by Medis specials b.v.) was used. Because both calcium and contrast medium have a radio density of >130 HU, a cut-off value of >130 HU as used for noncontrast scans, is not suitable to quantify calcium on contrast-enhanced CCTA images. Therefore, in the present study we applied a predefined threshold of 800 HU to quantify calcium on the aortic and mitral valve. An example of both thresholds is depicted in Figure 1 . Because the Agatston score is only suitable for assessing CAC, VC was quantified by assessing the volume (mm 3 ) of calcium on contrast-enhanced CCTA.
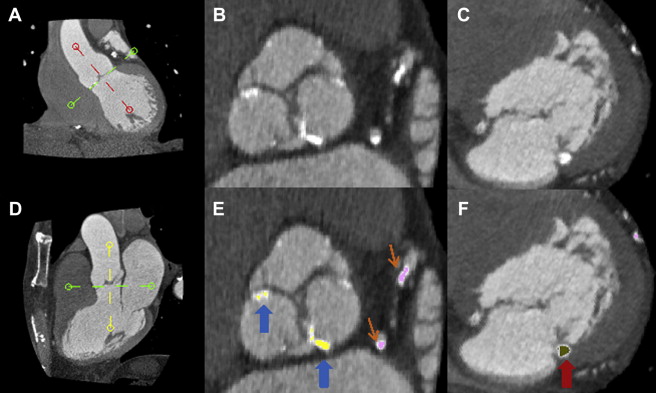
To quantify VC we performed the following steps. Because the aortic valve is depicted obliquely on the standard axial view, the first step was to reorient the image based on the aortic valve. Using 3 multiplanar reformation planes ( Figure 2 ), a double oblique transverse view was created. In this plane, the aortic cusps were equally bisected allowing concomitant visualization of the insertion point of the aortic cusps ( Figure 2 ). Secondly, scrolling through sequential axial images below the aortic annulus, the mitral valve can be visualized in this view ( Figure 2 ). Next, 3-mm slabs were created to facilitate accurate VC quantification. Subsequently, the aortic ( Figure 2 ) and mitral VC ( Figure 2 ) were manually selected. The aortic VC included all calcium within the level of the aortic annulus till the level of the coronary ostia. Mitral VC was defined as calcium of the mitral annulus and leaflets. Finally, the volume of the selected aortic and mitral VC was calculated automatically by the software.
Presence of significant CAD was evaluated from the contrast CCTA as previously described. Significant CAD was defined as ≥50% stenosis.
Cardiovascular risk factors evaluated for this study were hypertension, defined as systolic blood pressure ≥140 mm Hg and/or diastolic blood pressure ≥90 mm Hg and/or the use of antihypertensive medication; hypercholesterolemia, defined as serum total cholesterol ≥230 mg/dl and/or serum triglycerides ≥200 mg/dl and/or treatment with lipid-lowering drugs; diabetes, defined as fasting glucose ≥126 mg/dl and/or on blood glucose–lowering treatment; smoking, as current; obesity, as body mass index ≥30 kg/m 2 ; and family history, defined as the presence of CAD in first-degree family members diagnosed at the age of <55 years in men and <65 years in women.
Clinical information was recorded prospectively into the departmental Cardiology Information System (EPD-Vision, version 8.3.3.6; Leiden University Medical Center, Leiden, the Netherlands) and analyzed retrospectively. Follow-up was completed till January 2013. Patient follow-up data were gathered using clinical visits or standardized telephone interviews. The primary outcome was all-cause mortality. The secondary end point was coronary events, including a composite of myocardial infarction and revascularization (percutaneous coronary intervention and coronary artery bypass grafting). The combined (primary and secondary) end point is described as events.
Statistical analysis was performed with the SPSS software, version 20 (SPSS Inc., Chicago, Illinois). Categorical variables are presented as number and percentages and continuous variables as mean ± SD. Based on the distribution, continuous variables were compared with the Student t test or the Mann-Whitney U test. Categorical variables were compared with the chi-square test. Logistic regression analysis was used to evaluate the association between each cardiovascular risk factor and VC as a categorical variable. In the multivariate adjusted analysis, only the covariates with a p value <0.10 in the univariate analysis were included. CAC Agatston score was introduced in the regression analysis as log(CAC Agatston score + 1). Cumulative event rates from the time of CCTA scanning were calculated using the Kaplan-Meier method. The log-rank test for time-to-event data with respect to the primary (all-cause mortality) and secondary end point (composite end point of myocardial infarction and revascularization) were used for statistical comparison between the patient groups (VC group vs the no-VC group). In addition, the Kaplan-Meier estimates of the primary and the secondary end points were calculated for patients included in the VC group divided according to the median value of calcium volume. Cox regression analysis was conducted for the evaluation of univariate and multivariate hazard ratios for the occurrence of events. CAC Agatston score and VC volume were both introduced in the Cox regression analysis as log(CAC Agatston score + 1) and log(VC volume + 1). Hazard ratios were reported with 95% confidence interval. Statistical significance was considered for p value <0.05.
Results
Of the 384 consecutive symptomatic patients referred for CCTA to detect and evaluate CAD, 369 patients (mean age 55 ± 11 years, 60% men) were finally included in the current analysis. Fifteen patients were excluded because of mechanical aortic valve prosthesis (n = 3, 0.8%) and adult congenital heart disease (n = 12, 3%). VC was observed in 39 patients (10.7%); 34 (9.3%) had aortic VC, 10 (2.8%) had mitral VC, and 5 (1.4%) had calcium on both valves. Baseline characteristics are presented in Table 1 . Patients with VC were older, were more likely to have hypertension, and had a higher CAC score. In addition, patients with hypertension and those with Agatston CAC score >100 had greater VC volumes compared with patients without hypertension and those with Agatston of ≤100, respectively ( Table 2 ).
| Variable | All Subjects (n = 369) | VC | p Value ∗ | |
|---|---|---|---|---|
| No (n= 330) | Yes (n = 39) | |||
| Age (yrs) | 55 ± 11 | 54 ± 11 | 66 ± 9 | <0.001 |
| Men | 221 (60) | 198 (60) | 23 (59) | 0.90 |
| Body mass index (kg/m 2 ) | 26 ± 4.2 | 26 ± 4.1 | 26 ± 4.5 | 0.72 |
| Diabetes mellitus | 103 (30) | 89 (29) | 14 (36) | 0.37 |
| Hypertension | 139 (40) | 117 (38) | 22 (56) | 0.02 |
| Hypercholesterolemia | 123 (35) | 105 (34) | 18 (46) | 0.13 |
| Smoker | 58 (17) | 50 (16) | 8 (21) | 0.50 |
| Family history of CAD | 144 (41) | 133 (43) | 11 (28) | 0.07 |
| Obesity | 70 (20) | 63 (20) | 7 (18) | 0.74 |
| Agatston CAC score | 175 ± 478 | 114 ± 291 | 666 ± 1,059 | <0.001 |
| Variable | VC Volume | p Value |
|---|---|---|
| Diabetes mellitus | 0.18 | |
| + | 44.5 ± 394.1 | |
| 0 | 8.79 ± 78.6 | |
| Hypertension | 0.02 | |
| + | 45.6 ± 353.6 | |
| 0 | 1.8 ± 8.4 | |
| Hypercholesterolemia | 0.18 | |
| + | 35.9 ± 360.6 | |
| 0 | 10.2 ± 82.2 | |
| Smoker | 0.49 | |
| + | 21.8 ± 148.4 | |
| 0 | 18.9 ± 237.4 | |
| Family history of CAD | 0.07 | |
| + | 3.6 ± 25.1 | |
| 0 | 30.4 ± 291.7 | |
| Obesity | 0.65 | |
| + | 21.4 ± 137.6 | |
| 0 | 18.9 ± 242.0 | |
| Agatston CAC score | <0.001 | |
| >100 | 74.2 ± 445.4 | |
| ≤100 | 1.0 ± 8.1 |
Table 3 demonstrates the univariate and multivariate analysis for the association of classical cardiovascular risk factors with the presence of VC. Increasing age and Agatston CAC score were the only factors independently associated with the presence of VC.
| Variable | Univariate | Multivariate | ||||
|---|---|---|---|---|---|---|
| OR | 95% CI | p Value | OR | 95% CI | p Value | |
| Age (yrs) | 1.14 | 1.09–1.20 | <0.001 | 1.11 | 1.06–1.17 | <0.001 |
| Diabetes mellitus | 1.37 | 0.68–2.76 | 0.37 | |||
| Hypercholesterolemia | 1.66 | 0.85–3.25 | 0.14 | |||
| Hypertension | 2.10 | 1.07–4.12 | 0.03 | 1.01 | 0.46–2.21 | 0.98 |
| Family history of CAD | 0.52 | 0.25–1.08 | 0.08 | 0.68 | 0.30–1.53 | 0.35 |
| Smoking | 1.33 | 0.58–3.06 | 0.50 | |||
| Obesity | 0.87 | 0.37–2.05 | 0.74 | |||
| Agatston CAC score | 2.74 | 1.91–3.89 | <0.001 | 1.88 | 1.28–2.76 | 0.001 |
The median follow-up after the CCTA was 2.8 years (interquartile range 1.6 to 4.0) with a maximum of 5.5 years. During this follow-up period, the combined end point was observed in 56 patients (15%); 6 patients (1%) died, 11 (3%) suffered acute coronary syndrome, 32 (9%) underwent percutaneous coronary intervention, 4 (1%) underwent coronary artery bypass grafting, and 3 (1%) suffered a myocardial infarction during the follow-up period after CCTA. Event-free survival was significantly worse for patients with VC compared with those without VC (event rate 44% vs 12%, respectively, log-rank p <0.001; Figure 3 ). Patients with greater VC volume had worse event-free survival (event rate 12% for no-VC patients vs 33% for subgroup of patients with VC volume below the median value of 14 mm 3 [interquartile range 5 to 49] vs 56% for subgroup of patients with VC volume above this median, log-rank p <0.001; Figure 3 ). Focusing on the coronary event–free survival, patients with VC had statistically significant more coronary events than those without VC (coronary event rate 39% vs 11%, respectively, log-rank p <0.001; Figure 3 ). Focusing on all-cause mortality, the survival was significantly worse for those with versus those without VC (survival rate 92% vs 99%, respectively, log-rank p = 0.002; Figure 3 ).


