Lower cholesterol levels are associated with worse outcomes in patients with chronic heart failure (HF) and have been shown to predict in-hospital mortality. The relation between lipid profile and postdischarge outcomes in patients hospitalized for worsening HF is less clear. In this post hoc analysis of the Efficacy of Vasopressin Antagonism in Heart Failure Outcome Study With Tolvaptan (EVEREST), 3,957 patients hospitalized for worsening HF with ejection fractions ≤40% were examined. Baseline total cholesterol and triglyceride levels were measured <48 hours after admission and evaluated as continuous variables. The primary end points of all-cause mortality and cardiovascular mortality or hospitalization for HF were compared using Cox regression models. Patient characteristics at randomization were also compared among quartiles of total cholesterol. Patients with lower total cholesterol tended to have lower blood pressure, ejection fractions, serum sodium, and albumin, and were more likely to have worse HF functional class, to have higher natriuretic peptide levels, and to have histories of diabetes mellitus, renal insufficiency, and coronary revascularization (all p values <0.001). After adjustment for baseline clinical risk factors, total cholesterol was predictive of all-cause mortality (hazard ratio 0.73, 95% confidence interval 0.63 to 0.85, p <0.001) and cardiovascular mortality or hospitalization for HF (hazard ratio 0.73, 95% confidence interval 0.66 to 0.82, p <0.001) at median follow-up of 9.9 months. Lower baseline triglyceride level was also associated with worse outcomes. In conclusion, lower baseline total cholesterol is correlated with a high-risk patient profile and is a marker of disease severity in patients hospitalized for worsening HF with reduced ejection fraction. Baseline total cholesterol and triglyceride levels are predictive of mortality and HF rehospitalization beyond traditional risk factors.
The reciprocal association between traditional cardiovascular risk factors, including hyperlipidemia, and poor clinical outcomes in heart failure (HF) has been referred to as “reverse epidemiology.” The mechanism underlying this “cholesterol paradox” is presently unclear, but leading hypotheses include relations with persistent malnutrition and inflammation frequently seen in chronic disease states. The Efficacy of Vasopressin Antagonism in Heart Failure Outcome Study With Tolvaptan (EVEREST) database contains a number of clinically important covariates, including markers of nutrition (i.e., albumin and body mass index), and offers the opportunity to better characterize the prognostic value of baseline serum cholesterol levels on postdischarge outcomes in a large population of patients hospitalized for HF. Specifically, the objectives of the present analysis were (1) to report the distribution of total cholesterol and triglycerides, (2) to describe the baseline clinical characteristics by total cholesterol level, and (3) to assess the association between total cholesterol and triglyceride levels and postdischarge morbidity and mortality in patients hospitalized for HF with reduced ejection fraction (EF).
Methods
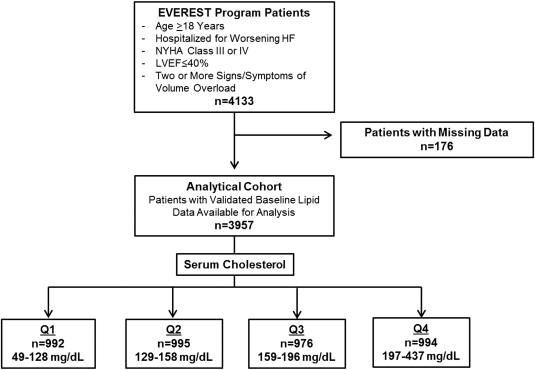
The overall study design and primary results of the EVEREST program have been described in detail previously. In brief, EVEREST was a prospective, multicenter, multinational, randomized, double-blind, placebo-controlled clinical trial investigating the role of oral tolvaptan, a vasopressin-2 receptor antagonist, on short- and long-term clinical outcomes. Notably, patients were enrolled <48 hours after admission at 359 clinical sites from North America, South America, and Europe from 2003 to 2006. Patients aged >18 years who were hospitalized for worsening HF with EF ≤40% and New York Heart Association (NYHA) class III or IV functional status presenting with ≥2 signs or symptoms of fluid overload (i.e., dyspnea, pitting edema, and jugular venous distension) were eligible for enrollment. Exclusion criteria relevant for the present study included acute myocardial infarction at the time of presentation or co-morbid conditions with expected survival <6 months.
Patients provided explicit written informed consent for participation that was approved by local institutional review boards or ethics committees. Background HF therapy was left to the discretion of the treating physician, but guideline-based recommendations for optimal medical management were included in the study protocol.
In EVEREST, lipid parameters including total cholesterol and triglycerides were collected at enrollment; a complete lipid panel was not included in the study protocol. These samples were not required to be fasting. Laboratory samples were centrally analyzed at 5 core facilities, and results were cross-validated across centers. Patients with missing baseline lipid parameters (either total cholesterol or triglycerides) were excluded from this analysis (n = 176).
The primary predictors of the present study were serum total cholesterol and triglyceride levels, expressed as continuous variables. Because triglyceride data were positively skewed, natural logarithmic transformation was performed for this variable. Additionally, the effect of triglycerides on the composite end point was not linear, and thus the data were modeled utilizing triglyceride quartiles, with results reported as comparisons between adjacent quartiles, with risk in the lower quartile compared with risk in the higher quartile. For descriptive purposes, baseline characteristics and end point analyses are also presented by quartiles of baseline serum total cholesterol. Total cholesterol was selected because it was considered more reliable than triglyceride level in the setting of nonfasting samples. Demographic characteristics, clinical characteristics, vital signs, other laboratory and diagnostic testing, and enrollment medication use were compared across baseline serum total cholesterol quartiles. Lipid-lowering agents were divided into statin and nonstatin subgroups for the purposes of this analysis. Fewer than 5% of patients enrolled in EVEREST (n = 194) were taking nonstatin lipid-lowering agents, and their use was not analyzed in this study. Statins used at baseline included atorvastatin, fluvastatin, lovastatin, pravastatin, rosuvastatin, and simvastatin. Figure 1 provides an overview of the patient selection for this post hoc analysis.
An independent, blinded clinical events committee adjudicated specific causes of death, hospitalization and unscheduled outpatient visits. All-cause mortality and the composite of cardiovascular mortality and hospitalization for HF, the 2 prespecified EVEREST primary co–end points, were also selected for the present study. End points were analyzed as time to first event. Secondary end points included cardiovascular mortality, worsening HF (defined as death, rehospitalization, or unplanned outpatient visitation), HF rehospitalization, and a composite of cardiovascular mortality and cardiovascular-related hospitalizations. The median follow-up duration was 9.9 months in EVEREST.
Categorical variables are reported as number (percentage), while continuous variables are expressed as mean ± SD if normally distributed or as median (interquartile range) if not normally distributed. Baseline characteristics across total cholesterol quartiles were compared using 1-way analysis of variance, Kruskal-Wallis tests, and chi-square tests, as appropriate.
Univariate and multivariate Cox proportional-hazards models were used to calculate hazard ratios (HRs) and 95% confidence intervals (CIs) for each of the primary predictor variables (as continuous variables). The linearity and proportional-hazards assumptions were tested for the 2 primary end points using Kolmogorov-type supremum tests. Departures from proportional hazards were modeled by introducing time-dependent changes for the effects of the primary predictor in the model. Kaplan-Meier curves were constructed for total cholesterol and triglyceride quartiles, and time to first event was compared using log-rank tests.
Twenty-six preselected baseline covariates were included in final multivariate models: tolvaptan assignment, age, gender, region of origin, EF, B-type natriuretic peptide, N-terminal pro–B-type natriuretic peptide, serum sodium, blood urea nitrogen, systolic blood pressure, QRS duration on enrollment electrocardiogram, NYHA functional class IV, ischemic cause of HF, serum albumin level, body mass index, baseline co-morbidities (self-reported history of diabetes mellitus, renal insufficiency, hypertension, coronary artery disease [CAD], atrial fibrillation on baseline electrocardiogram), baseline medication use (angiotensin-converting enzyme inhibitors or angiotensin II receptor blockers, β blockers, mineralocorticoid receptor antagonists, digoxin, intravenous inotropes, and statins) and significant interactions. Multicollinearity between primary predictors and control variables did not significantly threaten the results of the multivariate models (tolerance 0.68, variance inflation factor 1.46). Multiple imputation procedure (fully conditional specification methods as implemented in the MI and MIANALYZE procedures in SAS; SAS Institute Inc., Cary, North Carolina) was used for missing covariate data (<5% for all variables).
Prespecified interaction analyses were performed between lipids and (1) tolvaptan assignment, (2) baseline statin therapy, (3) ischemic cause of HF, and (4) history of CAD. All statistical analyses were performed using SAS version 9.3, and p values <0.05 were considered to be statistically significant.
Results
Patients with missing baseline total cholesterol or triglyceride data (n = 176) were excluded from the primary analysis. In the remaining analytic cohort (n = 3,957), total cholesterol was approximately normally distributed, with a mean of 166 ± 51 mg/dl and a median of 158 mg/dl (interquartile range 128 to 197) ( Figure 2 ). Triglyceride levels were positively skewed, and the variable was natural logarithmically transformed for analytic purposes; the median of the original distribution was 110 mg/dl (interquartile range 83 to 155) ( Figure 2 ). Table 1 lists the baseline characteristics of all patients with available lipid data at the time of enrollment stratified by total cholesterol quartiles. Patients with lower baseline total cholesterol tended to have lower blood pressure, EF, serum sodium, and albumin; higher natriuretic peptide and serum creatinine levels; and wider QRS intervals on electrocardiogram (all p values <0.001). They were more likely to have NYHA class IV HF, to receive angiotensin-converting enzyme inhibitors or angiotensin II receptor blockers and statins, and to have histories of diabetes mellitus, chronic kidney disease, and coronary revascularization (all p values <0.001). Table 2 lists causes of death and rehospitalization by baseline total cholesterol quartile.
| Variable | Quartile of Total Cholesterol (mg/dl) | p Value | |||
|---|---|---|---|---|---|
| 1 (49–128) (n = 992) | 2 (129–158) (n = 995) | 3 (159–196) (n = 976) | 4 (197–437) (n = 994) | ||
| Total cholesterol (mg/dl) | 108.7 ± 14.7 | 143.7 ± 8.7 | 176.3 ± 10.8 | 235.7 ± 36.0 | — |
| Triglycerides (mg/dl) | 94.8 (39.7%) | 111.4 (53.0%) | 136.4 (72.4%) | 196.8 (129.2%) | <0.001 |
| Tolvaptan | 505 (50.9%) | 489 (49.1%) | 505 (51.7%) | 478 (48.1%) | 0.354 |
| Age (yrs) | 66.5 ± 12.7 | 66.0 ± 11.8 | 66.7 ± 11.3 | 63.9 ± 11.5 | <0.001 |
| Men | 809 (81.6%) | 765 (76.9%) | 700 (71.7%) | 672 (67.6%) | <0.001 |
| Ischemic cause of HF | 655 (66.8%) | 638 (65.2%) | 626 (65.0%) | 650 (66.1%) | 0.834 |
| Region of origin | <0.001 | ||||
| Eastern Europe | 201 (20.3%) | 338 (34.0%) | 452 (46.3%) | 582 (58.6%) | |
| North America | 494 (49.8%) | 319 (32.1%) | 223 (22.9%) | 150 (15.1%) | |
| South America | 160 (16.1%) | 204 (20.5%) | 167 (17.1%) | 145 (14.6%) | |
| Western Europe | 137 (13.8%) | 134 (13.5%) | 134 (13.7%) | 117 (11.8%) | |
| Body mass index (kg/m 2 ) | 28.7 ± 5.8 | 28.2 ± 5.6 | 28.4 ± 5.7 | 29.3 ± 5.3 | <0.001 |
| Systolic blood pressure (mm Hg) | 114.6 ± 18.2 | 118.5 ± 19.2 | 123.3 ± 19.9 | 125.6 ± 19.7 | <0.001 |
| Diastolic blood pressure (mm Hg) | 68.7 ± 12.2 | 71.5 ± 12.8 | 74.2 ± 12.2 | 76.3 ± 12.3 | <0.001 |
| Dyspnea | 875 (90.3%) | 885 (90.4%) | 886 (92.1%) | 900 (91.6%) | 0.424 |
| Jugular venous distention ≥10 cm | 345 (35.9%) | 315 (32.3%) | 209 (21.9%) | 172 (17.6%) | <0.001 |
| Rales | 786 (80.8%) | 789 (80.6%) | 794 (82.5%) | 802 (81.5%) | 0.686 |
| Peripheral edema ∗ | 830 (85.2%) | 778 (79.4%) | 765 (79.5%) | 745 (75.7%) | <0.001 |
| Ejection fraction (%) | 25.6 ± 8.1 | 26.8 ± 8.3 | 28.5 ± 7.8 | 29.3 ± 7.6 | <0.001 |
| Blood urea nitrogen (mg/dl) | 30 (22–43) | 27 (21–38) | 24 (19–33) | 23 (18–30) | <0.001 |
| Creatinine (mg/dl) | 1.4 (1.1–1.8) | 1.3 (1.0–1.6) | 1.2 (1.0–1.5) | 1.2 (1.0–1.4) | <0.001 |
| Serum sodium (mEq/L) | 139 (136–141) | 140 (137–142) | 140 (138–143) | 141 (138–143) | <0.001 |
| B-type natriuretic peptide (pg/ml) † | 1,202 (627–216) | 898 (410–1,727) | 592 (261–1,252) | 348 (162–768) | <0.001 |
| N-terminal pro–B-type natriuretic peptide (pg/ml) ‡ | 6,377 (3,540–12,888) | 5,703 (2,761–11,197) | 4,839 (2,180–9,570) | 2,148 (949–4,281) | <0.001 |
| QRS duration on baseline electrocardiogram (ms) | 126 (102–156) | 124 (98–153) | 121 (96–147) | 120 (95–142) | <0.001 |
| Atrial fibrillation on baseline electrocardiogram | 291 (29.3%) | 311 (31.3%) | 299 (30.7%) | 233 (23.5%) | <0.001 |
| Albumin (g/dl) | 3.5 (3.2–3.8) | 3.7 (3.3–4.0) | 3.8 (3.5–4.2) | 4.1 (3.8–4.3) | <0.001 |
| New York Heart Association class IV | 459 (46.4%) | 420 (42.3%) | 374 (38.3%) | 311 (31.3%) | <0.001 |
| Previous HF hospitalization | 805 (81.4%) | 779 (78.5%) | 761 (78.5%) | 776 (78.3%) | 0.272 |
| Previous CAD | 718 (72.5%) | 689 (69.2%) | 691 (70.9%) | 690 (69.4%) | 0.343 |
| Previous myocardial infarction | 555 (55.9%) | 490 (49.2%) | 476 (48.9%) | 481 (48.4%) | 0.002 |
| Hypertension | 691 (69.7%) | 692 (69.5%) | 700 (71.7%) | 726 (73.0%) | 0.247 |
| Hypercholesterolemia § | 543 (54.8%) | 420 (42.5%) | 411 (42.4%) | 539 (54.5%) | <0.001 |
| Diabetes mellitus | 465 (46.9%) | 390 (39.2%) | 343 (35.1%) | 333 (33.5%) | <0.001 |
| Chronic kidney disease | 400 (40.4%) | 285 (28.6%) | 211 (21.6%) | 157 (15.8%) | <0.001 |
| Peripheral vascular disease | 214 (21.6%) | 221 (22.3%) | 200 (20.5%) | 194 (19.5%) | 0.455 |
| Previous coronary artery bypass | 333 (33.6%) | 222 (22.3%) | 150 (15.4%) | 124 (12.5%) | <0.001 |
| Previous percutaneous coronary intervention | 248 (25%) | 196 (19.7%) | 138 (14.1%) | 118 (11.9%) | <0.001 |
| Chronic obstructive pulmonary disease | 126 (12.7%) | 99 (9.9%) | 86 (8.8%) | 85 (8.6%) | 0.008 |
| Baseline medication use | |||||
| Diuretics | 964 (97.3%) | 964 (97.2%) | 948 (97.5%) | 971 (97.7%) | 0.887 |
| Angiotensin-converting enzyme inhibitors or angiotensin II receptor blockers | 799 (80.6%) | 845 (85.2%) | 822 (84.6%) | 873 (87.9%) | <0.001 |
| β blockers | 735 (74.2%) | 696 (70.2%) | 666 (68.5%) | 698 (70.2%) | 0.041 |
| Mineralocorticoid receptor antagonists | 511 (51.6%) | 533 (53.7%) | 545 (56.1%) | 562 (56.5%) | 0.097 |
| Digoxin | 473 (47.7%) | 526 (53.0%) | 476 (49.0%) | 443 (44.6%) | 0.002 |
| Intravenous inotropes | 72 (7.3%) | 51 (5.1%) | 27 (2.8%) | 30 (3.0%) | <0.001 |
| Statins | 479 (48.3%) | 337 (34.0%) | 300 (30.9%) | 254 (25.6%) | <0.001 |
∗ Slight, moderate, or marked pedal or sacral edema.
† Data available for 681, 707, 709, and 749 patients in quartiles 1 to 4, respectively.
‡ Data available for 387, 362, 334, and 300 patients in quartiles 1 to 4, respectively.
| Outcome | Quartile of Total Cholesterol (mg/dl) | p Value | |||
|---|---|---|---|---|---|
| 1 (49–128) (n = 992) | 2 (129–158) (n = 995) | 3 (159–196) (n = 976) | 4 (197–437) (n = 994) | ||
| All-cause mortality | 385 (38.8%) | 290 (29.1%) | 219 (22.4%) | 147 (14.8%) | <0.001 |
| Cardiovascular mortality or HF hospitalization | 533 (53.7%) | 454 (45.6%) | 372 (38.1%) | 270 (27.2%) | <0.001 |
| Cardiovascular mortality | 298 (30.0%) | 217 (21.8%) | 168 (17.2%) | 119 (12.0%) | <0.001 |
| Cardiovascular mortality or cardiovascular hospitalization | 594 (59.9%) | 506 (50.9%) | 434 (44.5%) | 348 (35.0%) | <0.001 |
| Worsening HF ∗ | 481 (48.5%) | 399 (40.1%) | 317 (32.5%) | 236 (23.7%) | <0.001 |
| HF mortality | 187 (18.9%) | 118 (11.9%) | 78 (8.0%) | 49 (4.9%) | <0.001 |
| HF hospitalization | 346 (34.9%) | 307 (30.9%) | 256 (26.2%) | 190 (19.1%) | <0.001 |
| Myocardial infarction mortality | 5 (0.5%) | 8 (0.8%) | 6 (0.6%) | 8 (0.8%) | 0.809 |
| Myocardial infarction hospitalization | 9 (0.9%) | 12 (1.2%) | 10 (1.0%) | 11 (1.1%) | 0.929 |
| Stroke mortality | 5 (0.5%) | 6 (0.6%) | 8 (0.8%) | 4 (0.4%) | 0.655 |
| Stroke hospitalization | 11 (1.1%) | 10 (1.0%) | 12 (1.2%) | 16 (1.6%) | 0.637 |
Stay updated, free articles. Join our Telegram channel

Full access? Get Clinical Tree


