Principles of Mechanical Ventilation
The historical evolution of mechanical ventilation is rich and built on advances in many fields, including endeavors by anatomists, chemists, explorers, physiologists, and clinicians.1 In 1543, Vesalius demonstrated that positive-pressure ventilation could be used to resuscitate a dying animal. Bellows ventilation was advocated by various lay bodies in the resuscitation of near-drowning victims late in the 18th century. In 1827, however, Leroy demonstrated that overzealous bellows inflation could result in pneumothoraces. Official bodies condemned the technique, and, thus, early in its infancy, positive-pressure ventilation was banned from use. Around this time, negative-pressure ventilators were developed and later popularized as a panacea for a wide variety of ailments.
The modern era of mechanical ventilation was ushered in by Bjorn Ibsen in response to epidemic of bulbar poliomyelitis in Copenhagen in 1952. In the first 3 weeks of the epidemic, 31 patients had been treated with negative-pressure respirators, and 27 had died. Ibsen advised immediate tracheostomy and the use of positive-pressure ventilation with manual positive pressure from a rubber bag, as was then customary in the operating room. Hundreds of medical students worked in relays, delivering bag ventilation during the epidemic; shortly thereafter, machines were introduced to deliver positive-pressure ventilation. Over the following 40 years, ventilators changed enormously in appearance, becoming more sophisticated and versatile and having enhanced capabilities for monitoring and alarming.
OBJECTIVES AND INDICATIONS FOR MECHANICAL VENTILATION
The objectives of mechanical ventilation are listed in Table 148-1.2 In isolation, hypoxemia of mild-to-moderate severity can be managed by administration of oxygen (O2) through a face mask. With more severe hypoxemia secondary to shunt or ventilation–perfusion ![]() mismatching, it is difficult to guarantee the delivery of a high fractional inspired oxygen concentration (FIO2) through a face mask. Moreover, these patients are commonly in considerable distress. Thus, intubation helps by ensuring delivery of the required FIO2, and positive-pressure ventilation helps by recruiting collapsed lung units, leading to improved matching of ventilation and perfusion.
mismatching, it is difficult to guarantee the delivery of a high fractional inspired oxygen concentration (FIO2) through a face mask. Moreover, these patients are commonly in considerable distress. Thus, intubation helps by ensuring delivery of the required FIO2, and positive-pressure ventilation helps by recruiting collapsed lung units, leading to improved matching of ventilation and perfusion.
Source: Reproduced with permission from Tobin MJ. Mechanical ventilation. N Engl J Med. 1994;330(15):1056–1061.
Acute progressive respiratory acidosis is a major indication for mechanical ventilation, although simpler measures can sometimes reverse the process.3 For example, among patients with acute severe asthma and hypercapnia, hypercapnia resolves with standard bronchodilator therapy, without the need for mechanical ventilation, in more than 90% of patients.4 If a patient has severe respiratory depression that is expected to be slow in resolving (e.g., certain drug overdoses), intubation and mechanical ventilation should be instituted without delay.
A substantial proportion of patients who require (and benefit from) mechanical ventilation have relatively normal arterial blood gases but have clinical signs of increased work of breathing: nasal flaring; vigorous activity of the sternomastoid muscles; tracheal tug; recession of the suprasternal, supraclavicular, and intercostal spaces; paradoxical motion of the abdomen; and pulsus paradoxus. This picture of a patient “tiring out” is the most common reason for instituting mechanical ventilation. The increase in work of breathing may be the result of increased airway resistance, increased stiffness of the lungs or chest wall, or the presence of a threshold inspiratory load secondary to auto- or intrinsic positive end-expiratory pressure (PEEPi).
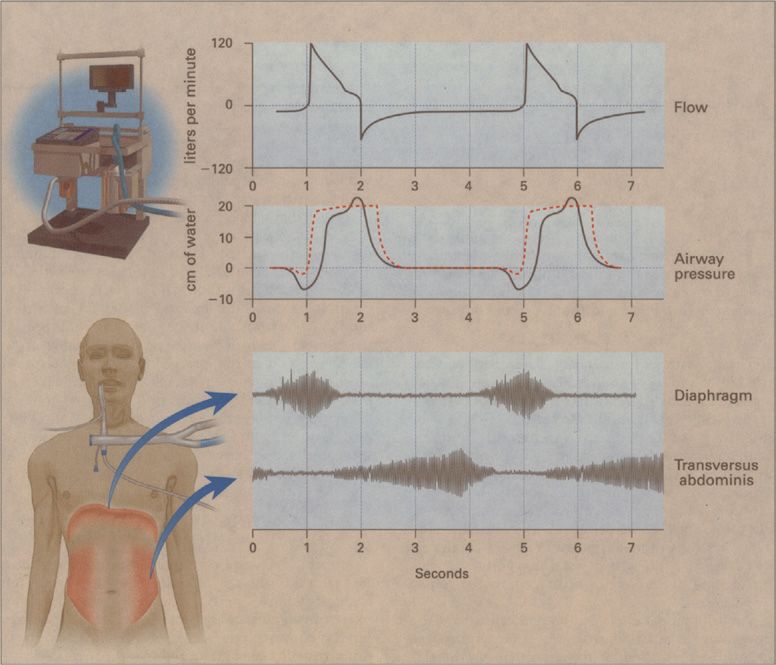
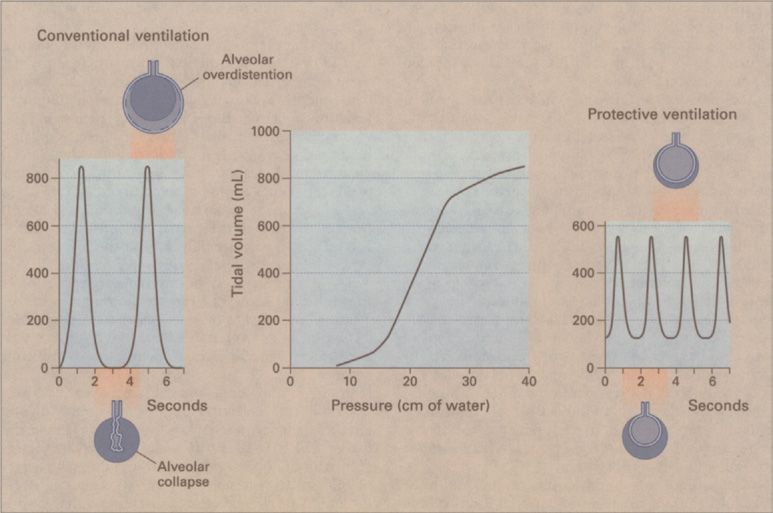
Increased respiratory work increases the O2 cost of breathing to as much as 50% of total O2 consumption.5 By decreasing respiratory work, mechanical ventilation allows precious O2 stores to be rerouted to other vulnerable tissue beds. To substantially reduce patient effort, the ventilator must cycle in unison with the patient’s central respiratory rhythm (Fig. 148-1). For perfect synchronization, the period of mechanical inflation must match the period of neural inspiratory time (the duration of inspiratory effort), and the period of mechanical inactivity must match the neural expiratory time.6 Work of breathing is increased in patients with atelectasis or acute lung injury because breathing occurs on the low, flat portion of the pressure–volume curve. By shifting tidal ventilation to the steep, compliant portion of the curve, mechanical ventilation can decrease respiratory work.
Figure 148-1 Flow, airway pressure, and inspiratory and expiratory muscle activity in a patient with chronic obstructive pulmonary disease who received pressure-support ventilation at an airway pressure of 20 cm H2O. The electromyograms in the lower portion of the figure show inspiratory muscle activity in the patient’s diaphragm and expiratory muscle activity in the transversus abdominis. The patient’s increased inspiratory effort caused the airway pressure to fall below the set sensitivity (–2 cm H2O), and inadequate delivery of flow by the ventilator resulted in a scooped contour on the airway–pressure curve during inspiration. While the ventilator was still pumping gas into the patient, his expiratory muscles were recruited, causing a bump in the airway–pressure curve. That the flow never returned to zero throughout expiration reflected the presence of PEEPi. The broken red line shows airway pressure in another patient, who generated just enough effort to trigger the ventilator and in whom there was adequate delivery of gas by the ventilator. (Data are from Jubran A, Van de Graaff WB, Tobin MJ. Variability of patient-ventilator interaction with pressure support ventilation in patients with chronic obstructive pulmonary disease. Am J Respir Crit Care Med. 1995;152:129–136; Parthasarathy S, Jubran A, Tobin MJ. Cycling of inspiratory and expiratory muscle groups with the ventilator in airflow limitation. Am J Respir Crit Care Med. 1998;158:1471–1478. Reproduced with permission from Tobin MJ. Advances in mechanical ventilation. N Engl J Med. 2001;344: 1986–1996.)
Commonly listed indications for mechanical ventilation include acute respiratory failure, exacerbation of chronic respiratory failure (e.g., secondary to infection, bronchoconstriction, or heart failure), coma, and neuromuscular disease. Many patients with these same conditions, however, do not require ventilator assistance. Indeed, the most common, and honest, reason that mechanical ventilation is instituted is a tautology: A physician thinks that “the patient looks like he (or she) needs to be placed on the ventilator.”7 Mechanical ventilation is most commonly instituted based on a physician’s clinical gestalt, formed through assessing a patient’s signs and symptoms, rather than because a patient satisfies a certain set of criteria on a checklist. It is important to ground this decision on solid knowledge of pulmonary pathophysiology.
MODES OF MECHANICAL VENTILATION
The term mode refers to the relationship among various breath types (mandatory, assisted, supported, and spontaneous), as well as inspiratory phase variables.
 CONTROLLED MECHANICAL VENTILATION
In controlled mechanical ventilation, the ventilator delivers all breaths at a preset rate, and the patient cannot trigger the machine. In the volume-targeted mode, the breaths have a preset volume—the so-called volume-controlled ventilation. When the breaths are pressure limited and time cycled, the mode is termed pressure-controlled ventilation. Use of volume-controlled ventilation is largely restricted to patients who are apneic as a result of brain damage, sedation, or paralysis.
 ASSIST–CONTROL VENTILATION
In the assist–control mode, the ventilator delivers a breath either when triggered by the patient’s inspiratory effort (pressure or flow triggered) or, independently, if such an effort does not occur within a preselected time period.8 All breaths are delivered under positive pressure by the machine, but unlike controlled mechanical ventilation, the patient’s triggering effort can exceed the preset rate. If the patient’s spontaneous rate drops below the preset back-up rate, controlled ventilation is provided. The breath delivered by the ventilator may have a predetermined volume (volume-cycled form of assist–control ventilation) or a predetermined inflation pressure that is applied for a predetermined inflation time (pressure control form of assist–control ventilation). By design, delivered tidal volume is not influenced by patient effort. The greater the inspiratory effort made by the patient, the lower will be the airway pressure during the volume-cycled form of assist–control ventilation, such that the overall airway pressure on the ventilator monitor bears an inverse relationship to patient-generated pressure.
The ventilator cycles off when the preset tidal volume is reached, and machine inspiratory time may be shorter or longer than the patient’s intrinsic (neural) inspiratory time.6 If the set tidal volume is reached before the end of neural inspiratory time, the machine cycles off while the patient’s inspiratory effort continues. If the patient’s inspiratory effort ceases before the set tidal volume is reached, the machine increases pressure to provide continued inspiratory flow. The amount of active work performed by a patient ventilated in the assist–control mode is critically dependent on the trigger sensitivity and inspiratory flow settings. Even when these settings are selected appropriately, patients actively perform about one-third of the work performed by the ventilator during passive conditions.9
 INTERMITTENT MANDATORY VENTILATION
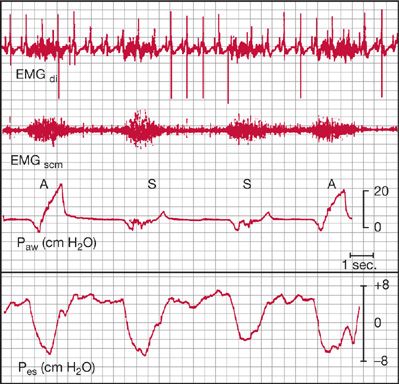
With intermittent mandatory ventilation (IMV), the patient receives periodic positive-pressure breaths from the ventilator at a preset volume and rate, but the patient can also breathe spontaneously between these mandatory breaths.10 A problem unforeseen at the time IMV was introduced is the difficulty that patients encounter in trying to adapt to the intermittent nature of ventilator assistance. It had been assumed that the degree of respiratory muscle rest achieved by IMV would be proportional to the number of mandatory breaths delivered. Studies, however, have demonstrated that inspiratory effort is equivalent for spontaneous and assisted breaths during IMV (Fig. 148-2).11,12 Indeed, the tension-time index for both spontaneous and assisted breaths is above the threshold associated with respiratory muscle fatigue at IMV rates of 14 breaths/min or less.11 At a moderate level of machine assistance (at which the ventilator accounts for 20% to 50% of total ventilation), electromyographic activity of the diaphragm and sternocleidomastoid muscles is equivalent for assisted and spontaneous breaths.12 These findings suggest that respiratory center output is preprogrammed and does not adjust to breath-to-breath changes in load, as occurs during IMV. As a result, IMV may contribute to development of respiratory muscle fatigue or prevent its recovery.
Figure 148-2 Electromyograms of the diaphragm (EMGdi) and sternocleidomastoid muscles (EMGscm) in a patient receiving synchronized intermittent mandatory ventilation. Similar intensity and duration of electrical activity during assisted (A) and spontaneous (S) cycles are demonstrated. Paw, airway pressure; Pes, esophageal pressure. (Reproduced with permission from Imsand C, Feihl F, Perret C, et al. Regulation of inspiratory neuromuscular output during synchronized intermittent mechanical ventilation. Anesthesiology. 1994;80(1):13–22.)
 PRESSURE-SUPPORT VENTILATION
Pressure-support ventilation is patient triggered, like assist–control ventilation and IMV, but it differs in that it is pressure targeted and flow cycled.13 The physician sets a level of pressure that augments every spontaneous effort, and the patient may alter respiratory frequency, inspiratory time, and tidal volume. Tidal volume is determined by the pressure setting, the patient’s effort, and pulmonary mechanics, in contrast to assist–control ventilation and IMV, in which a guaranteed volume is delivered. With volume-targeted ventilation, the inspiratory flow setting is a crucial determinant of patient work. There is no flow setting with pressure-support ventilation, although the initial peak flow determines the speed of pressurization and the initial pressure ramp profile.
Pressure support can be very effective in decreasing the work of inspiration. The degree of inspiratory muscle unloading, however, is variable, with a coefficient of variation of up to 96% among patients.14 The level of pressure delivered by the ventilator is usually adjusted in accordance with changes in the patient’s respiratory frequency. The frequency, however, which signals a satisfactory level of respiratory muscle rest has never been well defined, and recommendations range from 16 to 30 breaths/min.14
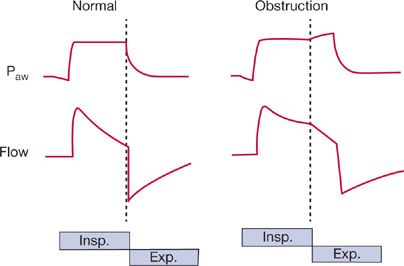
Cycling to exhalation is triggered by a decrease in inspiratory flow to a preset level, such as 5 L/min or 25% of peak inspiratory flow, depending on the manufacturer’s algorithm (Fig. 148-3). The algorithm for “cycling-off” of mechanical inflation causes problems in patients with COPD, because increases in resistance and compliance produce a slow time constant (of the respiratory system). The longer time needed for flow to fall to the threshold value may cause mechanical inflation to persist into neural expiration. In 12 patients with COPD receiving pressure support of 20 cm H2O, Jubran et al.14 found that 5 recruited their expiratory muscles while the machine was still inflating the thorax. The patients who recruited their expiratory muscles during mechanical inflation had an average time constant of 0.54 seconds, as compared with an average of 0.38 seconds in patients who did not exhibit expiratory muscle activity. The persistence of mechanical inflation into neural expiration is very uncomfortable, as well recognized with use of inverse-ratio ventilation (where, contrary to the normal pattern, inflation lasts longer than exhalation).
Figure 148-3 Airway pressure (Paw) and inspiratory (Insp) and expiratory (Exp) flow during pressure-support ventilation in patients with normal and obstructed airways. Patient effort triggers the ventilator to deliver a preset pressure, and inspiratory assistance continues until the flow rate falls to 25% of the peak inspiratory flow. In patients with airway obstruction, who have a prolonged time constant, more time is required for flow to decrease to this threshold value, so that neural expiration commences before the termination of mechanical inflation. The resulting activation of the expiratory muscles hastens the fall in flow, but it also results in dyssynchrony between the patient’s neuromuscular activity and the mechanical phase of the ventilator—so-called “fighting the ventilator.”
 NEW MODES
New modes of mechanical ventilation are frequently introduced. Each has an acronym, and the jargon is inhibiting to those unfamiliar with it. Yet each new mode involves nothing more than a modification of the manner in which positive pressure is delivered to the airway and of the interplay between mechanical assistance and the patient’s respiratory effort.15 The purpose of a new mode may be to enhance respiratory muscle rest, prevent deconditioning, improve gas exchange, prevent lung damage, enhance coordination between ventilator assistance and patient respiratory effort, and foster lung healing; the priority given to each goal varies.
VENTILATOR SETTINGS
Ventilator settings are based on the patient’s size and clinical condition. Determination of the settings is a dynamic process, based on a patient’s physiologic response, rather than on a fixed set of numbers.16 The settings require repeated readjustment over the period of ventilator dependency. Such an iterative process requires careful respiratory monitoring.
 TRIGGERING
Many ventilators employ pressure triggering, whereby a decrease in circuit pressure is required to initiate ventilator assistance. Patients reach the set sensitivity by activating their inspiratory muscles. When the threshold is reached, however, inspiratory neurons do not simply switch off.6 Consequently, the patient may expend considerable inspiratory effort throughout a machine-cycled inflation. The level of patient effort during this post-trigger phase is closely related to a patient’s respiratory motor output at the point of triggering.17 As such, measures that decrease respiratory drive may enhance respiratory muscle rest during mechanical ventilation.
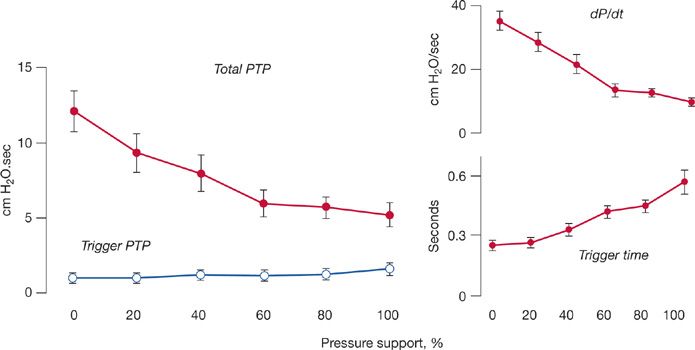
If respiratory motor output at the point of triggering is important, one might expect that effort during the time of triggering would determine patient effort during the remainder of inspiration. To elucidate this issue, Leung et al.17 applied graded levels of pressure support in 11 critically ill patients. They achieved a fourfold reduction in overall patient effort. Yet patient effort during the time of triggering did not change. The constancy of effort during the trigger phase was probably secondary to different factors becoming operational as the level of ventilator assistance was varied (Fig. 148-4). Thus, increases in the level of ventilator assistance do not substantially decrease patient effort during the time of triggering.
Figure 148-4 Graded increases in pressure support produced a decrease in total pressure–time product (PTP) per breath (closed symbols), although PTP during the trigger phase (open symbols) did not change (left panel). The constancy of PTP during triggering probably resulted from different factors becoming operational at different levels of assistance (right panel). At low levels of pressure support, respiratory drive (dP/dt) and PEEPi were high, but triggering time was short, resulting in a large change in pleural pressure over a brief interval. At high levels of pressure support, dP/dt and PEEPi were low, but triggering time was long, resulting in a smaller change in pleural pressure over a longer time. (Data from Leung P, Jubran A, Tobin MJ. Comparison of assisted ventilator modes on triggering, patient effort, and dyspnea. Am J Respir Crit Care Med. 1997;155:1940–1948; Tobin MJ, Jubran A, Laghi F. Patient-ventilator interaction. Am J Respir Crit Care Med. 2001;163:1059–1063.)
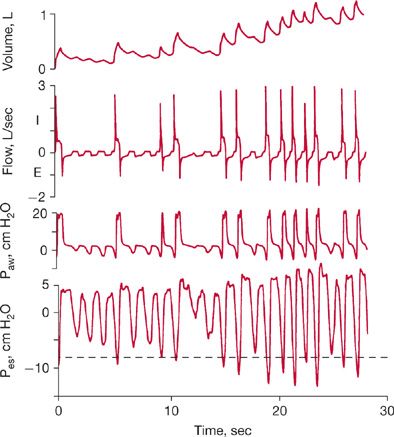
The display of airway pressure and flow tracings on ventilator screens has increased awareness that inspiratory effort is frequently insufficient to trigger the ventilator.6,15 At high levels of mechanical assistance, up to one-third of a patient’s inspiratory efforts may fail to trigger the machine (Fig. 148-5). The number of ineffective triggering attempts increases in direct proportion to the level of ventilator assistance. Surprisingly, unsuccessful triggering is not the result of poor inspiratory effort. In a study of factors contributing to ineffective triggering, effort was noted to be more than one-third greater when the threshold for triggering the ventilator was not reached than when it was.17 Breaths that do not reach the threshold for triggering the ventilator have higher tidal volumes and shorter expiratory times than do breaths that do trigger the ventilator. Consequently, elastic recoil pressure builds up within the thorax in the form of PEEPi. To trigger the ventilator, the patient’s inspiratory effort has to first generate a negative intrathoracic pressure in order to counterbalance the elastic recoil; it then must reach the set sensitivity.
Figure 148-5 Recordings of tidal volume, inspiratory (I) and expiratory (E) flow, airway pressure (Paw), and esophageal pressure (Pes) in a patient with COPD receiving pressure-support ventilation. Approximately half of the patient’s inspiratory efforts do not succeed in triggering the ventilator. Triggering occurs only when the patient generates Pes more negative than –8 cm H2O (indicated by the interrupted horizontal line), a pressure equal in magnitude to the opposing elastic recoil pressure. Expiratory flow exhibits a biphasic pattern, with momentary braking signaling ineffective inspiratory effort. Thus, monitoring of expiratory flow provides a more accurate measurement of the patient’s intrinsic respiratory rate than does the number of machine cycles displayed on the bedside monitor. (Reproduced with permission from Tobin MJ, Jubran A. Pathophysiology of failure to wean from mechanical ventilation. Schweiz Med Wochenschr. 1994;124:2138–2145.)
The time at which a patient initiates an expiratory effort (in relation to the cycling of the ventilator) partly determines the success of the ensuing inspiratory effort in triggering the machine. The relationship between the onset of expiratory muscle activity and termination of mechanical inflation by the ventilator has been quantified.18 At a pressure support of 20 cm H2O, mechanical inflation continues for a longer time into neural expiration in the breaths preceding nontriggering attempts. Continuation of mechanical inflation into neural expiration counters expiratory flow, and also decreases the time available for unopposed exhalation. Consequently, elastic recoil increases. In turn, a greater inspiratory effort will be needed to achieve effective triggering. In this way, the time at which a patient commences an expiratory effort (in relation to cycling-off of mechanical inflation) partly determines the success of the ensuing inspiratory effort in triggering the ventilator.
 TIDAL VOLUME
In the past, the standard setting for tidal volume was 10 to 15 mL/kg; moreover, every effort was made to ensure that PaCO2 did not rise above the normal range. This thinking was overturned by a revolutionary study published in 1984 by Darioli and Perret.19 Analyzing a retrospective dataset collected in patients with status asthmaticus receiving mechanical ventilation, they found that use of lower tidal volumes, with inevitable increase in PaCO2, resulted in better survival. A few years later, Hickling et al.20 applied a similar approach in patients with the acute respiratory distress syndrome (ARDS). A retrospective dataset again revealed better survival with use of permissive hypercapnia. A randomized controlled trial, undertaken by Amato et al.21 corroborated the Perret–Hickling hypothesis; additional support subsequently came from a randomized trial conducted by the ARDS Network.22 Three other groups of investigators, however, found that lowering tidal volume tended to increase mortality.23–25 The only variable that discriminated between the positive and negative studies was the average airway plateau pressure: patients with significantly increased mortality had plateau pressures above 32 cm H2O. Accordingly, tidal volume should be reduced in patients with ARDS in order to maintain a plateau pressure of no more than 32 cm H2O.26,27
In patients without ARDS, it is usual to use higher tidal volumes, approximately 8 mL/kg, as lower tidal volumes may give rise to considerable dyspnea.3
 RESPIRATORY RATE
Correct setting of the ventilator rate depends on the mode of ventilation employed.16 With assist–control ventilation, the ventilator supplies a breath in response to each patient effort. With this mode, physicians commonly pay little attention to the machine rate, which may be set much lower than the patient’s spontaneous rate. This gap results in two problems: (1) If the patient has a sudden decrease in respiratory center output, a low machine rate results in serious hypoventilation.3 (2) A large discrepancy between the patient’s spontaneous rate and the machine’s back-up rate results in a respiratory cycle with an inverse inspiratory-to-expiratory time (I:E) ratio.
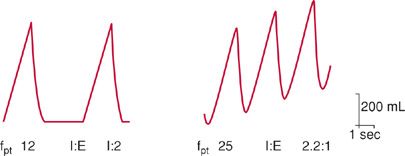
Development of an inverse I:E ratio arises because inspiratory time (TI) on the machine remains fixed at the initial setting and does not change in response to increases in the patient’s spontaneous rate (Fig. 148-6).16 For example, if the machine rate is initially set at 12 breaths/min (TTOT of 5 seconds) and TI set at 1.65 seconds (either set directly or indirectly as a consequence of the volume and flow settings), then TE will be 3.35 seconds. The I:E ratio will be 1:2. If the patient’s spontaneous respiratory rate is increased to 25 breaths/min, TTOT will be 2.4 seconds. Because TI remains fixed at 1.65 seconds, TE will be 0.75 s, and the I:E ratio will be 2:1. Such inverse-ratio ventilation is very uncomfortable and may lead to increased sedative use, or even to use of neuromuscular blockade, simply because of inappropriate setting of the back-up rate. Based on these considerations, the back-up rate during assist–control ventilation should be set at approximately four breaths less than the patient’s spontaneous rate.2
Figure 148-6 Effect of interaction between a patient’s respiratory rate and the ventilator back-up rate on inspiratory time—expiratory time ratio (I:E) during assist–control ventilation. Ventilator back-up rate is 12 breaths/min and inspiratory time (TI) 1.65 seconds. Left panel. If the patient’s intrinsic respiratory (fpt) rate is also 12 breaths/min, the total respiratory cycle time (TTOT) is 5.0 seconds, the expiratory time (TE) is 3.35 seconds, and the I:E ratio is 1:2. Right panel. If the patient’s respiratory rate increases to 25 breaths per minute, the new TTOT is 2.4 seconds, TE is 0.75 seconds, and I:E is 1:0.45 (or, as more conventionally noted, 2.2:1).
With IMV, the ventilator (or mandatory) rate is initially set high and then gradually reduced according to patient tolerance.10 Unfortunately, titration is often based on data from arterial blood gases, and even a small number of ventilator breaths can result in acceptable values for PaO2 and PaCO2 but achieve little or no respiratory muscle rest in patients with increased work of breathing. In ventilator-dependent patients, work of breathing at IMV rates of 14 breaths/min or less may be sufficient to induce respiratory muscle fatigue.11,12 With PS ventilation, the ventilator rate is not set.13
 INSPIRATORY FLOW RATE
Clinicians initially set the inspiratory flow rate at a default value, such as 60 L/min. Many critically ill patients, however, have an elevated respiratory motor output, and the initial flow setting may be insufficient to meet flow demands.3 As a result, patients will struggle against their own respiratory impedance and that of the ventilator.9,28 Consequently, work of breathing increases. Clinicians sometimes increase flow in order to shorten the inspiratory time and increase the expiratory time. An increase in flow, however, causes immediate and persistent tachypnea; as a result, expiratory time may be shortened.29 In a study of healthy subjects, Laghi et al.30 found that increases in inspiratory flow from 30 L/min to 60 and 90 L/min caused increases in respiratory rate of 20% and 41%, respectively.
One of the main reasons that clinicians increase inspiratory flow is to decrease inspiratory time, in the hope of allowing more time for expiration and, thereby, decreasing PEEPi, especially in patients with COPD. Because increased flow usually leads to an increase in respiratory rate, the expected shortening of expiratory time might actually increase PEEPi.
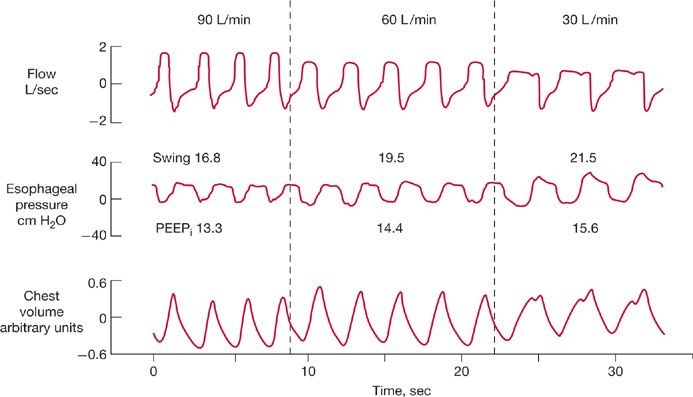
Laghi et al.31 investigated this phenomenon in 10 patients with COPD (Fig. 148-7). As with healthy subjects, an increase in flow from 30 to 90 L/min caused respiratory rate to increase from 16 to 21 breaths/min. Despite the increase in rate, PEEPi fell from 7.0 to 6.4 cm H2O. The decrease in PEEPi arose because of an increase in expiratory time (from 2.1 to 2.3 seconds), which allowed more time for lung deflation. Why did expiratory time increase? An increase in inspiratory flow is usually achieved by shortening of mechanical inspiratory time. The shortened inspiratory time, combined with time-constant inhomogeneity of COPD, causes overinflation of some lung units to persist into neural expiration. Continued inflation during neural expiration causes stimulation of the vagus nerve, which prolongs expiratory time.
Figure 148-7 Continuous recordings of flow, esophageal pressure (Pes), and the sum of rib cage and abdominal motion, in a patient with chronic obstructive pulmonary disease receiving assist–control ventilation at a constant tidal volume. As flow increased from 30 to 60 and 90 L/min (from right to left), frequency increased (from 18 to 23 and 26 breaths/min, respectively), PEEPi decreased (from 15.6 to 14.4 and 13.3 cm H2O, respectively), and end-expiratory lung volume also fell. Increases in flow from 30 L/min to 60 and 90 L/min also led to decreases in the swings in Pes from 21.5 to 19.5 and 16.8 cm H2O, respectively. (Reproduced with permission from Laghi F, Segal J, Choe WK, et al. Effect of imposed inflation time on respiratory frequency and hyperinflation in patients with chronic obstructive pulmonary disease. Am J Respir Crit Care Med. 2001;163(6):1365–1370.)
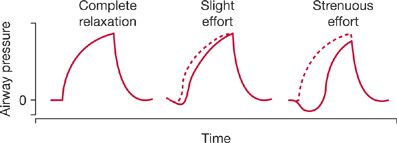
When adjusting the flow rate and trigger sensitivity, examination of the contour of the airway pressure waveform is helpful (Figs. 148-8 and 148-9).2 Ideally, the waveform should show a smooth rise and convex appearance during inspiration. In contrast, a prolonged negative phase, with excessive scalloping of the tracing, indicates unsatisfactory settings of sensitivity or flow.
Figure 148-8 Airway-pressure waveforms recorded during assist–control ventilation. The tracings represent changes in airway pressure during inspiration in a completely relaxed patient, and in patients making slight (center tracing) and strenuous efforts (tracing on right) to breathe. The distance between the dashed line (representing controlled ventilation) and the solid line (representing spontaneous breathing) is proportional to the patient’s work of breathing. (Reproduced with permission from Tobin MJ. Mechanical ventilation. N Engl J Med. 1994;330(15):1056–1061.)
Figure 148-9 Respiratory pressure–volume curve and the effects of traditional versus protective ventilation in a 70-kg patient with acute respiratory distress syndrome. The lower and upper inflection points of the inspiratory pressure–volume curve (center panel) are at 14 and 26 cm H2O, respectively. With conventional ventilation at a tidal volume of 12 mL/kg and zero end-expiratory pressure (left panel), alveoli collapse at the end of expiration. The generation of shear forces during the subsequent mechanical inflation may tear the alveolar lining, and attaining an end-inspiratory volume higher than the upper inflection point causes alveolar overdistention. With protective ventilation at a tidal volume of 6 mL/kg (right panel), the end-inspiratory volume remains below the upper inflection point; the addition of PEEP at 2 cm H2O above the lower inflection point may prevent alveolar collapse at the end of expiration and provide protection against the development of shear forces during mechanical inflation. (Reproduced with permission from Tobin MJ. Advances in mechanical ventilation. N Engl J Med. 2001;344(26):1986–1996.)
 FRACTIONAL INSPIRED OXYGEN CONCENTRATION
Correction of hypoxemia and its prevention are major goals in mechanically ventilated patients. Many predictive equations have been published to aid in selecting an appropriate FIO2, but none is sufficiently accurate to substitute for a trial-and-error approach.32 Initially, FIO2 is set at a high value (often 1.0) to ensure adequate oxygenation. Thereafter, the lowest FIO2 that achieves satisfactory arterial oxygenation should be selected. The usual target is a PaO2of 60 mm Hg or an arterial saturation (SaO2) of 90%; higher values do not substantially enhance tissue oxygenation. Although it is customary to wait 30 minutes to assess the response to a change in FIO2, the effect is usually well defined within 10 minutes. When using arterial blood samples to assess oxygenation, a target of 90% for SaO2 is appropriate. If pulse oximetry is employed, a SpO2 target may result in values for PaO2 as low as 41 mm Hg. In white patients, a target of 92% for SpO2 indicates satisfactory oxygenation. In black patients, however, this target may still result in significant hypoxemia.33
In experimental animals, hyperoxia produces diffuse alveolar damage, with histologic changes that are indistinguishable from ARDS resulting from any other cause. No diagnostic tests distinguish O2-induced injury from progression of the underlying disease. Thus, the possibility of O2 toxicity should be considered in any patient receiving an FIO2 of more than 0.50 to 0.60 for 24 to 48 hours or longer. Healthy human subjects who inhale 100% O2 develop acute tracheobronchitis, manifested as substernal discomfort, cough, sore throat, nasal congestion, eye and ear discomfort, paresthesias, and fatigue. Symptoms begin within 4 hours; bronchoscopic features of tracheal inflammation are evident after 6 hours.34 Retrosternal discomfort also occurs with an FIO2 of 0.75, but not with an FIO2 of 0.50. Hyperoxia causes absorption atelectasis in lung units with low ![]() ratios, because the rate of absorption of O2 from the alveoli into the bloodstream is faster than the rate of replenishment from inspired gas. Such atelectasis results in a small shunt (approximately 3%) in healthy elderly subjects and requires only about 6 minutes to develop.
ratios, because the rate of absorption of O2 from the alveoli into the bloodstream is faster than the rate of replenishment from inspired gas. Such atelectasis results in a small shunt (approximately 3%) in healthy elderly subjects and requires only about 6 minutes to develop.
In the face of potential O2 toxicity, the only possible strategy is to reduce the FIO2 to the lowest level compatible with adequate systemic oxygenation. Thus, excess O2 demand should be minimized, and measures to enhance systemic oxygenation optimized. Although excessive O2 administration should be avoided, there is more to fear from severe hypoxemia than from the potential damage that might result from hyperoxia.
 POSITIVE END-EXPIRATORY PRESSURE
The beneficial effects of positive end-expiratory pressure (PEEP) include improvement in arterial oxygenation, improvement in lung compliance, alleviation of excessive respiratory work secondary to PEEPi in patients with airflow limitation, and, possibly, a decrease in lung injury resulting from repeated alveolar collapse and reopening.15 The principal beneficial effect of PEEP is an increase in PaO2, which permits a decrease in FIO2 and a reduction in the risk of O2 toxicity. The major mechanism for the increase in PaO2 with PEEP is an increase in end-expiratory lung volume (Table 148-2).
