Data on long-term outcomes of percutaneous mitral valvuloplasty (PMV) are still scarce. In addition, the persistence of pulmonary hypertension (PH) after PMV is a complication for which mechanisms and prognostic implications are unclear. Our aims were (1) to report the long-term outcomes of patients with rheumatic mitral stenosis treated with PMV; (2) to determine the risk factors for long-term poor outcomes; and (3) to analyze the prevalence and predictors of persistent PH. We prospectively enrolled 532 patients who underwent PMV from 1987 to 2011 at 2 hospitals. The following end points were assessed after PMV: all-cause mortality, mitral reintervention, a composite end point of all-cause mortality and mitral reintervention, and PH persistence. Survival status was available for 97% patients; the median follow-up was 10 years (interquartile range 4 to 18 years). Procedural success was achieved in 85% patients. During the follow-up, 21% patients died and 27% required mitral reintervention. Before PMV, 74% patients had PH that persisted after PMV in 45% of patients (p < 0.001). Unfavorable valve anatomy (Wilkins score >8) and post-PMV mean pulmonary arterial pressure (PAP) were independent predictors of all-cause mortality, mitral reintervention, and the composite end point. Post-PMV mean PAP was significantly correlated with a mitral valve area (MVA) <2.5 cm 2 (p <0.001); in addition, on the echocardiographic follow-up, MVA was an independent predictor of systolic PAP (p <0.001). In conclusion, PMV represents an advantageous therapeutic option for patients with mitral stenosis in terms of long-term outcomes. Unfavorable valve anatomy and persistent PH were the most important predictors of long-term outcomes. The persistence of PH is associated with the MVA obtained after PMV.
Since percutaneous mitral valvuloplasty (PMV) was first described by Inoue in 1984, its use has spread worldwide, and it is considered the treatment of choice for patients with mitral stenosis (MS) with suitable valve anatomy. PMV is a safe and well-tolerated intervention and is associated with short-term benefits. Although some studies with longer follow-up periods have been published, data on long-term outcomes of PMV remain scarce. Full functional capacity recovery after successful PMV is limited by the persistence of pulmonary hypertension (PH), a complication for which mechanisms, prevalence, and prognostic implications are still largely unknown. In this study, our primary aim was to report the long-term outcomes of a large cohort of patients with MS treated with PMV, in regard to mortality and morbidity. In addition, our secondary aims were to (1) identify the risk factors for reintervention or mortality after an initially successful PMV and (2) to characterize the prevalence, determinants, and prognostic impact of PH persistence after PMV.
Methods
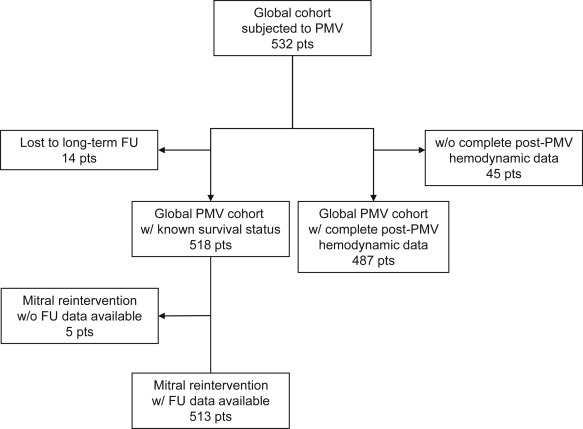
This multicenter, observational study included 532 consecutive patients with rheumatic MS who underwent PMV from April 1987 to October 2011 at the Hospitais da Universidade de Coimbra (Coimbra, Portugal) and the Hospital Reina Sofia (Córdoba, Spain; Figure 1 ). Data were prospectively collected in twin data sets. The study protocol was approved by the ethical committees of both centers and followed the principles of the 1975 Declaration of Helsinki. All patients provided written informed consent before the procedures.
The indications for PMV were as follows: symptomatic patients with moderate or severe MS with favorable valve morphology (based on echocardiographic evaluation); asymptomatic patients with moderate to severe MS and PH (systolic pulmonary artery pressure [sPAP] >50 mm Hg at rest), with favorable valve morphology; and symptomatic patients with moderate or severe MS with unfavorable valve morphology but not eligible for surgery. A baseline comprehensive transthoracic echocardiogram was performed before PMV. The morphologic features of the mitral valve were categorized as favorable (≤8) and unfavorable (>8) anatomy using the Wilkins score. Mitral valve area (MVA) was measured by direct planimetry in the parasternal short-axis view, and Doppler was used to calculate tricuspid regurgitation (TR) peak velocity gradient. Mitral regurgitation (MR) and TR were graded from 0 to 4+, depending on the spatial extent of the color flowjet area expressed as a percentage of the left or right atrial area. After 1988, all patients were screened for LA thrombus using a transesophageal echocardiography in the 24 hours preceding the procedure. If a thrombus was detected, the patient was not a candidate for PMV. Transthoracic echocardiogram measurement of MVA and quantification of MR were repeated the day after PMV.
PMV was performed by a percutaneous transseptal anterograde approach and either the Babič double-balloon technique (n = 44 patients) or the Inoue balloon technique (n = 488 patients), with conventional hemodynamic parameters monitored as previously described. Cardiac output (CO) was measured using the Fick or the thermodilution technique, and MVA was calculated using the Gorlin formula. Balloon size was chosen according to the mitral annulus size or to obtain an effective balloon dilatation area/body surface area of approximately 4 cm 2 /m 2 , and one-step dilatation was performed. Maximum balloon size was determined by the following formula: (patient height [cm]/10) + 10. In patients with unfavorable anatomy, the balloon diameter was undersized. Left ventriculography was performed to assess the presence and severity of MR; the Sellers’ classification was applied.
Clinical variables included age, gender, New York Heart Association functional class at presentation, presence of atrial fibrillation, and previous mitral intervention. Procedure-related variables included interventional technique, effective balloon dilating area normalized by body surface area and pre- and post-PMV hemodynamic parameters (PAPs, right atrial pressure, pulmonary capillary wedge pressure, ventricular filling pressures, systemic arterial pressures, mean mitral gradient [MG], transpulmonary gradient [TPG = mean PAP−PCWP], CO, pulmonary vascular resistance [PVR = TPG/CO], pulsatility index [{systolic PAP−diastolic PAP}/mean PAP], pulmonary arterial impedance [{mean PAP−diastolic PAP}/TPG] and calculated MVA). Procedural success was defined as MVA ≥1.5 cm 2 and MR ≤2/4. Information on acute results of PMV was available for 487 patients (92%; Figure 1 ).
Clinical follow-up data were collected during scheduled patient visits to the outpatient clinic or by telephone interview. When required, primary care physicians and referring cardiologists were contacted and medical records were reviewed to obtain additional information. Survival status was available for 97% patients (518 of 532), with a median follow-up period of 10 years (interquartile range 4 to 18 years). Surgical notes were obtained on all patients who underwent surgery after PMV. An echocardiographic follow-up, with a median period of 9 years (interquartile range 2 to 18 years) was available for 301 patients (57%) and included estimated MVA, mean MG, sPAP, MR, and TR quantification.
Three primary end points were defined: (1) all-cause mortality; (2) post-PMV mitral reintervention (either PMV or surgery); and (3) a composite end point of all-cause mortality or mitral reintervention. PH persistence after PMV was considered a secondary end point and was defined by a mean PAP (mPAP) ≥25 mm Hg in the post-PMV hemodynamic evaluation. Patients with moderate or severe MR were excluded from post-PMV statistical analyses.
Data are shown as means ± SD for continuous variables and absolute and relative frequencies (%) for categorical variables. The paired-sample t test and the sign test were used to compare pre- and post-PMV variables. Kaplan–Meier analysis was used to compute survival curves, and comparison of survival times was performed by the log-rank test. All variables were tested independently in a univariate logistic regression model. Potential confounders were incorporated in a Cox proportional hazards regression model based on previously demonstrated associations or those typically deemed to be clinically important, or having associations with both the predictor and outcome with p values <0.1, or changing the regression coefficient by >10%. Variables associated with a p value <0.05 were retained in the final model using a stepwise approach. Linear regression was used to test the association between post-PMV MVA and post-PMV mPAP. Observation of best fit curves in scatter plots yielded 2.5 cm 2 as a cut-off point in the association between those 2 variables. A simple linear regression model was not considered appropriate; therefore, we decided to construct a spline model. All analyses were performed with STATA 12.0 (StataCorp LP, Texas). Two-sided p <0.05 were considered statistically significant.
Results
A total of 532 consecutive patients with rheumatic MS were included ( Table 1 ). Procedural success was achieved in 85% of patients. Procedural failures were related to suboptimal valve opening (MVA <1.5 cm 2 ) in 12%, significant MR (grade >2) in 3% and related to both conditions in 0.6% of patients. Table 2 presents the comparison of the pre- and post-PMV hemodynamic variables. Persistence of PH after a successful PMV occurred in 45% of patients.
| Variables | |
|---|---|
| Age (years), mean ± SD | 50 ± 13 |
| Age > 50 years | 256 (48%) |
| Female gender | 450 (85%) |
| Left ventricular ejection fraction (%), mean ± SD | 60 ± 8 |
| Atrial fibrillation | 242 (46%) |
| Severe tricuspid regurgitation | 17 (8%) |
| Prior commissurotomy | 54 (11%) |
| New York Heart Association functional class IV | 16 (3%) |
| Wilkins score >8 (n = 455) | 37 (8%) |
| Variables | Pre-PMV | Post-PMV | P- value |
|---|---|---|---|
| Mitral valve area (cm 2 ) | 1.0 ± 0.3 | 2.2 ± 0.7 | < 0.001 |
| Mitral gradient (mmHg) | 14 ± 7 | 6 ± 4 | < 0.001 |
| Right atrial pressure (mmHg) | 7 ± 5 | 8 ± 5 | 0.416 |
| Mean pulmonary artery pressure (mmHg) | 34 ± 13 | 26 ± 12 | < 0.001 |
| Systolic pulmonary artery pressure (mmHg) | 52 ± 20 | 41 ± 17 | < 0.001 |
| Diastolic pulmonary artery pressure (mmHg) | 25 ± 10 | 19 ± 11 | < 0.001 |
| Pulmonary capillary wedge pressure (mmHg) | 23 ± 8 | 16 ± 8 | < 0.001 |
| Systolic left ventricular pressure (mmHg) | 115 ± 30 | 112 ± 30 | 0.024 |
| Cardiac output (L.min -1 ) | 4.6 ± 1.3 | 5.1 ± 1.6 | < 0.001 |
| Pulmonary vascular resistance (Wood units) | 2.5 ± 2.3 | 2.3 ± 2.3 | 0.145 |
| Pulsatility index | 0.8 ± 0.4 | 0.9 ± 0.4 | 0.133 |
| Pulmonary arterial impedance (dynes.s -2 .cm −5 ) | 1.0 ± 1.5 | 0.9 ± 1.5 | 0.010 |
| Transpulmonary gradient (mmHg) | 11 ± 9 | 11 ± 9 | 0.422 |
| Pulmonary hypertension (mPAP ≥ 25 mmHg) | 74% | 45% | < 0.001 |
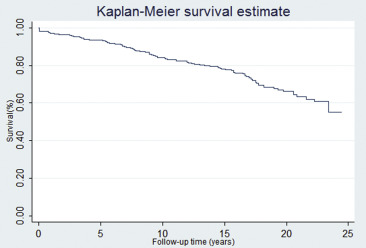
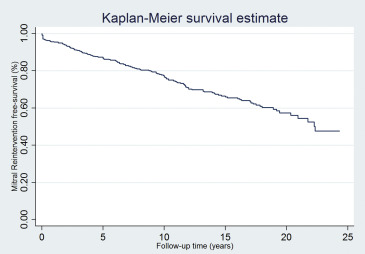
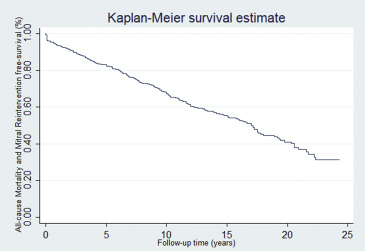
To test the hypothesis that PMV is a durable procedure, we performed a survival analysis using the following end points: all-cause mortality, mitral reintervention, and a composite end point of both. During the follow-up, 21% of patients (108 of 518) died ( Figure 2 ), mitral reintervention was required in 27% of patients (138 of 513; Figure 3 ). Of the patients who required a mitral reintervention, 17 (12%) had a repeat PMV and 121 (88%) underwent mitral valve surgery. Figure 4 depicts the composite end point.
We further conducted a univariate analysis to identify risk factors for the end points ( Table 3 ). After adjustment for confounders (age, gender, atrial fibrillation, post-PMV mPAP, post-PMV MVA, post-PMV pulmonary vascular resistance, and Wilkins score >8), multivariate analysis identified unfavorable valve anatomy (Wilkins score >8) and post-PMV mPAP as independent predictors of the 3 predefined primary end points ( Table 4 ). In addition, age was identified as independent predictor of all-cause mortality and the composite end point.
| Variable | Endpoint 1: All-cause mortality | Endpoint 2: Mitral reintervention | Endpoint 3: All-cause mortality or mitral reintervention | |||
|---|---|---|---|---|---|---|
| HR (95% CI) | P value | HR (95% CI) | P value | HR (95% CI) | P value | |
| Age (years) | 1.093 (1.072-1.114) | <0.001 | 1.013 (0.999-1.027) | 0.073 | 1.037 (1.025-1.049) | <0.001 |
| Female gender | 0.651 (0.413-1.027) | 0.065 | 0.650 (0.427-0.991) | 0.045 | 0.620 (0.442-0.871) | 0.006 |
| Atrial fibrillation | 4.497 (2.869-7.049) | <0.001 | 1.386 (0.980-1.962) | 0.065 | 2.030 (1.524-2.703) | <0.001 |
| Pre-PMV New York Heart Association class IV | 1.302 (0.478-3.543) | 0.606 | 1.641 (0.668-4.032) | 0.280 | 1.541 (0.722-3.289) | 0.264 |
| Pre-PMV left ventricular ejection fraction (%) | 0.993 (0.966-1.020) | 0.612 | 1.013 (0.989-1.038) | 0.302 | 1.005 (0.986-1.025) | 0.623 |
| Pre-PMV tricuspid regurgitation III+IV | 6.683 (2.434-18.351) | <0.001 | 2.710 (1.040-7.066) | 0.041 | 3.299 (1.533-7.097) | 0.002 |
| Pre-PMV mean right atrial pressure (mmHg) | 1.105 (1.047-1.167) | <0.001 | 1.056 (1.004-1.109) | 0.034 | 1.066 (1.024-1.110) | 0.002 |
| Pre-PMV mean pulmonary artery pressure (mmHg) | 1.026 (1.011-1.041) | <0.001 | 1.020 (1.007-1.034) | 0.003 | 1.023 (1.012-1.034) | <0.001 |
| Pre-PMV pulsatility index | 1.398 (0.789-2.478) | 0.251 | 1.380 (0.836-2.278) | 0.208 | 1.240 (0.808-1.902) | 0.325 |
| Pre-PMV pulmonary capillary wedge pressure (mmHg) | 1.014 (0.991-1.038) | 0.237 | 1.028 (1.007-1.049) | 0.009 | 1.022 (1.005-1.039) | 0.010 |
| Pre-PMV pulmonary artery impedance (dynes.s -2 .cm −5 ) | 0.996 (0.872-1.138) | 0.953 | 0.932 (0.790-1.099) | 0.402 | 0.916 (0.799-1.051) | 0.211 |
| Pre-PMV mitral gradient (mmHg) | 0.988 (0.961-1.015) | 0.380 | 1.016 (0.994-1.039) | 0.152 | 1.003 (0.984-1.022) | 0.744 |
| Pre-PMV mitral valve area (cm 2 ) | 0.256 (0.126-0.520) | <0.001 | 0.325 (0.177-0.597) | <0.001 | 0.319 (0.194-0.522) | <0.001 |
| Pre-PMV cardiac output (L.min -1 ) | 0.672 (0.562-0.805) | <0.001 | 0.913 (0.794-1.049) | 0.198 | 0.841 (0.748-0.945) | 0.004 |
| Pre-PMV pulmonary vascular resistance (Wood units) | 1.196 (1.121-1.275) | <0.001 | 1.077 (1.002-1.156) | 0.043 | 1.127 (1.071-1.185) | <0.001 |
| Post-PMV mean right atrial pressure (mmHg) | 1.094 (1.005-1.192) | 0.039 | 1.057 (0.992-1.127) | 0.088 | 1.051 (0.993-1.112) | 0.088 |
| Post-PMV mean pulmonary artery pressure | 1.961 (1.269-3.030) | 0.002 | 1.048 (1.035-1.062) | < 0.001 | 1.048 (1.037-1.059) | <0.001 |
| Post-PMV pulsatility index | 0.754 (0.430–1.324) | 0.326 | 0.696 (0.436-1.110) | 0.128 | 0.724 (0.495-1.059) | 0.096 |
| Post-PMV pulmonary capillary wedge pressure (mmHg) | 1.051 (1.026-1.077) | <0.001 | 1.103 (1.076-1.130) | < 0.001 | 1.091 (1.069-1.113) | <0.001 |
| Post-PMV pulmonary arterial impedance (dynes.s -2 .cm −5 ) | 0.885 (0.720-1.087) | 0.245 | 1.072 (0.934-1.230) | 0.321 | 0.989 (0.864-1.131) | 0.868 |
| Post-PMV mitral gradient (mmHg) | 1.015 (0.969-1.063) | 0.526 | 1.106 (1.065-1.149) | < 0.001 | 0.724 (0.495-1.059) | 0.096 |
| Post-PMV mitral valve area (cm 2 ) | 0.460 (0.328-0.646) | <0.001 | 0.529 (0.390-0.718) | <0.001 | 0.521 (0.408-0.665) | <0.001 |
| Post-PMV cardiac output (L.min -1 ) | 0.703 (0.596-0.829) | <0.001 | 0.834 (0.728-0.955) | 0.009 | 0.799 (0.713-0.895) | <0.001 |
| Post-PMV pulmonary vascular resistance (Wood units) | 1.199 (1.126-1.278) | <0.001 | 1.151 (1.078-1.229) | < 0.001 | 1.172 (1.116-1.230) | <0.001 |
| Post-PMV New York Heart Association class IV | 3.566 (1.272-10.003) | 0.016 | 3.750 (1.478-9.514) | 0.005 | 4.235 (1.918-9.353) | <0.001 |
| Wilkins score > 8 | 3.592 (2.186-5.904) | <0.001 | 4.808 (3.032-7.625) | <0.001 | 4.214 (2.866-6.198) | <0.001 |
Stay updated, free articles. Join our Telegram channel

Full access? Get Clinical Tree


