Patients who develop new-onset atrial fibrillation (AF) after acute myocardial infarction (AMI) show an increased risk for adverse events and mortality during follow-up. Recently, a novel noninvasive echocardiographic method has been validated for the estimation of total atrial activation time using tissue Doppler imaging of the atria (PA-TDI duration). PA-TDI duration has shown to be independently predictive of new-onset AF. However, whether PA-TDI duration provides predictive value for new-onset AF in patients after AMI has not been evaluated. Consecutive patients admitted with AMIs and treated with primary percutaneous coronary intervention underwent echocardiography <48 hours after admission. All patients were followed at the outpatient clinic for ≥1 year. During follow-up, 12-lead electrocardiography and Holter monitoring were performed regularly, and the development of new-onset AF was noted. Baseline echocardiography was performed to assess left ventricular and left atrial (LA) function. LA performance was quantified with LA volumes, function, and PA-TDI duration. A total of 613 patients were evaluated. LA maximal volume (hazard ratio 1.07, 95% confidence interval 1.04 to 1.11), the total LA ejection fraction (hazard ratio 0.96, 95% confidence interval 0.93 to 0.99) and PA-TDI duration (hazard ratio 1.05, 95% confidence interval 1.04 to 1.06) were univariate predictors of new-onset AF. After multivariate analysis, LA maximal volume and PA-TDI duration independently predicted new-onset AF. Furthermore, PA-TDI duration provided incremental prognostic value to traditional clinical and echocardiographic parameters for the prediction of new-onset AF. In conclusion, PA-TDI duration is a simple measurement that provides important value for the prediction of new-onset AF in patients after AMI.
Atrial fibrillation (AF) is a common arrhythmia after acute myocardial infarction (AMI) and a major predictor of outcomes. Patients who develop AF after AMIs show an increased risk for in-hospital adverse events and mortality during follow-up. Therefore, risk stratification based on clinical and echocardiographic parameters to define patients who are at risk for AF after AMIs has been studied extensively. Recently, a novel noninvasive echocardiographic method has been developed that predicts new-onset AF. This novel technique measures total atrial conduction time using transthoracic tissue Doppler imaging of the atria (PA-TDI duration) and has been validated against P-wave duration on signal-averaged electrocardiography, which is the gold standard for the noninvasive determination of total atrial conduction time. Importantly, PA-TDI duration has been demonstrated to be a simple, fast, and reliable method to obtain total atrial conduction time. Increased PA-TDI duration reflects conduction slowing and atrial dilatation and may therefore reflect increased vulnerability for the development of AF. Previously, De Vos et al demonstrated that PA-TDI duration was independently predictive of new-onset AF in a general population of 249 patients from a cardiology outpatient clinic. However, whether PA-TDI duration provides predictive and incremental value in addition to known risk factors for new-onset AF in patients after AMIs has not been evaluated. Accordingly, the aim of the present study was to evaluate the predictive value of PA-TDI duration for new-onset AF in patients after AMIs, together with other established clinical and echocardiographic predictors of new-onset AF after AMI.
Methods
Beginning in February 2004, consecutive patients admitted with AMIs treated with primary percutaneous coronary intervention were included in an ongoing registry. All patients were treated according to the institutional AMI protocol. This protocol, designed to improve care around AMI, includes structured medical therapy and standardized follow-up at the outpatient clinic, as described previously. In addition, 2-dimensional echocardiography was performed <48 hours after admission. All patients visited the outpatient clinic at 1, 3, 6, and 12 months after the index infarction, and 12-lead electrocardiography was performed during these visits. In addition, Holter recordings were obtained at 3- and 6-month follow-up, and the development of new-onset AF was noted. Patients with histories of AF were excluded from the present analysis because the aim was to identify predictors of new-onset AF after AMI. AF was determined on the basis of electrocardiographic findings consistent with the diagnosis of AF on 12-lead electrocardiograms and Holter recordings during hospitalization and follow-up at the outpatient clinic. All patients were followed prospectively for ≥1 year.
Patients underwent imaging in the left lateral decubitus position using a commercially available system (Vivid 7; GE Vingmed Ultrasound AS, Horten, Norway). Data acquisition was performed using a 3.5-MHz transducer, at a depth of 16 cm in the parasternal and apical views. Standard M-mode and 2-dimensional images were obtained during breath hold and saved in cine loop format from 3 consecutive beats. Analysis was performed off-line (EchoPac version 108.1.5; GE Vingmed Ultrasound AS) by 2 experienced observers. Left ventricular (LV) end-systolic volume and end-diastolic volume were traced, and the LV ejection fraction was calculated using the biplane Simpson’s method. The left ventricle was divided into 16 segments, and each segment was analyzed individually and scored on the basis of its motion and systolic thickening (1 = normokinesia, 2 = hypokinesia, 3 = akinesia, 4 = dyskinesia). Subsequently, the wall motion score index was calculated as the sum of the segment scores divided by the number of segments scored. The severity of mitral regurgitation was graded semiquantitatively from the jet area of color flow Doppler data and by measuring the width of the vena contracta. Mitral regurgitation was characterized as mild = jet area/left atrial (LA) area <20% and vena contracta width <0.3 cm, moderate = jet area/LA area 20% to 40% and vena contracta width 0.3 to 0.69 cm, and severe = jet area/LA area >40% and vena contracta width ≥0.7 cm. Pulsed-wave Doppler of the mitral valve inflow was obtained by positioning the Doppler sample volume between the tips of the mitral leaflets. Peak early (e) and late (a) diastolic velocities and E-wave deceleration time were measured. The E/E′ ratio was obtained by dividing E by E′, which was measured using color-coded tissue Doppler imaging at the septal side of the mitral annulus in the apical 4-chamber view.
LA volumes were calculated according to the biplane Simpson’s method. LA volumes were measured at 3 time points during the cardiac cycle: (1) maximal volume (LA max) at end-systole, just before mitral valve opening; (2) minimal volume (LA min) at end-diastole, just before mitral valve closure; and (3) volume before atrial active contraction (LA preA), obtained from the last frame before mitral valve reopening or at time of the P wave on surface electrocardiography. All LA volumes were indexed to body surface area, as recommended. LA function was derived from the LA volumes and expressed with the following formulas: (1) total atrial emptying fraction: LA total ejection fraction = [(LA max − LA min)/LA max] × 100; (2) active atrial emptying fraction: LA active ejection fraction = [(LA preA − LA min)/LA preA] × 100, which is considered an index of LA active contraction; (3) passive atrial emptying fraction: LA passive ejection fraction = [(LA max − LA preA)/LA max] × 100, which is considered an index of LA conduit function; and (4) atrial expansion index: LA expansion index = [(LA max − LA min)/LA min] × 100, which is considered an index of LA reservoir function.
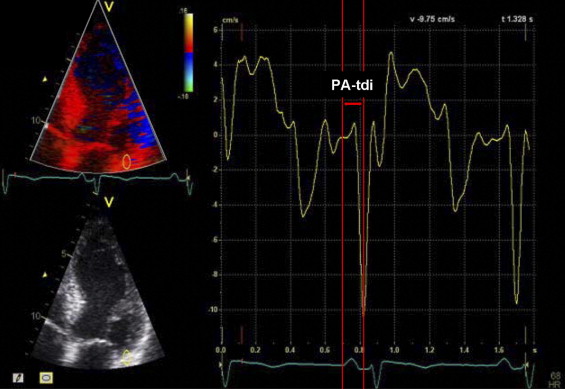
In addition, total atrial conduction time was determined using a validated noninvasive echocardiographic method. Using color-coded tissue Doppler imaging, the sample volume was placed on the lateral wall of the left atrium just above the mitral annulus in the apical 4-chamber view. The PA-TDI duration, defined as the time interval from the initiation of the electrocardiographic P wave on surface electrocardiography to the peak of the A′ wave of the atrial tissue Doppler tracing, was measured in 3 cardiac cycles and averaged ( Figure 1 ). The measurement of PA-TDI duration was feasible in 89% of the patients.
Continuous data are presented as mean ± SD, and categorical data are presented as frequencies and percentages. Differences in baseline characteristics between patients who developed new-onset AF and those without AF during follow-up were evaluated using the unpaired Student’s t test and the chi-square test, as appropriate. Twenty patients were randomly selected to test the intra- and interobserver variability for the PA-TDI duration measurements by Bland-Altman analysis. Univariate and multivariate Cox proportional-hazards regression analyses were performed to relate clinical characteristics and echocardiographic parameters to the development of new-onset AF. The number of covariables had to be limited because of the relatively small number of end point events. Therefore, separate clinical and echocardiographic multivariate models were constructed. Variables with p values ≤0.25 in univariate analysis were considered potential predictors of end point events. The separate clinical and echocardiographic multivariate models were based on this selection and were constructed by backward deletion of the least significant variable, until all variables had p values ≤0.10. To avoid colinearity, peak creatine phosphokinase level, LA min, LA preA, and LA passive ejection fraction were excluded from multivariate analysis. The final multivariate model was constructed by combining the clinical and echocardiographic models. Thereafter, the incremental value of PA-TDI duration to the known risk factors for adverse outcomes, related to clinical information and echocardiographic parameters, was established. For this purpose, those characteristics were first entered into the Cox proportional-hazards model in a stepwise fashion. Subsequently, PA-TDI duration was entered individually. Global chi-square values, including the significance level for each step in relation to the previous value, were calculated. Time to first episode of AF in relation to PA-TDI duration was analyzed using the Kaplan-Meier method and compared using the log-rank test. Therefore, PA-TDI was dichotomized on the basis of the median (110 ms). To determine the optimal cut-off value of PA-TDI duration for the prediction of new-onset AF, receiver-operating characteristic curve analysis was applied. The optimum was defined as the value for which the sum of sensitivity and specificity was maximized, and sensitivity, specificity, and positive and negative predictive values were calculated for the cut-off value. Statistical analysis was performed using SPSS version 16.0 (SPSS, Inc., Chicago, Illinois). All statistical tests were 2 sided, and a p value <0.05 was considered statistically significant.
Results
A total of 726 patients were included. Nine patients (1.2%) died during hospitalization before echocardiographic assessment could be performed, and in 22 patients (3.0%), echocardiographic assessment was not available within 48 hours of admission for logistic reasons. An additional 35 patients (4.8%) were excluded because 1-year follow-up was not completed. From the remaining 660 patients, 47 patients were excluded with previous AF or AF during baseline echocardiography. The final patient population therefore comprised 613 patients. Tables 1 and 2 list the baseline clinical and echocardiographic characteristics of the patient population. The mean age was 60 ± 12 years, and most patients were men (480 patients [78%]). The mean LV ejection fraction, E/E′ ratio and LA max were 46 ± 8%, 13 ± 5, and 21 ± 8 ml/m 2 , respectively. Overall, the mean PA-TDI duration was 110 ± 18 ms. During a mean follow-up duration of 21 ± 13 months, 38 patients (7%) developed new-onset AF.
| Variable | All Patients (n = 613) | New-Onset AF (n = 38) | No AF (n = 575) | p Value ⁎ |
|---|---|---|---|---|
| Age (years) | 60 ± 12 | 66 ± 9 | 60 ± 12 | <0.001 |
| Men | 480 (78%) | 27 (71%) | 453 (79%) | 0.26 |
| Body surface area (m 2 ) | 1.9 ± 0.2 | 1.9 ± 0.2 | 2.0 ± 0.2 | 0.38 |
| Current smoking | 313 (51%) | 14 (37%) | 299 (52%) | 0.07 |
| Diabetes | 60 (10%) | 3 (8%) | 57 (10%) | 0.69 |
| Family history of CAD | 255 (42%) | 14 (37%) | 241 (42%) | 0.53 |
| Hyperlipidemia | 124 (20%) | 8 (22%) | 116 (20%) | 0.84 |
| Hypertension | 178 (29%) | 12 (32%) | 166 (29%) | 0.72 |
| Previous myocardial infarction | 44 (7%) | 3 (8%) | 41 (7%) | 0.86 |
| LAD culprit vessel | 295 (48%) | 13 (34%) | 282 (49%) | 0.08 |
| Multivessel disease | 290 (48%) | 22 (58%) | 268 (47%) | 0.19 |
| TIMI flow grade | 2.9 ± 0.3 | 2.9 ± 0.4 | 2.9 ± 0.3 | 0.22 |
| Peak CPK level (U/L) | 2,463 ± 2,125 | 3,382 ± 2,427 | 2,403 ± 2,092 | 0.006 |
| Peak cTnT level (μg/L) | 6.8 ± 6.5 | 9.3 ± 8.6 | 6.7 ± 6.3 | 0.02 |
| Heart rate (beats/min) | 71 ± 13 | 72 ± 14 | 71 ± 13 | 0.84 |
| PR interval (ms) | 167 ± 28 | 187 ± 38 | 166 ± 27 | 0.002 |
| ACE inhibitor/ARB | 576 (98%) | 38 (100%) | 538 (98%) | 0.32 |
| Antiplatelet agent | 590 (100%) | 38 (100%) | 552 (100%) | 1.00 |
| β blocker | 540 (92%) | 34 (90%) | 506 (92%) | 0.64 |
| Statin | 581 (99%) | 38 (100%) | 543 (98%) | 0.43 |
⁎ Comparison of patients who developed new-onset AF versus those who did not develop new-onset AF.
| Variable | All Patients (n = 613) | New-Onset AF (n = 38) | No AF (n = 575) | p Value ⁎ |
|---|---|---|---|---|
| LV end-systolic volume (ml) | 57 ± 22 | 57 ± 23 | 57 ± 22 | 0.84 |
| LV end-diastolic volume (ml) | 104 ± 34 | 104 ± 35 | 104 ± 34 | 0.98 |
| LV ejection fraction (%) | 46 ± 8 | 45 ± 8 | 46 ± 8 | 0.74 |
| Wall motion score index | 1.48 ± 0.27 | 1.54 ± 0.22 | 1.47 ± 0.28 | 0.13 |
| E/A ratio | 0.96 ± 0.35 | 1.04 ± 0.47 | 0.95 ± 0.34 | 0.24 |
| Deceleration time (ms) | 213 ± 74 | 202 ± 73 | 214 ± 74 | 0.34 |
| E/E′ ratio | 13 ± 5 | 15 ± 8 | 13 ± 5 | 0.16 |
| Moderate or severe mitral regurgitation | 42 (7%) | 7 (18%) | 35 (6%) | 0.004 |
| LA max (ml/m 2 ) | 21 ± 8 | 26 ± 11 | 21 ± 8 | 0.004 |
| LA min (ml/m 2 ) | 9 ± 5 | 13 ± 7 | 9 ± 5 | 0.002 |
| LA preA (ml/m 2 ) | 15 ± 6 | 19 ± 8 | 15 ± 6 | 0.002 |
| LA total ejection fraction (%) | 58 ± 10 | 53 ± 13 | 58 ± 10 | 0.04 |
| LA passive ejection fraction (%) | 30 ± 12 | 26 ± 14 | 30 ± 12 | 0.03 |
| LA active ejection fraction (%) | 39 ± 12 | 37 ± 16 | 39 ± 12 | 0.30 |
| LA expansion index (%) | 153 ± 68 | 141 ± 102 | 154 ± 65 | 0.47 |
| PA-TDI duration (ms) | 110 ± 18 | 138 ± 29 | 109 ± 16 | <0.001 |
⁎ Comparison of patients who developed new-onset AF versus those who did not develop new-onset AF.
Stay updated, free articles. Join our Telegram channel

Full access? Get Clinical Tree


