Triplane tissue synchronization imaging (TSI) and real-time 3-dimensional echocardiography (RT3DE) provide different characterizations of left ventricular (LV) mechanics and dyssynchrony. Triplane TSI assesses differences in time to peak systolic segmental myocardial tissue velocities, whereas RT3DE evaluates differences in time to minimum end-systolic regional volumes. Whether an approach using the 2 3D techniques predicts better significant reverse remodeling after cardiac resynchronization therapy (CRT) remains unknown. In 166 patients (mean age 66 ± 9 years, 78% men) treated with CRT, baseline LV dyssynchrony was assessed using RT3DE and triplane TSI. LV dyssynchrony was defined by a systolic dyssynchrony index ≥6.4% when assessed with RT3DE and SD of time to peak velocity of 12 segments (Ts-SD-12) ≥33 ms with triplane TSI. CRT response was defined by ≥15% decrease in LV end-systolic volume at 6-month follow-up. Mean LV dyssynchrony using Ts-SD-12 was 48 ± 26 ms and mean systolic dyssynchrony index was 8.51 ± 3.81%. Response to CRT was observed in 86.3% of patients showing LV dyssynchrony with the 2 methods. In contrast, 97% of patients who did not show significant LV dyssynchrony with any of the techniques were nonresponders (p <0.001). Importantly, systolic dyssynchrony index and LV dyssynchrony using Ts-SD-12 were independent predictors of response to CRT (p <0.001 for each technique). Assessment of LV dyssynchrony with the 2 techniques showed incremental value for prediction of significant LV reverse remodeling over its assessment with only 1 technique (chi-square 90.18, p <0.001). In conclusion, the combined use of 2 different 3D techniques to assess LV dyssynchrony permits accurate prediction of response to CRT.
Left ventricular (LV) mechanical dyssynchrony is commonly observed in patients with heart failure. Evaluation of LV mechanical dyssynchrony has been shown to be clinically relevant because it is related to a high likelihood of response to cardiac resynchronization therapy (CRT). Thus far, most trials have used 2-dimensional echocardiographic methods to assess LV dyssynchrony. Recently, the advent of 3-dimensional (3D) imaging techniques has permitted assessment of dyssynchrony within the entire left ventricle. Triplane tissue synchronization imaging (TSI) and real-time 3D echocardiography (RT3DE) have been used to assess LV dyssynchrony and to predict significant LV reverse remodeling after CRT, respectively. However, these 2 3D echocardiographic techniques evaluate different aspects of LV mechanics related to LV dyssynchrony. In particular, the high temporal resolution of triplane TSI permits detection of rapid changes in myocardial velocities along the cardiac cycle. In contrast, RT3DE evaluates changes in LV regional volumes along the cardiac cycle. Evaluation of LV dyssynchrony with these 2 different 3D techniques could potentially provide comprehensive information on LV mechanical activation. Therefore, the aim of the present study was to evaluate the impact of a comprehensive 3D echocardiographic evaluation of LV mechanical dyssynchrony on prediction of response to CRT.
Methods
Patients with advanced heart failure, LV ejection fraction ≤35%, and QRS complex width >120 ms treated with CRT were included in this retrospective analysis. Patients with recent acute coronary syndrome (<3 months) or decompensated heart failure were excluded. Cause of heart failure was considered ischemic when significant coronary artery disease (>50% stenosis in ≥1 major epicardial coronary artery) was identified on coronary angiogram and/or when previous myocardial infarction or revascularization was noted.
According to the clinical protocol, before CRT implantation, New York Heart Association functional class functional class, quality of life using the Minnesota Living with Heart Failure Questionnaire, and a 6-minute walk test were evaluated. Furthermore, clinical evaluation included 3D echocardiography to evaluate LV volumes, LV ejection fraction, and LV dyssynchrony in all patients. In particularly, 3D LV dyssynchrony was determined using triplane TSI and RT3DE. At 6-month follow-up LV volumes and LV ejection fraction were reassessed using RT3DE. All clinical data were prospectively entered into the departmental cardiology information system (EPD-Vision, Leiden University Medical Center, Leiden, the Netherlands) and retrospectively analyzed.
Response to CRT was defined as ≥15% decrease in 3D LV end-systolic volume 6 months after CRT implantation. Conversely, patients who did not show such an amount of LV reverse remodeling were defined as nonresponders. Relative merits of the 2 3D LV dyssynchrony techniques on prediction of response to CRT were evaluated at 6-month follow-up.
Patients underwent imaging using 2 different ultrasound systems: the iE33 system (Philips Medical Systems, NA, Bothel, Washington) equipped with an X3 matrix phased-array transducer and the Vivid 7 system (GE Healthcare, Horten, Norway) equipped with a 3-V phased-array transducer. Apical full-volume datasets were obtained in all patients during breath-hold at end-expiration. Scan line density and gain and compression settings were adjusted to optimize image quality. Using the iE33 system and the X3 probe, wide-angle data were acquired and a full large pyramidal volume of the left ventricle (103 × 103°) was obtained from 4 to 7 R-triggered small real-time subvolumes. Using the Vivid-7 system and the 3 V probe, triplane images of the left ventricle were acquired. This imaging technique permits simultaneous visualization of apical 2-, 4-, and 3-chamber views of the left ventricle. Interplane sector angles were established by default at 60° and were adjusted to obtain adequate orientation of the 3 apical views. Color-coded TSI was applied to the triplane views and sector width and depth were adjusted to optimize frame rate for complete visualization of the entire left ventricle at the highest possible frame rate.
Quantification of 3D LV volumes was performed offline using Q-Lab Advanced Quantification (Philips Medical Systems, 2008). The apical full-volume dataset of the left ventricle is automatically cropped displaying the apical 2- and 4-chamber views and the short-axis view. Multiplanar reformation planes are oriented to avoid foreshortening of the LV cavity. Next, the LV apex and mitral annular plane are identified with 5 reference points at end-diastolic and end-systolic frames. Subsequently, the software generates a preconfigured ellipse fitted to the endocardial borders for each frame. If needed, endocardial borders were then manually adjusted. Subsequently, a 3D model was automatically generated and 3D LV end-diastolic volume, LV end-systolic volume, and LV ejection fraction were calculated.
Triplane TSI evaluates LV dyssynchrony based on analysis of segmental tissue velocities. Analysis of LV dyssynchrony was performed offline and has been described previously. To perform this analysis, timings of aortic valve opening and closure were first labeled using the pulse-wave velocity of the LV outflow tract. Next, sample volumes were placed on the basal and mid segments of the septal, lateral, inferior, anterior, posterior, and anteroseptal walls of the triplane dataset. Time to peak systolic velocity (Ts) for each of 12 LV segments was displayed in a bull’s-eye plot. LV dyssynchrony index was derived from the SD of Ts of the 12 segments (Ts-SD-12). A cut-off value ≥33 ms indicates significant LV dyssynchrony ( Figure 1 ).
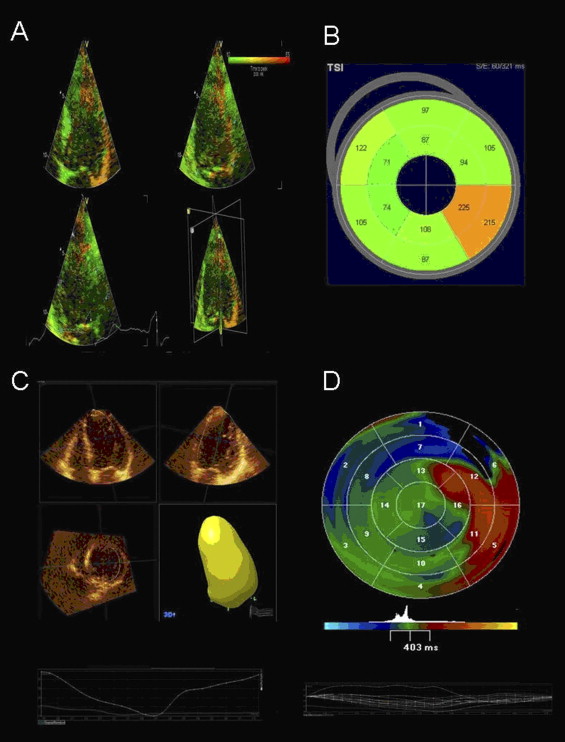
Assessment of LV dyssynchrony was performed offline using Q-Lab Advanced Quantification 24 hours before CRT implantation. This specific new 3D imaging technique evaluates LV dyssynchrony based on analysis of regional volumetric changes. Therefore, the volumetric 3D LV model is automatically subdivided in 16 pyramidal subvolumes. The time–volume tracings are displayed for each pyramidal subvolume and time to minimal end-systolic volume is recorded for each segment. The LV dyssynchrony index is derived from the SD of these 16 segmental timings expressed in percentage of the cardiac cycle (systolic dyssynchrony index). A systolic dyssynchrony index cut-off value ≥6.4% indicates significant LV dyssynchrony ( Figure 1 ).
The LV pacing lead was inserted transvenously along the subclavian route. A coronary sinus venogram was obtained using a balloon catheter. Next, the LV pacing lead was inserted through the coronary sinus with the help of an 8Fr guiding catheter and positioned as far as possible in the venous system, preferably in a (postero-)lateral vein. The right atrial and ventricular leads were positioned conventionally. CRT device and lead implantation were successful in all patients, without major complications (Contak Renewal, Guidant Corporation, St. Paul, Minnesota; Insync III or Insync Sentry, Medtronic, Inc., Minneapolis, Minneosta; or Lumax, Biotronik, Berlin, Germany). Three types of LV leads were used (Easytrak, Guidant Corporation; Attain, Medtronic, Inc.; or Corox, Biotronik).
Continuous data are expressed as mean ± SD and were compared using Student’s t test for paired and unpaired data when appropriate. Categorical variables are expressed as number and frequency and were compared using chi-square test. For identification of independent predictors of response to CRT, a multivariate logistic regression model was created introducing significant univariate variables as covariates with the stepwise enter method. For each variable, the hazard ratio and 95% confidence interval were calculated. The incremental value of the 2 3D LV dyssynchrony techniques to predict response to CRT over clinical variables was assessed by calculating the global chi-square test. All statistical analyses were performed with SPSS 17.0 (SPSS, Inc., Chicago, Illinois). For all tests, a p value <0.05 was considered statistically significant.
Results
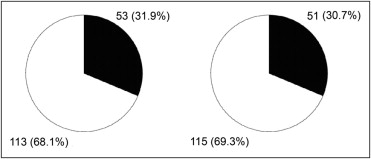
Baseline characteristics of the population are presented in Table 1 . According to the cut-off value of triplane TSI-derived Ts-SD-12 (≥33 ms), 68.1% of patients (n = 113) exhibited significant LV dyssynchrony at baseline. Based on the cut-off value for RT3D echocardiographic systolic dyssynchrony index (≥6.4%), 69.3% of patients (n = 115) exhibited significant preimplantation LV dyssynchrony ( Figure 2 ). Of interest, 57.2% of patients (n = 95) exhibited the 2 3D LV dyssynchrony criteria, 22.9% (n = 38) exhibited only 1 3D criterion, and 19.9% (n = 33) did not show any 3D criterion for LV dyssynchrony.
| Age (years) | 66 ± 9 |
| Men/women | 130/36 |
| Ischemic/nonischemic cause | 95 (57%)/71 (43%) |
| Sinus rhythm | 136 (81.9%) |
| QRS duration (ms) | 152 ± 32 |
| New York Heart Association class | |
| III | 153 (92.2%) |
| IV | 13 (7.8%) |
| 6-Minute walk test (m) | 346 ± 94 |
| Minnesota Living with Heart Failure Quality of Life score | 28 ± 17 |
| 3-Dimensional left ventricular end-diastolic volume (ml) | 199 ± 62 |
| 3-Dimensional left ventricular end-systolic volume (ml) | 147 ± 50 |
| 3-Dimensional left ventricular ejection fraction (%) | 27 ± 6 |
| Mitral regurgitation grades 3–4 | 25 (15%) |
| Triplane tissue synchronization imaging–derived SD of 12-segment time-to-peak velocities (ms) | 48 ± 26 |
| Real-time 3-dimensional echocardiographic systolic dyssynchrony index (%) | 8.51 ± 3.81 |
| Medication | |
| β Blockers | 130 (78.3%) |
| Angiotensin-converting enzyme inhibitor/angiotension receptor blocker | 154 (92.8%) |
| Diuretics/spironolactone | 135 (81.3%) |
At 6-month follow-up after CRT implantation, 62% of patients (n = 103) were responders and 38% (n = 63) were non-responders. Comparisons of different baseline variables between responders and nonresponders are presented in Table 2 .
| Variable | Responders (n = 103) | Nonresponders (n = 63) | p Value |
|---|---|---|---|
| Age (years) | 66 ± 9 | 67 ± 9 | 0.315 |
| Men/women | 81 (79%)/22 (21%) | 49 (78%)/14 (22%) | 0.929 |
| Ischemic cause | 49 (48%) | 46 (73%) | 0.001 |
| QRS duration (ms) | 151 ± 30 | 153 ± 36 | 0.789 |
| New York Heart Association class | 3.4 ± 0.2 | 3.5 ± 0.2 | 0.185 |
| 6-Minute walk test (m) | 355 ± 91 | 331 ± 96 | 0.136 |
| Minnesota Living with Heart Failure Quality of Life score | 28 ± 18 | 29 ± 18 | 0.784 |
| 3-Dimensional left ventricular end-diastolic volume (mL) | 203 ± 65 | 194 ± 57 | 0.320 |
| 3-Dimensional left ventricular end-systolic volume (mL) | 150 ± 54 | 142 ± 45 | 0.355 |
| 3-Dimensional left ventricular ejection fraction (%) | 27 ± 5 | 27 ± 6 | 0.997 |
| Mitral regurgitation grades 3–4 | 13 (13%) | 12 (12%) | 0.287 |
| Triplane tissue synchronization imaging-derived SD of 12-segment time-to-peak velocities (ms) | 58 ± 23 | 32 ± 22 | <0.001 |
| Real-time 3-dimensional echocardiographic systolic dyssynchrony index (%) | 9.86 ± 3.87 | 6.32 ± 2.47 | <0.001 |
Stay updated, free articles. Join our Telegram channel

Full access? Get Clinical Tree


