A published formula containing minimal aortic cross-sectional area and the flow deceleration pattern in the descending aorta obtained by cardiovascular magnetic resonance predicts significant coarctation of the aorta (CoA). However, the existing formula is complicated to use in clinical practice and has not been externally validated. Consequently, its clinical utility has been limited. The aim of this study was to derive a simple and clinically practical algorithm to predict severe CoA from data obtained by cardiovascular magnetic resonance. Seventy-nine consecutive patients who underwent cardiovascular magnetic resonance and cardiac catheterization for the evaluation of native or recurrent CoA at Children’s Hospital Boston (n = 30) and the University of California, San Francisco (n = 49), were retrospectively reviewed. The published formula derived from data obtained at Children’s Hospital Boston was first validated from data obtained at the University of California, San Francisco. Next, pooled data from the 2 institutions were analyzed, and a refined model was created using logistic regression methods. Finally, recursive partitioning was used to develop a clinically practical prediction tree to predict transcatheter systolic pressure gradient ≥20 mm Hg. Severe CoA was present in 48 patients (61%). Indexed minimal aortic cross-sectional area and heart rate–corrected flow deceleration time in the descending aorta were independent predictors of CoA gradient ≥20 mm Hg (p <0.01 for both). A prediction tree combining these variables reached a sensitivity and specificity of 90% and 76%, respectively. In conclusion, the presented prediction tree on the basis of cutoff values is easy to use and may help guide the management of patients investigated for CoA.
Cardiovascular magnetic resonance (CMR) has become the preferred noninvasive diagnostic tool for initial evaluation and late surveillance of patients with coarctation of the aorta (CoA). Besides morphologic criteria of severity, such as aortic narrowing relative to aortic diameter at the diaphragm level, hemodynamic evaluation is important for guiding therapeutic management. Peak pressure gradient can be estimated on the basis of a measurement of peak velocity by phase-contrast CMR and using the modified Bernoulli equation. Although phase-contrast CMR is of proved validity for the evaluation of pulsatile flow, its implementation for the evaluation of turbulent flow is subject to several important limitations and ultimately demonstrates poor correlation with directly measured transcatheter peak gradient measurements. Using a different approach, Nielsen et al used CMR data to derive a model containing minimal aortic cross-sectional area and flow deceleration rate in the descending aorta to predict transcatheter systolic pressure gradient ≥20 mm Hg, which is consistent with significant CoA according to the American College of Cardiology/American Heart Association and European Society of Cardiology guidelines. However, the resulting formula is not simple to use in clinical practice, and it has not been externally validated. As a result, the clinical utility of this important prediction model has been limited. In this study, we sought to (1) assess the diagnostic accuracy of the existing formula using an external data source, (2) refine the prediction model using pooled data from 2 institutions, and (3) create a clinically practical prediction tree to identify patients with severe CoA.
Methods
The study was approved by the institutional committee of human research and in accordance with Health Insurance Portability and Accountability Act regulations. This was a retrospective, cross-sectional, 2-center study. All consecutive patients who underwent CMR and cardiac catheterization (within 1 year of CMR) for the evaluation of CoA at the University of California, San Francisco (UCSF), from February 2000 through August 2009 (n = 49) and at Children’s Hospital Boston (CHB) from February 1997 through January 2001 (n = 31) were retrospectively reviewed in a pooled analysis. Minimal aortic cross-sectional area by gadolinium-enhanced 3-dimensional CMR angiography and flow profile in the descending aorta by phase-contrast CMR were available in patients from both institutions. The amount of collateral flow by velocity-encoded CMR was available only in the subset of patients from UCSF (n = 49). Details about the Boston patient population have been published previously. Of the latter, 1 patient was excluded because of missing flow acquisition in the descending aorta. The final study population consisted of 79 patients.
Scans were acquired at UCSF with 2 different 1.5-T scanners: (1) Achieva (Philips Medical Systems, Best, The Netherlands), using a 5-channel cardiac coil (n = 34), or (2) Signa CV/I (GE Medical Systems, Milwaukee, Wisconsin), using an 8-channel cardiac coil (n = 15). All patients underwent phase-contrast CMR in planes perpendicular to the proximal descending aorta (PDAo) just distal to the isthmus and the distal descending aorta (DDAo) at the level of the diaphragm, as previously described. On the Philips scanner, a 16-phase free-breathing sequence was performed in 30 patients (echo time 3.2 to 6.6 ms, repetition time 5.4 to 10.0 ms, matrix size 96 × 256, field of view 240 to 320 mm, slice thickness 5 to 10 mm, number of signals acquired 3) and a 40-phase breath-hold sequence in 2 patients (echo time 2.9 to 3.1 ms, repetition time 4.8 to 5.0 ms, matrix size 128 × 256, field of view 320 mm, slice thickness 8 mm, number of signals acquired 1). On the GE scanner, a 16-phase breath-hold sequence was performed in 8 patients (echo time 5.7 to 5.9 ms, repetition time 5.4 to 10.0 ms, matrix size 128 × 256, field of view 320 mm, slice thickness 8 mm, number of signals acquired 1) and a 30-phase breath-hold sequence in 5 patients (echo time 2.7 to 2.9 ms, repetition time 7.3 to 7.9 ms, matrix size 128 × 256, field of view 320 mm, slice thickness 8 mm, number of signals acquired 1). The encoding velocity value was individually adjusted according to the velocity of blood flow in the PDAo (200 to 600 cm/s). An encoding velocity of 200 cm/s was used for the DDAo. Three-dimensional CMR contrast-enhanced angiography in the sagittal plane was performed in all patients after the administration of intravenous gadolinium (0.1 mmol/kg body weight) (Magnevist; Bayer Schering Pharma, Leverkusen, Germany) at a rate of 2.0 ml/s. Typical imaging parameters on the Philips scanner were as follows: echo time 1.6 ms, repetition time 5.3 ms, matrix size 400 × 173, field of view 400 × 340, and number of signals acquired 1; those on the GE scanner were as follows: echo time 2.7 ms, repetition time 5.5 ms, matrix size 256 × 160, field of view 320 × 320, and number of signals acquired 0.5. The time delay between the start of contrast injection and image acquisition was determined by bolus tracking. Two breath-hold sequential acquisitions were performed, each lasting 20 to 30 seconds.
At CHB, all scans were acquired using a 1.5-T scanner (Signa Horizon LX with EchoSpeed or TwinSpeed gradient; GE Medical Systems). Details about the imaging protocol were described previously. Flow in the descending aorta was acquired in a single location at the level of the right pulmonary artery. When the flow signal in the descending aorta was incoherent because of the CoA flow jet, the acquisition was repeated perpendicular to the descending aorta at the level of the mid left atrium.
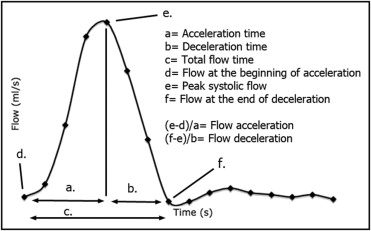
At UCSF, flow analyses were performed on dedicated workstations (VPRO, Philips Medical Systems; and ReportCARD, GE Medical Systems). The following measurements were done: estimation of the amount of collateral flow by subtracting the net forward flow at the level of DDAo from the net forward flow at the level of the PDAo (collateral flow = net forward flow DDAo − net forward flow PDAo). Collateral flow was then expressed as the percentage of flow increase from the PDAo to the DDAo, [percentage of flow increase = (amount of collateral flow/net forward flow PDAo) × 100], as previously described. The flow profile at the level of the DDAo was analyzed by measuring the following parameters as previously proposed by Nielsen et al ( Figure 1 ) : (1) acceleration time, (2) deceleration time, (3) total flow time, (4) flow at the beginning of acceleration, (5) peak systolic flow, and (6) flow at the end of deceleration. Mean flow acceleration and mean flow deceleration were then calculated as follows: (1) mean flow acceleration = [(peak systolic flow) − (flow at the beginning of flow acceleration)/acceleration time]; (2) mean flow deceleration = [(flow at the end of deceleration − peak systolic flow)/deceleration time]. All these time-dependent variables were adjusted to heart rate using Bazett’s formula: 1/(RR interval) 0.5 .
On the basis of 3-dimensional contrast angiography, the minimal cross-sectional area at the site of CoA was measured by planimetry, as previously described by Nielsen et al. The minimal cross-sectional area was then adjusted to body surface area.
At CHB, flow analyses were performed using a dedicated workstation (FLOW 2.0; Medis Medical Imaging, Leiden, The Netherlands) as described previously. However, flow quantification in the descending aorta was done only at the level of the right pulmonary artery. Therefore, collateral flow was not measured. Minimal cross-sectional area at the site of CoA adjusted to body surface area was measured as described previously.
Continuous data are presented as median (range). Categorical data are presented as numbers and percentages. Differences in baseline characteristics between patients with and without severe CoA, as well as between patients included at CHB and UCSF, were tested using Mann-Whitney U tests for continuous data and Fisher’s exact tests for categorical data. The diagnostic formula of Nielsen et al, obtained from the subset of patients investigated at CHB, was applied in the patient population investigated at UCSF: log[p/(1 − p)] = 6.69 − (0.0485 × smallest indexed aortic cross-sectional area) + (0.00506 × heart rate–corrected mean deceleration), where p is the probability (>0.38) of a CoA gradient ≥20 mm Hg. Sensitivity, specificity, positive and negative predictive values, and misclassification rates were calculated. In the second step, the patient data from the 2 institutions were pooled, and a logistic regression analysis was performed to explore the relations between the hemodynamic severity of CoA and potential CMR predictor variables. The odds ratio and the area under the receiver-operating characteristic curve were calculated for each variable. Stepwise multivariate logistic regression analysis with forward selection was performed to identify independent predictors of CoA gradient ≥20 mm Hg, using a p value ≤0.05 for inclusion in the model. In a separate analysis, recursive partitioning was then used to develop a clinical prediction tree providing the best fit of sensitivity and specificity at predicting CoA gradient ≥20 mm Hg. A p value ≤0.05 was considered statistically significant. Analyses were performed using a commercially available statistical package (SPSS version 16.0; SPSS, Inc., Chicago, Illinois).
Results
Characteristics of the pooled study population are listed in Table 1 . Overall, >1/2 the patients had transcatheter systolic pressure gradients ≥20 mm Hg.
| Variable | Coarctation Gradient (mm Hg) | p Value ⁎ | |
|---|---|---|---|
| <20 (n = 31) | ≥20 (n = 48) | ||
| Age (years) | 16.6 (0.52–48.4) | 15.5 (3.6–50.8) | 0.43 |
| Interval between CMR and catheterization (days) | 44 (0–348) | 35 (20–80) | 0.64 |
| Body surface area (m 2 ) | 1.72 (0.29–2.34) | 1.62 (0.67–2.40) | 0.21 |
| Native coarctation | 10 (32%) | 26 (54%) | 0.06 |
| Peak pressure gradient (mm Hg) | 10 (3–18) | 35 (20–80) | <0.001 |
| Cardiac index (L · min −1 · m −2 ) | 3.2 (1.6–5.0) | 3.4 (1.9–7.8) | 0.81 |
There were no significant differences between patients with and without gradients ≥20 mm Hg regarding age, body surface area, and cardiac index ( Table 1 ). Patients with severe CoA were slightly more likely to have native CoA (statistical trend). We did not find any significant differences in baseline characteristics between patients included at UCSF and those at CHB (data not shown).
Validation analysis was performed by applying the formula of Nielsen et al, obtained on the subset of patients investigated at CHB, to the patient population investigated at UCSF (n = 49). This analysis demonstrated a misclassification rate of 17%, with sensitivity and specificity of 82% and 85%, respectively. Positive and negative predictive values were 89% and 77%, respectively.
Univariate and multivariate CMR-derived predictors of CoA gradient ≥20 mm Hg from the pooled patient population are listed in Tables 2 and 3 , respectively. On univariate analysis, rate-corrected flow deceleration time in the descending aorta and indexed minimal aortic cross-sectional area were the strongest predictors, and both independently predicted CoA gradient ≥20 mm Hg in the multivariate model. On the basis of these 2 variables a prediction model was created: log [p/(1 − p)] = −2.91 − (0.46 × indexed minimal cross-sectional area [cm 2 /m ) + (0.20 × heart rate–corrected flow deceleration time [s 0.5 ]), where p is the probability of a CoA gradient ≥20 mm Hg. A predicted probability of 0.35 reached sensitivity of 94% and specificity of 68%. The positive and negative predictive values were 82% and 89%, respectively.
| Predictor Variable | OR (95% CI) | Area Under the ROC Curve | p Value |
|---|---|---|---|
| Indexed minimal aortic cross-sectional area (10 mm 2 /m 2 increase) | 0.56 (0.43–0.73) | 0.85 | <0.01 |
| Rate-corrected flow duration (0.01-s 0.5 increase) | 1.17 (1.08–1.27) | 0.84 | <0.01 |
| Rate-corrected acceleration time (0.01-s 0.5 increase) | 1.09 (0.99–1.20) | 0.61 | 0.08 |
| Rate-corrected deceleration time (0.01-s 0.5 increase) | 1.26 (1.13–1.41) | 0.88 | <0.01 |
| Rate-corrected mean flow deceleration (100 ml/s 1.5 increase) | 1.79 (1.38–2.34) | 0.83 | <0.01 |
| Rate-corrected mean flow acceleration (100 ml/s 1.5 increase) | 0.81 (0.71–0.92) | 0.72 | <0.01 |
| Percentage of flow increase | 1.03 (0.99–1.06) | 0.69 | 0.06 |
Stay updated, free articles. Join our Telegram channel

Full access? Get Clinical Tree


