Positron Emission Tomography
Markus Schwaiger
Sibylle Ziegler
Overview
Positron emission tomography (PET) and PET in combination with computed tomography (PET/CT) represent the most advanced scintigraphic imaging technique developed for in vivo quantification of cardiac physiology and biochemistry. The state-of-the-art PET instrumentation allows delineation of regional tracer activity with high spatial (4–8 mm) and temporal resolution (few seconds per image). The combination of PET and multidetector CT integrates structural and biological imaging for a comprehensive evaluation of cardiac disease. A large number of radiopharmaceuticals have been developed to study myocardial perfusion, energy metabolism, and autonomic innervation of the heart. Initial research applications included assessment of fatty acid and glucose metabolism, followed by the quantification of regional myocardial perfusion in patients with coronary artery disease (CAD). More recently, newer tracers such as radiolabeled β receptor antagonists allow the pre- and postsynaptic evaluation of sympathetic cardiac innervation. Metabolic imaging with F-18 deoxyglucose has emerged as important clinical application for the assessment of tissue viability in patients with impaired left ventricular function with well-validated diagnostic and prognostic information. PET/CT in combination with short-lived perfusion tracers provides accurate diagnosis and localization of CAD and in the future plaque imaging. The development of new radiopharmaceuticals for molecular tissue characterization is expected to ensure that PET and PET/CT remain competitive clinical and research tools in cardiology.
Glossary
PET
Positron emission tomography.
CT
X-ray computed tomography.
SPECT
Single photon emission computerized tomography.
Transmission scan
Measurement of photon attenuation using external sources. Data are used for correction of emission data.
Polar map
Planar representation of tracer accumulation in the left ventricular myocardium, determined by volumetric sampling of the scintigraphic data.
Tracer
Very small amount of substance, labeled with a radioactive isotope, and the decay can be detected externally.
F-18
Fluorine-18.
C-11
Carbon-11.
N-13
Nitrogen-13.
O-15
Oxygen-15.
Rb-82
Rubidium-82.
FDG
Fluorodeoxyglucose can be labeled with F-18.
HED
Hydroxyephedrine, can be labeled with C-11.
Historical Perspective
PET was developed as a noninvasive method for quantitative imaging of tissue tracer distribution in vivo. Three important technical requirements contribute to this method: the labeling of a biological substance with short-lived positron emitters, the detection of the annihilation radiation, and the reconstruction of 3-dimensional tracer distribution in the body. Radiopharmacy, instrumentation, and data processing have evolved over the last 70 years since the discovery of artificial radioactivity by Curie and Joliot in 1934. Radioactive isotopes such as C-11, N-13, or F-18 became available in the late 1930s and early 1940s after the development of the cyclotron by Lawrence and were used in biological (1) and first human studies (2). The advantage of using coincidence measurements for collimation became apparent and was implemented for the first time in a positron probe by Brownell and Sweet (3) and in a positron scanner for brain studies by Aronow (4). With the tomographic imaging of single photon emitters, Kuhl and Edwards introduced transverse section scanning using a backprojection algorithm in 1963 (5). These advances in reconstruction also promoted
the development of tomographs for positron imaging in the early 1970s, when the research group of Hoffman, Phelps, and Ter Pogossian at Washington University built the first positron emission tomograph for brain imaging (6,7).
the development of tomographs for positron imaging in the early 1970s, when the research group of Hoffman, Phelps, and Ter Pogossian at Washington University built the first positron emission tomograph for brain imaging (6,7).
PET was introduced in the 1970s as a new imaging modality in cardiology by investigators at Washington University in St. Louis (8). Initial studies employed metabolic tracers such as F-18 deoxyglucose and C-11 palmitate for the noninvasive characterization of myocardial substrate metabolism. With the introduction of flow markers such as N-13 ammonia and O-15 water, the application of PET shifted toward the evaluation of myocardial perfusion primarily in patients with CAD.
Quantitative PET requires a transmission measurement for the correction of photon attenuation. Thus, the combination of CT with PET in one device not only offered the combination of functional and anatomical information, but also the potential of reducing total scanning time. Townsend and his group at the University of Pittsburgh first realized the combination of both imaging modalities in the late 1990s (9,10). PET/CT imaging has rapidly gained acceptance in the oncology community by providing not only efficient measurements of attenuation, but also by allowing the integration of morphologic and metabolic information for detection, staging, and therapy control (11). The intention of using multidetector CT exclusively for attenuation correction is being increasingly replaced by the concept of applying both, PET and CT, at their fullest diagnostic potential, which opens new diagnostic strategies in cardiology.
This chapter reviews the current role of PET and PET/CT in the functional evaluation of CAD, and other cardiovascular disorders. Established clinical applications, as well as experimental concepts, are discussed. Finally, the results obtained with PET and PET/CT are compared with those derived from other imaging modalities to define the clinical role of PET in cardiology.
Imaging Principles
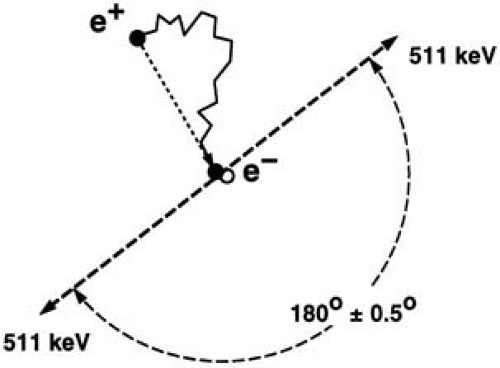
After emission from the nucleus, positrons travel a short distance and quickly decay by annihilation with an electron. Positron and electron mass are converted into energy and a pair of γ rays is generated. Conservation of energy and momentum require the γ rays to travel in nearly opposite directions (180 degrees apart) with an energy of 511 keV each (Fig. 55.1). They can be detected by using pairs of collinearly aligned detectors. The detector pairs of a PET system are installed in a ringlike pattern, which allows measurement of radioactivity along lines through the organ of interest at a series of angles and radial distances. This angular information is used to reconstruct tomographic images of regional radioactivity distribution.
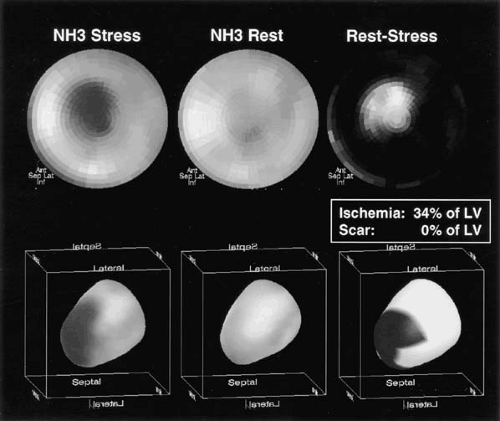
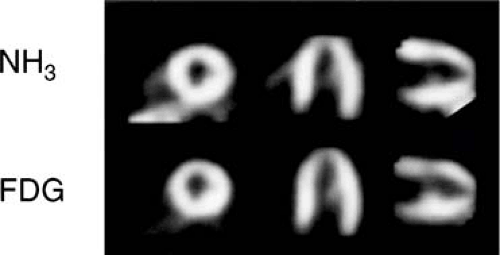 FIGURE 55.2. Positron emission tomographic images of normal volunteer with nitrogen-13 ammonia (NH3) and fluorine-18 fluorodeoxyglucose (FDG). |
Because the left ventricular wall is about 10 mm thick, high spatial resolution is necessary for the quantitative analysis of tissue tracer concentration (Fig. 55.2). The spatial resolution of PET approaches 5 to 7 mm in all axes and is expected to improve to about 2 to 3 mm in the future. High spatial resolution is of utmost importance for the detection of activity within small structures such as the coronary vessel wall. Based on a vessel wall thickness of about 1 to 2 mm, the recovery of activity information requires a high biological contrast, even when a system resolution of 3 mm can be reached: Myocardial movement and change in wall thickness during the cardiac cycle also affect the image resolution. Thus, PET data quality can be improved by ECG gated acquisitions, providing not only motion correction but also measurements of regional and global left ventricular function (12).
The PET detector system has to perform linearly over a wide range of count rates, and allow for short scan time intervals to monitor the rapid uptake and release of tracers. Most of the current commercial tomographs employ block detectors made of scintillation crystals (bismuth germanate) and photomultiplyer tubes (13). New detector materials such as lutetium oxyorthosilicate and gadolinium oxyorthosilicate improve imaging performance at a reasonable cost (14).
Correction of photon attenuation is a prerequisite for tracer distribution measurements in the heart to avoid artifacts caused by tissue surrounding the heart. External sources are used to perform a transmission scan, which allows estimates of regional attenuation factors. Rotating rod sources made of positron emitters are used for this purpose (15,16). With PET/CT the CT information can be used for attenuation correction in PET. CT images of the chest require only a few seconds using multidetector CT instrumentation and low-dose CT images can be generated with good spatial resolution while minimizing radiation exposure to less than 1 mSv. However, as the attenuation factors for 511 keV have to be extrapolated from low-energy x-ray measurements conversion factors have to be employed for different tissue densities (e.g., heart, lung, and bone) (17). In addition, coregistration of data becomes an important part of attenuation correction using CT because transmission and PET emission data acquisition are performed separately. The CT acquisition is completed within few seconds; PET data are collected over several minutes. Ongoing methodologic research is concerned with optimizing CT-based PET attenuation correction.
Principles of Radionuclide Production and Radiochemistry
Carbon-11, nitrogen-13, oxygen-15, and fluorine-18 are the most common positron-emitting radionuclides, all of which
have a short physical half-life ranging from 122 seconds for oxygen-15 to 110 minutes for fluorine-18 (Table 55.1).
have a short physical half-life ranging from 122 seconds for oxygen-15 to 110 minutes for fluorine-18 (Table 55.1).
TABLE 55.1 Tracers Commonly Available for Cardiac PET Applications | ||||||||||||||||||||||||||||||||||||||
|---|---|---|---|---|---|---|---|---|---|---|---|---|---|---|---|---|---|---|---|---|---|---|---|---|---|---|---|---|---|---|---|---|---|---|---|---|---|---|
| ||||||||||||||||||||||||||||||||||||||
The predominant and most efficient production method of these isotopes is to modify the nuclear structure of specific stable radionuclides by accelerated particle bombardment with either protons or deuterons. A cyclotron is a particle accelerator employed most often for radioisotope production in PET imaging (18,19). Few positron-emitting radionuclides such as rubidium-82 are generator produced. A generator consists of a parent–daughter radionuclide pair in an apparatus, which permits a separation and extraction of the daughter compound from the parent.
Because there are positron-emitting radionuclides of oxygen, carbon, and nitrogen, it is theoretically possible to label any organic compound of interest, whether it is a natural substance or a synthetic drug. Fluorine, although not often found in naturally occurring molecules, can be readily substituted for a hydrogen or hydroxyl group, and is a favorite of radiochemists designing new pharmaceuticals. With these four radionuclides, a large number of positron-emitting tracers can be synthesized and used in clinical studies (20).
Assessment of Myocardial Blood Flow
Flow Tracer
Blood flow tracers can be classified based on their physiologic behavior. Oxygen-15 water, for example, represents a freely diffusible tracer, which washes in and out of myocardial tissue as a function of blood flow. The first pass extraction of O-15 water in the heart is neither diffusion limited, nor is O-15 water tissue extraction affected by any metabolic pathways (21,22,23) (Fig. 55.3).
The second group of flow markers are radiotracers, which are retained in myocardial tissue proportional to myocardial blood flow. For these radiopharmaceuticals, the initial tracer extraction (first-pass extraction) and their tissue retention are important factors defining their suitability as blood flow tracers. N-13 ammonia is highly extracted by myocardial tissue in the form of N-13 ammonia (24,25,26). Within the tissue, the tracer can either back diffuse into the vascular space or be trapped in the form of N-13 glutamine.
Ionic tracers such as rubidium-82, rubidium-81, or potassium-38 display similar tracer kinetics to thallium-201 (27,28,29). Initial extraction of these compounds ranges between 50% and 70%. For both N-13 ammonia retention and ionic tracer extraction, a nonlinear relationship exists between blood flow and tissue tracer extraction (27,30). For methodologic details of myocardial flow measurements by PET please refer to an excellent recent review by Kaufmann (31).
Clinical Application
Qualitative Assessment of Regional Myocardial Blood Flow
Initial applications of PET for the detection of CAD consisted of the visual assessment of regional myocardial tracer distribution under rest and stress conditions (32,33,34,35,36,37). In most studies, pharmacologic stress testing with adenosine or dipyridamole has been employed to assess coronary reserve (32). The advantage of this approach is the standardized stress procedure, which can be performed in the PET gantry without moving the patient between rest and stress imaging (38).
The most commonly used tracers are rubidium-82 and N-13 ammonia (24,36). With rubidium-82, the rest/stress
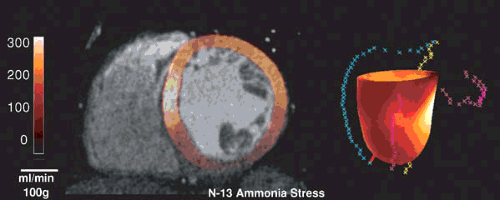
protocol can be completed in about 1 hour, whereas N-13 ammonia blood flow studies require about 2 hours. Extensive clinical data exist with both radiopharmaceuticals to document the high diagnostic accuracy with sensitivity and specificity values ranging from 83% to 95% (Table 55.2). Most studies employed visual data analysis similar to the methods used routinely for thallium-201 or technetium-99m sestamibi single photon emission computerized tomography (SPECT) imaging (25,33,34,39). Automated techniques for semiquantitative data analysis, similar to those used for SPECT imaging, have also been developed for PET flow studies (40,41) (Fig. 55.4). A number of studies have demonstrated the superiority of PET–Rb-82 compared to SPECT imaging (33,34,39,42). Combining the perfusion pattern with CT assessment of coronary calcification or CT angiography—as now possible with PET/CT—provides a comprehensive examination addressing structural and functional aspects of CAD (Fig. 55.5) (43,44). Future studies have to define the diagnostic and prognostic gain of the combined evaluation of coronary calcification, coronary angiography and myocardial perfusion.
protocol can be completed in about 1 hour, whereas N-13 ammonia blood flow studies require about 2 hours. Extensive clinical data exist with both radiopharmaceuticals to document the high diagnostic accuracy with sensitivity and specificity values ranging from 83% to 95% (Table 55.2). Most studies employed visual data analysis similar to the methods used routinely for thallium-201 or technetium-99m sestamibi single photon emission computerized tomography (SPECT) imaging (25,33,34,39). Automated techniques for semiquantitative data analysis, similar to those used for SPECT imaging, have also been developed for PET flow studies (40,41) (Fig. 55.4). A number of studies have demonstrated the superiority of PET–Rb-82 compared to SPECT imaging (33,34,39,42). Combining the perfusion pattern with CT assessment of coronary calcification or CT angiography—as now possible with PET/CT—provides a comprehensive examination addressing structural and functional aspects of CAD (Fig. 55.5) (43,44). Future studies have to define the diagnostic and prognostic gain of the combined evaluation of coronary calcification, coronary angiography and myocardial perfusion.
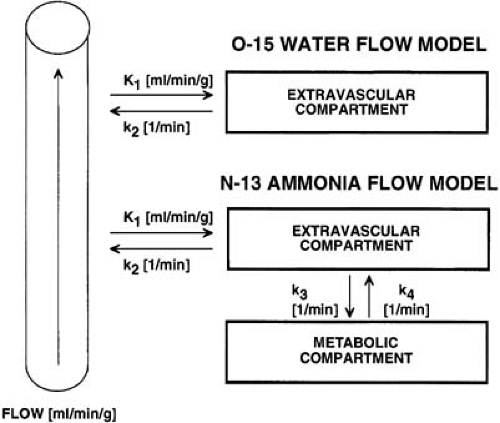 FIGURE 55.3. Diagram illustrating the compartment models for oxygen-15 water (top) and nitrogen-13 ammonia (bottom). |
TABLE 55.2 Diagnostic Performance of Positron Emission Tomography Flow Determinations | ||||||||||||||||||||||||||||||||||||||||
|---|---|---|---|---|---|---|---|---|---|---|---|---|---|---|---|---|---|---|---|---|---|---|---|---|---|---|---|---|---|---|---|---|---|---|---|---|---|---|---|---|
| ||||||||||||||||||||||||||||||||||||||||
Demer et al. (37) demonstrated that the severity of perfusion abnormalities determined by PET imaging correlated with the angiographically predicted coronary reserve measurements for a given vascular territory. Gould et al. (45) reported a significant gradient in regional perfusion from base to apex in patients with mild but diffuse arteriographic disease, suggesting greater downstream flow abnormalities in the absence of regional limiting stenoses.
In addition to the diagnosis of CAD, the follow-up of patients with CAD by noninvasive means is of clinical interest (46). Longitudinal studies evaluating the effect of therapeutic or life-style interventions provide objective outcome criteria and are especially important in patients considered at high risk for progression of disease severity (47).
Quantitative Assessment of Myocardial Blood Flow
The potential of PET for the quantitative assessment of myocardial blood flow represents a major advantage over SPECT and magnetic resonance (MR) imaging. Such measurements provide flow estimates in milliliters per minute per 100 g of tissue, which can be used to assess myocardial microcirculation under resting and stress conditions as well as before and after pharmacologic interventions. For such flow measurements dynamic data acquisition is necessary to describe arterial input function as well as tissue response.
O-15 Water
Oxygen-15 water can be administered either as bolus injection or O-15 labeled CO2 inhalation (22,23,48,49). Radiolabeled CO2 is rapidly converted to water in lung tissue and transported to the heart as O-15 water. Both approaches
use the uptake as well as washout of radioactivity from the myocardium assuming a constant partition coefficient (0.80–0.90) of water between vascular and tissue space (Fig. 55.3). The water method also assumes homogeneous tissue within the region of interest used for quantitation of myocardial blood flow. To delineate myocardial tissue boundaries, the blood pool contribution has to be removed from O-15 water studies. For this purpose, a separate inhalation of O-15 labeled CO is commonly employed (23). More recently, factor analysis of dynamic O-15 water has been shown to allow for delineation of myocardial structures (50,51). The tracer kinetic model approach for O-15 water flow measurement includes a term correcting for the geometric distortion due to limited image resolution provided by PET (partial volume effect, activity cross-contamination) (21,23,52). The use of O-15 water (as a blood flow marker) has been validated in various animal models, and has demonstrated close agreement with microsphere flow measurements (52,53,54). Correction of flow values with the perfused tissue fraction leads to a determination of an index describing the relative amount of perfused tissue within a myocardial segment (55). In addition, methods have been developed to quantify not only flow, but also oxygen metabolism using O-15 tracer (56).
use the uptake as well as washout of radioactivity from the myocardium assuming a constant partition coefficient (0.80–0.90) of water between vascular and tissue space (Fig. 55.3). The water method also assumes homogeneous tissue within the region of interest used for quantitation of myocardial blood flow. To delineate myocardial tissue boundaries, the blood pool contribution has to be removed from O-15 water studies. For this purpose, a separate inhalation of O-15 labeled CO is commonly employed (23). More recently, factor analysis of dynamic O-15 water has been shown to allow for delineation of myocardial structures (50,51). The tracer kinetic model approach for O-15 water flow measurement includes a term correcting for the geometric distortion due to limited image resolution provided by PET (partial volume effect, activity cross-contamination) (21,23,52). The use of O-15 water (as a blood flow marker) has been validated in various animal models, and has demonstrated close agreement with microsphere flow measurements (52,53,54). Correction of flow values with the perfused tissue fraction leads to a determination of an index describing the relative amount of perfused tissue within a myocardial segment (55). In addition, methods have been developed to quantify not only flow, but also oxygen metabolism using O-15 tracer (56).
N-13 Ammonia
Several approaches have been introduced to describe the myocardial kinetics of N-13 ammonia using a compartmental model, which relates the N-13 activity in the vascular, the free intracellular, and the metabolic space (57,58,59) (Fig. 55.3). Assuming the first transit extraction of N-13 ammonia is approximately 100%, the model estimate serves as a quantitative index of perfusion (F = K1 × EF) (24). These methods have been validated in the animal laboratory comparing N-13 ammonia perfusion measurements with microsphere measurements as a gold standard, or with O-15 reference PET measurements (53,59,60).
Other Tracers (Rubidium-82, Copper-62 PTSM, Potassium-38)
Rubidium-82 has been proposed for quantitative flow measurements (61,62). Data in the animal model and preliminary clinical results demonstrate the feasibility of using this radiopharmaceutical for quantitative flow measurements. Copper-62 PTSM has also been employed for the assessment of myocardial blood flow (63).
Clinical Application
The quantitation of regional coronary flow reserve (CFR) has been advocated by Gould et al. (64) for the functional assessment of the severity of coronary artery stenosis in patients with CAD. The parameter flow reserve describes not only the functional significance of a given coronary lesion but also vascular reactivity and collateral blood flow in the poststenotic vascular territories. Such functional measurements complement the anatomic description of CAD and link the morphologic alterations of epicardial arteries with perfusion patterns assessed at the level of microcirculation. Limitations of angiographic characterization of CAD are widely appreciated owing to the complex three-dimensional nature of atherosclerotic plaques as well as considerable interobserver variability in angiographic data interpretation (46,64,65,66).
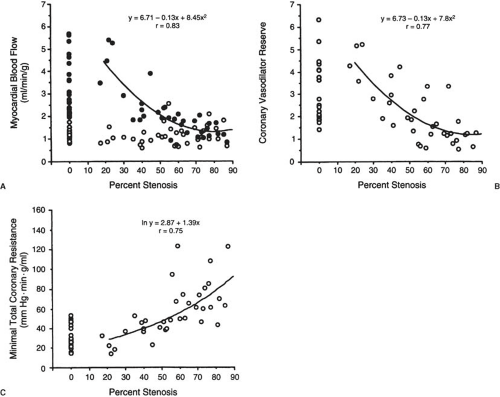
PET blood flow measurements have been extensively validated in animals and in healthy volunteers. There is good reproducibility of blood flow measurements under resting as well as stress conditions in volunteers and patients with CAD, as shown by the consistent measurements of coronary reserve values (67,68). In patients with CAD, CFR measurements are reduced (69,70,71,72,73). A correlation between the severity of CAD and severity of flow reserve impairment has been documented in several studies (69,72,73,74,75) (Fig. 55.6).
CFR over 2.5 times resting flow must be considered “normal” based on the standard deviation of measurements in individuals at low likelihood of CAD (69,76).
A relationship between coronary reserve measurements and age in subjects without CAD has been demonstrated (77,78,79). However, there are other factors, such as left ventricular hypertrophy, hypertension, as well as syndrome X that may affect coronary reserve measurements in the absence of vascular abnormalities defined by angiography (31,80). Animal and clinical data have indicated that arterial hypertension leads to reduced CFR. It also has been shown, using PET, that therapy of patients with arterial hypertension may improve regional coronary reserve measurements (81). Therefore, quantitative regional flow measurements may be useful monitor pharmacologic interventions as well as to assess the effect of regional revascularization by PCI and surgery (82,83,84,85,86,87,88,89,90).
Detection of Early Coronary Artery Disease by Flow Measurements
Comparing the incidence of abnormal CFR with the severity of stenosis, as defined by quantitative angiography, reveals a very high sensitivity of CFR measurements for the detection of severe coronary artery stenosis (>95%) (91,92). The high incidence (about 30%) of abnormal CFR in territories with only mild CAD is surprising as defined by angiography (76). These data have been confirmed by several laboratories, indicating that CFR with pharmacologic stress agents may provide more sensitive means to detect early CAD than angiographic criteria alone (69,93). This hypothesis has been addressed by several investigators (94,95,96,97) who have demonstrated that CFR in asymptomatic male patients without clinical evidence of myocardial ischemia, but at high risk for the development of CAD based on risk factor profile
was abnormal. A significant relationship between the impairment of CFR and plasma cholesterol, low-density lipoproteins, high-density lipoprotein, and oxidized low-density lipoprotein (oxLDL) has been reported. CFR has been shown to be reduced in young men with familial hyperlipidemia, especially with combined abnormalities in cholesterol and triglyceride serum levels (phenotype IIB) (98). Furthermore, reduction of flow reserve has been observed in asymptomatic patients with insulin-dependent and non–insulin-dependent diabetes mellitus (94). The pathophysiologic mechanism of the reduced CFR in territories with no or only mild angiographic evidence of stenoses is not yet known, but may represent complex interplay of vascular alterations, as well as endothelial dysfunction (99).
was abnormal. A significant relationship between the impairment of CFR and plasma cholesterol, low-density lipoproteins, high-density lipoprotein, and oxidized low-density lipoprotein (oxLDL) has been reported. CFR has been shown to be reduced in young men with familial hyperlipidemia, especially with combined abnormalities in cholesterol and triglyceride serum levels (phenotype IIB) (98). Furthermore, reduction of flow reserve has been observed in asymptomatic patients with insulin-dependent and non–insulin-dependent diabetes mellitus (94). The pathophysiologic mechanism of the reduced CFR in territories with no or only mild angiographic evidence of stenoses is not yet known, but may represent complex interplay of vascular alterations, as well as endothelial dysfunction (99).
Most recently, Mauriello et al. (100) demonstrated that inflammatory processes involve larger segments of the coronary tree than appreciated by the structural changes occurring in coronary plaques. Plaque rupture may be a regional appearance of an inflammatory process affecting the entire coronary artery. Endothelial dysfunction may be a sensitive marker for vascular inflammation. This hypothesis is supported by the observation that CFR is reduced in remote vascular territories of patients suffering acute myocardial infarction (101).
The hemodynamic response to dipyridamole or adenosine can be modified by α- or β-receptor blockade, enhancing the range of coronary flow measurements (102,103). First results employing cold pressor stress testing in combination with PET confirm the results obtained in the catheterization laboratory using intracoronary acetylcholine infusion (104,105). Several investigators have observed a relationship between vascular reactivity to acetylcholine and prognosis in patients with CAD (106,107). Most recently, Schindler et al. (108) demonstrated that a reduced PET flow response to sympathetic stimulation is associated with impaired prognosis. In addition, mental stress has been used to investigate coronary vascular reactivity in normal and CAD patients, which demonstrated reduced flow response in this patient group (109).
PET measurements have been employed to assess the acute and chronic effects of smoking on dipyridamole-induced flow changes. Smoking during the PET study decreased the dipyridamole-induced hyperemia and coronary reserve (97


Stay updated, free articles. Join our Telegram channel

Full access? Get Clinical Tree


