Pitfalls in the Evaluation of Hemodynamic Data
Zoltan G. Turi
Acquisition of cardiac catheterization hemodynamic data has been revolutionized by the automation of hemodynamic measurement and recording since the first edition of this book was published. For the pioneers who worked in the middle part of the 20th century, assessment of intravascular and intracardiac pressures required far more than just development of catheters and methods to access the various cardiac chambers. Much time was spent dealing with fundamental flaws in the equipment used for pressure measurement (see Chapter 10). Transducers had inherently unstable electronic circuits, and they required repeated rebalancing to barometric pressure—by convention, the “zero” pressure that is the baseline for all hemodynamic recordings. Transducer drift also meant that calibration had to be performed, typically against mercury manometers, at least once per case if not more often. In addition, characteristics of the mechanical recording systems interfered with accurate recording of waveforms. In the modern era, pressure transducers are disposable, published drift is theoretically only 1 mmHg per 8 hours of use, and assumed error rates are <2%; in practice, the actual mean calibration error is <0.1 ± 0.8%.1 Modern recording systems have eliminated a slew of mechanical errors introduced by the use of analog pen on paper or even needle on drums (the kymograph) covered by a layer of carbon (see Chapter 10, Figure 10.2). Unfortunately, in the wake of automation, accuracy still requires attention to basics that are largely no longer taught, and as a result the modern cardiac catheterization laboratory can generate reams of sometime useless and occasionally wholly erroneous data. This chapter will highlight a variety of pitfalls in hemodynamic measurements.
BASIC CONCEPTS
There are several categories of potential error in cardiac hemodynamic measurements. First, artifacts can be induced by mechanical or operator errors, including unrecognized transducer failure, incorrect transducer positioning, inadequate balancing, and under- or overdamping. Second, and probably more significant, is misinterpretation of recordings, including failure to recognize catheter location (e.g., pulmonary wedge versus pulmonary artery); failure to understand the influence of loading conditions; and failure to understand the implications of incorrectly recorded tracings. Finally, standardized software provided with hemodynamic recording equipment assumes that each laboratory follows the common practices of data acquisition, which may not always be a valid assumption, thus resulting in erroneous reporting.
As an example of the first category, the hemodynamic tracings in Figure 14.1 show right atrial pressures that reflect normal hemodynamics and moderate or severe right heart pressure elevation in the setting of constrictive physiology with a steep Y descent. The mean RA pressures are 6, 17, and 24 mmHg, respectively. Importantly, they were all taken within 1 minute of each other, and merely reflect zeroing of the transducer at heights above, at and below the patient’s right atrium. Few laboratories use the leveling stick required to get this right as depicted in Chapter 10. The most compulsive laboratories measure the anterior-posterior diameter of the patient’s chest and place the manifold at half this distance above the top of the catheterization table. Even this approach has been a subject of debate: it may be more appropriate to
place the transducer at the level of the top of the chamber the pressure of which is being measured, resulting in a difference of several mmHg depending on the vascular structure being assessed.2
place the transducer at the level of the top of the chamber the pressure of which is being measured, resulting in a difference of several mmHg depending on the vascular structure being assessed.2
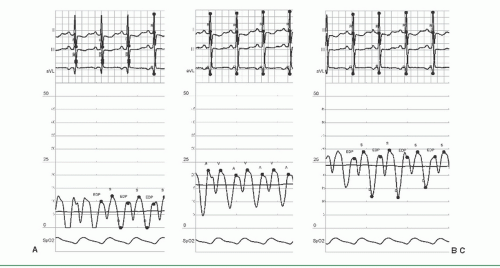 Figure 14.1 A, B, C. Three sets of right atrial pressures in a patient with severe aortic stenosis and radiation-induced pericardial disease s/p pericardiectomy. The panels reveal normal, moderately elevated, and severely elevated right atrial pressures, all recorded on a 5 mmHg scale. The tracings were taken a few seconds apart, with the transducers positioned above, at, and below the level of the patient’s heart. Failure to compulsively align the transducer with the level of the patient’s heart produces substantial error in hemodynamic recordings. Note the steep Y descent, which falsely appears to have an excursion below zero in the tracing at left (A). |
Failure to adequately balance transducers results in the very common recording of negative diastolic pressures, largely a physiologic impossibility, in the cath lab. Grossly negative diastolic pressures are not possible under ordinary physiological circumstances. Negative left ventricular end-diastolic pressure would reflect net reversal of blood flow. Figure 14.2A shows hemodynamics of a patient with a newly diagnosed dilated cardiomyopathy presenting with heart failure, dutifully interpreted as an LVEDP of -1 mmHg. Figures 14.2B and C show the effect of recording left ventricular pressure through compliant tubing and with damping due to air in the line, respectively. Figures 14.2D and E show the difference between high-fidelity micromanometertipped catheter recordings and fluid-filled catheter recordings; micromanometer catheter recordings are primarily used for research purposes, even though they provide much more accurate data.
Finally, an example of generic assumptions made by software vendors is the recording of left ventricular versus systemic pressure in a patient with aortic stenosis (Figure 14.3A). The tracing grossly underestimates the gradient and shows systemic pressure rising before left ventricular contraction, a physiologic impossibility.3
TRANSVALVULAR GRADIENT
The common reliance on valve gradients to assess severity of valve disease ignores the role of loading conditions, systolic and diastolic filling periods, and transvalvular flow on the gradient measurement. Examples in Figure 14.5 show underestimation of the severity of valvular stenosis in the setting of volume depletion and sedation, corrected by volume infusion and exercise, respectively. This patient had severe mitral stenosis by clinical assessment and noninvasive imaging. She was given no fluids after midnight and was not catheterized until late afternoon, thereby leading to dehydration combined with decreased cardiac output in the setting of sedation. Infusion of only 100 mL of saline and exercise consisting of lifting 1 L IV bags with both arms, respectively, were sufficient to demonstrate the hemodynamic alternations shown in the figure. The disproportionate rise in gradient associated with increasing heart rates in mitral stenosis reflects the disproportionate fall in the diastolic filling period that occurs simultaneously; this is seen even with mild mitral stenosis and includes rise in left atrial pressure, gradient, and pulmonary artery pressure.4 The relationship of gradient to valve area is shown in Chapter 13, Figures 13.2 and 13.4. Even in the normal range of valve areas, there is a minimal gradient induced by very high cardiac outputs, reflecting the intrinsic size of the valvular annulus. With increasing flow across the valve, exponential rises are noted with fixed severe stenosis, whereas in the setting of mild to moderate disease, further opening of the stenotic valve results in blunting of the gradient rise. These findings in turn allow the use of maneuvers that increase transvalvular flow, such as dobutamine infusion, vasodilators, and other interventions, to help assess equivocal valve disease severity (see Figure 14.6).
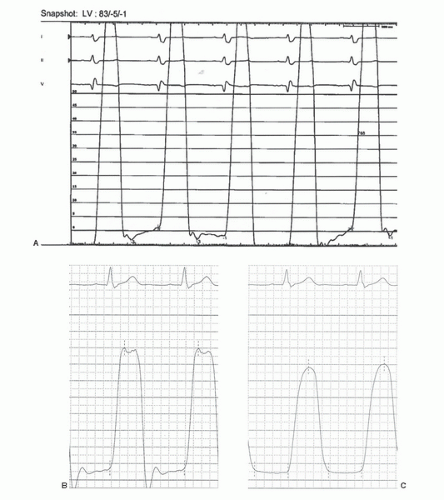 Figure 14.2 A. Left ventricular pressure tracing of a 63-year-old patient presenting with congestive heart failure with a newly diagnosed cardiomyopathy. The left ventricular end-diastolic pressure of -1 mmHg is an obvious artifact, though it was dutifully included in the patient’s assessment. This has occurred almost certainly owing to the transducer having been mounted well above the patient’s heart. In addition to the negative pressures, the hemodynamics are inconsistent with the patient having a newly diagnosed cardiomyopathy. This is an example of a fundamental flaw in modern hemodynamic assessment and reporting: blind repetition of numbers reported by machine. B, C. Two other examples of distorted left ventricular pressure recordings (200 mmHg scale). The tracing in panel B was obtained with overly compliant tubing attached to the diagnostic catheter, whereas for the tracing in panel C, air was present in the tubing between the catheter and the manifold. (Figure courtesy of Dr. John Hirshfeld, University of Pennsylvania.). D, E. Left ventricular (LV) versus central aortic pressure with high-fidelity pressure recordings using micromanometer catheters (D). In contrast, tracing E shows the loss of fidelity inherent in using fluid-filled catheters; the last two beats reflect a left ventricle-to-central aortic pullback. The femoral arterial pressure upstroke is delayed, and because of harmonics and possibly the height of the LV transducer, the femoral arterial pressure appears to be substantially higher than LV systolic pressure. Similar to B above, the LV pressure tracing is underdamped. (Tracings courtesy of Dr. Morton Kern, University of California, Irvine.)
Stay updated, free articles. Join our Telegram channel
Full access? Get Clinical Tree
 Get Clinical Tree app for offline access

|