Percutaneous Interventions in Adults with Congenital Heart Disease


Percutaneous Interventions in Adults with Congenital Heart Disease


Damien Kenny MB, MD

Qi-Ling Cao MD

Ziyad M. Hijazi MD, MPH, FSCAI


With improving survival rates following intervention for congenital heart disease (CHD) in infancy and childhood, the prevalence of adults with CHD is growing yearly. Indeed recent reports have suggested that the number of adults with CHD has surpassed pediatric numbers and that approximately 1 in 150 young adults will have some form of CHD (1, 2). Significant rates of intervention and reintervention are required in this cohort of patients, with one report demonstrating 20% of young adults with CHD requiring cardiovascular surgery (3). Increasingly, transcatheter alternatives to surgery exist in this population, particularly in the field of transcatheter pulmonary valve replacement (tPVR), and recommendations for catheter intervention in adults with CHD have been published in the context of overall care of these patients (2). Case complexity will vary according to the underlying diagnosis, ranging from more straightforward interventions such as atrial septal defect closure (covered in a separate chapter) to complex stenting interventions for interatrial baffle leaks in patients following atrial switch surgery for transposition of the great arteries. Table 44-1 outlines the majority of interventional procedures required in this group of patients. Many of the more complex patients may have had multiple previous interventions, and detailed review of previous data as well as sensible use of preprocedural imaging techniques is essential. A structured approach to diagnostic assessment with appreciation of the necessary data to accurately calculate the degree of intracardiac shunting is also vital and will be discussed in detail. Finally, procedural techniques and outcome data, wherever available, will be discussed in relation to the range of transcatheter interventions seen in this patient group.


TABLE 44-1 Congenital Cardiac Lesions Amenable to Transcatheter Interventions


Lesion


Procedure


Operation Replaced


Comment


Atrial septal defect


Device closure


Open heart repair


75% suitable for transcatheter closure (not sinus venosus or primum defects)


Ventricular septal defect


Device closure


Open heart repair


Muscular defects. Concerns regarding complete heart block with perimembranous device closure


Patent arterial duct


Coil or plug occlusion


Thoracotomy-closed repair


>90% suitable for transcatheter closure


Assess for pulmonary hypertension


Pulmonary stenosis


Pulmonary valvuloplasty


Open heart valvotomy


>85% will respond to valvuloplasty


Congenital aortic stenosis


Aortic valvuloplasty


Open heart valvotomy


Equivalent outcomes to surgica valvotomy in younger patients


Coarctation and recoarctation of aorta


Angioplasty or stent implantation


Thoracotomy-closed repair


Open surgery carries increased risk. Aortic aneurysm a risk in older patients


Venous and arterial collaterals in complex disease


Coil or plug occlusion


Surgical ligation


Recurrent intervention may be necessary


Pulmonary regurgitation


Percutaneous stented valve


Surgical homograft replacement


Evolving. Currently only suitable if adequate stenosis to anchor stent


Branch pulmonary stenosis


Pulmonary artery stent


Open surgical repair


Hybrid approach may be used if access to stenosis is technically challenging


Mustard/Senning baffle obstruction/leak


Baffle stent


Open surgical repair


Complex intervention. Covered stents necessary if baffle leak.


Post Fontan surgery-fenestration closure


Device closure


Open heart repair


40% spontaneous closure rate


Coronary artery fistula


Plug or coil closure


Open heart repair


>90% suitable for transcatheter closure. Close monitoring for myocardial infarction


Ruptured sinus of Valsalva


Plug or device closure


Open heart repair


>90% suitable for transcatheter closure


ASSESSMENT OF CARDIAC OUTPUT, INTRACARDIAC SHUNTS, AND VASCULAR RESISTANCES


Flow and Shunt Calculations

A variety of techniques have been employed to calculate relative right and left heart cardiac outputs and intracardiac shunts; however, most laboratories now use simple oximetric methods. The foundation of these calculations is based upon Fick’s principle, which suggests that the total uptake of a substance by an organ is equal to the product of the blood flow to that organ and the arterial-venous (A-V) concentration difference (gradient) of the substance. When calculating cardiac output, the substance measured is oxygen. In estimating Qp or pulmonary blood flow, the A-V difference used is the difference between the oxygen content of the pulmonary artery and that of the pulmonary veins. In calculating Qs or systemic blood flow, the A-V difference is the difference between the oxygen content of the aorta and that of the systemic veins. Simply put, the equation reads:


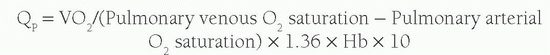
As almost all oxygen in the blood is bound to the hemoglobin and each gram of hemoglobin is capable of carrying 1.36 mL of O2, the oxygen content of blood is calculated by:


Therefore, the arteriovenous oxygen content difference can be calculated by measuring the oxygen saturations in both the pulmonary arteries and the pulmonary veins. In order to calculate the cardiac output, oxygen consumption is required. This is influenced by a number of variables, including age, sex, height, and heart rate. Accurate measurement during cardiac catheterization is achievable using indirect calorimetry or mass spectrometry; however, it is commonplace to estimate VO2 values from published predictive equations or tables. It is noteworthy that studies have been published indicating poor levels of agreement between measured and estimated VO2 (from regression equations published separately by Lafarge and Miettinen, Lundell, Wessel, and Lindahl) in both sedated and mechanically ventilated patients with CHD during cardiac catheterization (
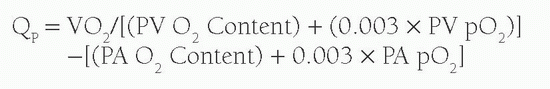
4). Thus Qp can be calculated from the equation:


In the absence of any shunt, the pulmonary blood flow and the systemic blood flow should be the same. The systemic blood flow represents the flow from the aorta through the body to the right atrium (RA). Unfortunately, there is a normal variation in the saturation of blood arriving to the RA; the inferior vena caval (IVC) blood has higher oxygen content than the superior vena caval (SVC) blood because the kidneys remove far less oxygen relative to their degree of perfusion. The coronary sinus has very desaturated blood owing to the high oxygen extraction rate of the heart, but the amount of coronary sinus blood is minor, and its contribution is ignored in the equations. The IVC saturation is high enough normally that one needs at least a 11% step-up in the saturation from the SVC to the RA to be sure there is an atrial level shunt. As the blood mixes further downstream in the right ventricle (RV), a 7% step-up in the RV versus the SVC should be used to confirm a ventricular level shunt, and a 5% step-up is recommended in the PA to be confident of a pulmonary arterial left-to-right shunt. To normalize for the higher IVC oxygen content, a mixed venous (MV) saturation is derived from the formula:


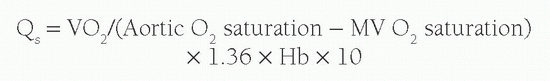
Under normal circumstances with no intracardiac shunting, the aortic oxygen content should be the same as the PV oxygen content, and the MV oxygen content should be the same as the PA oxygen content. Therefore Qs is derived from:


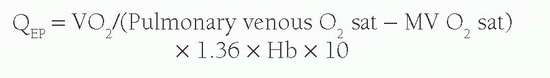
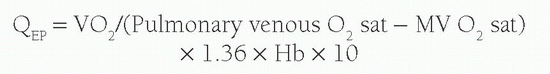
Another concept used with calculation of shunt volume is that of effective blood flow (QEP). The QEP is the volume of desaturated systemic venous blood flowing through the lungs that is oxygenated in the lungs. In the absence of intracardiac shunting, the effective pulmonary blood flow (QEP) should be the same as the QP, which should be equal to Qs:


However, when there is a left-to-right shunt, the shunted blood has already passed through the lungs, and is therefore not part of QEP. Therefore, the volume of shunted blood is calculated by:


When there is a right-to-left shunt, QS will be formed by both the QEP and the blood that has shunted past the lungs. Therefore, the right-to-left shunt volume is calculated by:


A simpler method for assessing the systemic to pulmonary flow ratios can be calculated with the O2 saturations from the four main measurement areas used in the above calculations, namely the MV saturation, the pulmonary artery saturation, the pulmonary vein saturation, and the aortic saturation as in calculating relative QP:QS as all of the other variables will cancel each other out. Therefore, this can be calculated roughly by:


The above equation will work in providing an estimate of leftto-right shunt in most cases. However, if oxygen concentrations higher than room air are used, the dissolved oxygen content per milliliter of blood is required for accurate calculation flow. This is calculated from:


This is then incorporated into the calculations:


Calculation of Pulmonary Vascular Resistance

With invasive measurements, exact pressure recordings from the heart, pulmonary arteries, and the aorta can be obtained. It is also possible as outlined above to calculate cardiac output. Therefore, by applying Ohm’s law (pressure = flow × resistance), one can calculate accurate resistance measurements, particularly within the pulmonary arteries. This is extremely important as pressure may be elevated secondary to increased flow or increased resistance.
If flow is the predominant factor, such as in the case of a large ventricular septal defect (VSD) in a young infant, then surgical management is indicated. However, if distal irreversible pulmonary vessel remodeling occurs (which may be seen with chronic excessive pulmonary flow), then high resistance may preclude surgical intervention. This provides the cornerstone of diagnostic catheter assessment in CHD patients, where there are concerns regarding the contributing factors to increased pulmonary artery pressures. Pulmonary vascular resistance (PVR) is calculated by modifying Ohm’s law:


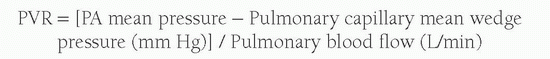
Similarly, the systemic vascular resistance (SVR) is derived from the mean aortic pressure, the mean RA pressure, and the systemic blood flow.


When the flow is expressed in terms of liters per minute, the units derived are referred to as Hybrid or Wood Units and measured in mm Hg/L/min, or simply referred to as “u”. It is important to note that these values when indexed to body surface area are expressed as u·m2. Smaller patients appear to have significantly greater resistance values when using nonindexed cardiac output values (because of their smaller body surface areas [BSA]), and therefore it is important to multiply, rather than divide, by the BSA to calculate the indexed resistance value. The Woods Unit number can be multiplied by 8 to convert to Pascal seconds per cubic meter (MPa·s/m3) and by 80 to derive dynes cm/s5. These values are outlined in Table 44-2.

Although initial assessment of vascular resistance may suggest significantly raised PVR, it is possible that this increased resistance may be reversible and therefore react favorably to certain pulmonary vasodilators. Such agents include oxygen and pulmonary vasoactive drugs such as adenosine, calcium-channel blockers, prostacyclin, and inhaled nitric oxide. A “positive” response is generally one in which there has been both a reduction in mean PA pressure of at least 10 mm Hg to an absolute mean PA pressure of less than 40 mm Hg without a decrease in cardiac output (5). A positive response has been associated with an improved longterm outcome, although the response may not predict clinical improvement with the various pulmonary hypertensive agents now available. Eisenmenger’s physiology is defined by the presence of pulmonary hypertension and evidence for shunt reversal (cyanosis), which occurs because of increased distal PVR secondary to chronic excessive blood flow. Initial assessment and management protocols for these patients have been defined (2). Significant symptom improvement has been shown following treatment with newer oral pulmonary hypertensive agents (6).


TABLE 44-2 Definitions in Pulmonary Hypertension


Measurement of PVR


Wood units = mm Hg/L/min (to index multiply by BSA rather than divide). To convert to Pascals multiply by 8, and to convert to dynes multiply by 80


Normal pulmonary vascular resistance (Nonindexed):


0.25-1.6 Wood units


Normal systemic vascular resistance (Nonindexed):


9-20 Wood units


Definition of pulmonary arteria hypertension:


Mean pulmonary artery pressure >25 mm Hg with PCWP/LAP/LVEDP<15 mm Hg and PVR > 3 Wood units


Acute response with testing:


Decrease in mPAP of at least 10 mm Hg to an absolute value <40 mm Hg without a decrease in cardiac output


Contraindication to closure of L-R shunt lesion


PVR > 7 Wood units (although lesions demonstrating reversibility with higher initial PVR have been closed)


DEFECT AND VASCULAR OCCLUSION


Transcatheter VSD Closure

The majority of congenital VSDs are located within the region of the membranous septum (>75%) with the remainder located within the muscular septum. Rarely, these defects are doubly committed lying directly beneath the septum separating the aortic and pulmonary valves, and classically these defects have been closed surgically. Most clinically relevant VSDs are closed in childhood; however, hemodynamically significant shunts (defined as a Qp:Qs >1.5:1 in adults) (2) may become clinically relevant only in later years. Reports outlining transcatheter closure exclusively in adults have been published (7, 8). Indication for closure was symptoms and/or ventricular dilatation in 40% to 60% of patients. Other more common indications included pulmonary hypertension and endocarditis. Aortic valve prolapse leading to aortic regurgitation may be seen with small subaortic VSDs secondary to the Venturi effect in essence “sucking,” most commonly, the right or non-coronary cusps inferiorly toward the VSD, and surgery is usually preferred in these instances as device placement may impede upon the aortic leaflets, worsening the aortic regurgitation. Transcatheter closure of perimembranous defects has been halted in the United States owing to significant concerns regarding complete heart block (˜5% in the European registry series [9] and 3% in the US trial [10]) following device placement. Recovery of atrioventricular block has been reported with early treatment with steroid (11) or early surgical removal of the membranous occluder (12). Comparable rates of complete heart block following surgical closure in younger patients have been reported at less than 1% (13). Newer devices are in development with design modifications to reduce radial force on the conduction tissue and potential for heart block. Overall, reported complication rates have ranged from 6.5% in the European registry to 10.7% in the US perimembranous registry, including device embolization, cardiac perforation, stroke, and two deaths (10). Exclusion criteria have also been cited, and include inadequate distance for device placement (usually 4 mm) between the VSD and either the atrioventricular or the semilunar valves, active sepsis or PVR > 7 indexed Wood units (14). The approach to transcatheter closure is outlined in Figure 44-1.

Transcatheter closure of acquired VSDs secondary to myocardial infarction is associated with significant morbidity and mortality, mirroring surgical mortality of 50%. In a recent study looking at transcatheter closure of acute postinfarct VSDs, although procedural success was achieved in 86%, 41% of patients had a procedurerelated complication, including significant residual shunt, with
overall 30-day survival of 35% (15). In a previous study looking solely at postinfarct VSD closure, 30-day mortality figures of 28% were reported; however, a significant proportion of these patients underwent closure in the subacute or chronic phase of their acute myocardial infarction (16). Patient selection may be key, and alternative forms of imaging such as cardiac computer tomography (CT) or magnetic resonance imaging (MRI) may assist in delineating the morphology of the defect and surrounding tissue and thus whether the patient may be suitable for transcatheter closure.


FIGURE 44-1 Series of images outlining transcatheter approach to VSD closure. A: Left ventricular angiogram demonstrating left-to-right flow across a subaortic VSD (white arrow). B:

Only gold members can continue reading. Log In or Register to continue

Stay updated, free articles. Join our Telegram channel

May 28, 2016 | Posted by in CARDIOLOGY | Comments Off on Percutaneous Interventions in Adults with Congenital Heart Disease

Full access? Get Clinical Tree

Get Clinical Tree app for offline access