29 Pacemaker Troubleshooting and Follow-up
 Bidirectional Telemetry
Telemetry is the ability to transmit information or data from one device to another, a capability that was essential to the introduction of pacemaker programmability. This is the ability to noninvasively change the functional and diagnostic parameters of the pacing system by coded commands transmitted to the pacemaker from a programmer.1–4 The first generation of programmable pacemakers used unidirectional telemetry from the programmer to the pacemaker but was not able to transmit data from the pacemaker to the programmer. This limited the confirmation of a programming change that was electrocardiographically silent (e.g., sensitivity, refractory period) when a parameter was programmed.
Bidirectional telemetry is communication in two directions. With respect to pacing systems, this means that the pacemaker and programmer can communicate with each other, an essential capability for the development of the multiple diagnostic capabilities that are the subject of this chapter.5,6 First implemented in rechargeable pacemakers, bidirectional telemetry was developed to confirm the proper alignment of the recharging head with the implanted pacemaker. When the recharging wand was not aligned properly with the pacemaker, there was an audible beep from the charging unit to notify the patient and whoever was in attendance of this condition. When the two devices were properly aligned, the system was silent.
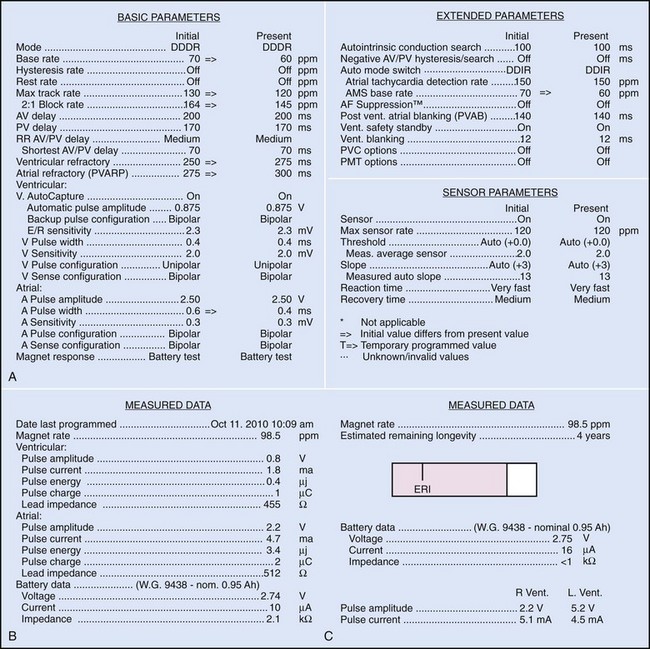
Bidirectional capability was next applied to confirmation of programming. This was particularly valuable for those parameters that did not result in an overt change in pacing system performance and could not be independently identified on an electrocardiographic recording. This ability is essential for the DDDR pacemaker and modern implantable cardioverter-defibrillators (ICDs), because these devices can have dozens of independently programmable parameters, most of which are not readily identifiable on the electrocardiogram (Fig. 29-1, A). Bidirectional telemetry allows interrogation of programmed parameters and measured data when the patient is seen during follow-up for routine evaluation, during remote follow-up interrogation, or for a suspected pacing system malfunction. Without this feature, there would be no way to determine the current settings of a device for features other than rate and pulse width. It also makes the retrieval of detailed data collected by the pacemaker in its various event counters feasible. Presently, interrogation of pacemaker settings and data can be accomplished remotely. This technique uses a device located in the patient’s home, a physician’s office, or anywhere an Internet connection or telephone service (wired or cellular) connection is available. Data are retrieved from the device and sent to a central receiving station. The data are made into a report and then can be faxed to the appropriate individual or made available through an Internet website portal. Although the technology exists to allow programming remotely, this is not currently available because of regulatory issues.
Measured Data
Complementing the interrogation of programmed data is the provision of measured data, including data obtained from the pacemaker detailing information on lead and battery function at evaluation. Information regarding demand and asynchronous rates may also be measured (Fig. 29-1, B). Telemetry allows this information to be transferred from the pacemaker to the programmer for evaluation by the clinician.
Battery Status
Although not all systems provide the information in the same manner (some are graphic and others are numeric), data concerning battery function often include a measure of battery voltage, impedance, and current drain.7–11 All three parameters are interrelated. The battery current drain is a measure of the average current being drawn from the battery, assuming 100% pacing at the programmed rate and output settings. Inhibition or pacing at higher rates, as might occur with intrinsic rhythm or sensor drive, respectively, directly affects the functional battery current drain, as do changes in lead or stimulation impedance. The reported current drain is only an estimate of the actual battery current drain. Newer devices are able to estimate remaining longevity based on true current drain measurements, giving a much more accurate assessment (see Fig. 29-1, C).
Given the degree of programmability of most current pacemakers, a dual-chamber pacemaker programmed to pace all the time at maximal output on each channel may last only 2 years. An identical model programmed to outputs of 2.5 V or lower on each channel that are inhibited a significant portion of the time may be anticipated to function properly for 10 years or longer. It would be inappropriate to follow the second unit on a monthly basis beginning 1 year after implantation, whereas it would be equally inappropriate to plan only annual checks on a pacing system programmed with high outputs and 100% pacing. By following some measure of the status of the battery, either directly or indirectly, the clinician can achieve a qualitative assessment about when to increase the frequency of pacing system follow-up.12
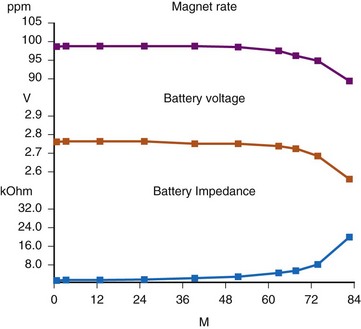
There are two primary indicators of battery status: battery voltage and battery impedance. Battery voltage progressively decreases over time. The lithium/iodine (Li/I2) power cell is the most common power source in pacemakers, whereas the power source in an ICD is lithium/silver vanadium oxide (Li/VSO). Some of the newer pacemakers are now using Li/VSO–polycarbon monofluoride (LVSO/P). The nominal unloaded output voltage of the Li/I2 cell is 2.8 V, with each manufacturer triggering the RRT indicator at a specified battery voltage based on circuit design considerations. LSVO/P in pacemaker application has an initial voltage of 3.20, with an early drop to 2.90 V, where it plateaus, then drops to an elective replacement voltage of 2.60 V. The battery voltage and programmed output voltage are not identical. The “programmed output voltage” is achieved by modifying the 2.8-V battery output with either voltage multipliers or charge pumps to provide a higher voltage. The battery voltage can also be divided to deliver a voltage lower than 2.8 V. As energy is consumed, the battery voltage progressively decreases because of increased internal impedance. Even with decreasing battery voltage, the device circuitry is designed to maintain the stability of the programmed voltage delivered to the patient. The ability to track the progressive decrease in battery voltage and increase in battery impedance provides an effective guide to the clinician regarding the frequency with which the pacing system should be routinely checked for signs of battery depletion (Fig. 29-2). In addition, the measured battery voltage is affected by the battery current drain: the higher the current drain, the lower the battery voltage.
Battery voltage and impedance may be tracked together or individually. If these measurements are provided to the manufacturer’s technical service engineers, along with the programmed parameters and an estimate of the percentage of pacing versus inhibition, the remaining longevity of that pacing system can be estimated with reasonable accuracy, assuming that the various parameters remain stable. These calculations have more recently been incorporated into the programmer interface to provide an online estimate of longevity in years or months. These estimates are sometimes shown as a range based on the tolerances of the battery measurements (i.e., giving minimum and maximum ranges of longevity), as well as an estimate based on present current drain and actual device use based on data acquired from the event counter diagnostics (see Fig. 29-1, B).
Lead Status
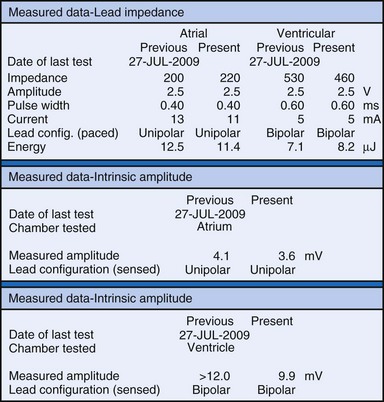
The clinician can use knowledge of lead impedance to monitor and identify a developing mechanical problem with the lead. This requires baseline and historical data to recognize subtle changes that may reflect conductor fracture or an insulation breach. It is essential to know what device is being used to make these measurements. As noted previously, different devices may obtain these data at different points of the pacing stimulus. Because of these differences, the impedance measurement obtained with a pacing system analyzer at implantation may be significantly different from that obtained by telemetry from the implanted pacemaker moments, if not years, later. This difference does not necessarily imply a problem. Furthermore, impedance may naturally evolve over time, with a fall in impedance occurring during the days to weeks after implantation, followed by a gradual rise toward the initial measurements. Multiple factors may affect impedance, particularly in a unipolar system. For example, measurements obtained during deep inspiration may significantly differ from those obtained during maximal exhalation. In the same patient, impedance measurements based on a single-output pulse have been reported to vary by 100 ohms (Ω), or even more, during the same follow-up evaluation, while remaining consistent with normal function. If a marked change in lead impedance from previous measurements (e.g., >200 Ω) is encountered during a routine follow-up evaluation, the pacing system should be further evaluated.13,14 If the patient has no clinical symptoms and has stable capture and sensing thresholds, surgical intervention would be premature, although more frequent follow-up in the office or by remote interrogation would be prudent. However, a dramatic change in telemetered lead impedance in the presence of a clinical problem directs the physician toward the likely source of the difficulty (Fig. 29-3).
A dramatic fall in impedance usually reflects a break in the insulation.15–17 In a unipolar system, an insulation problem provides an alternative pathway for current flow starting closer to the pulse generator, resulting in less energy reaching the heart. An outer insulation break in a bipolar lead tends to result in “unipolarization” of the lead. The amplitude of the stimulus artifact as recorded by an analog electrocardiogram (ECG) is determined by the distance the current travels in the tissues from the cathode (tip electrode) to the anode (ring electrode or housing of the pulse generator). A normally functioning bipolar pacing system in which both active electrodes are inside the heart, separated only 1 to 2 cm, results in a small stimulus artifact. In a unipolar system, the current travels from the tip electrode to the housing of the pulse generator, and therefore the stimulus artifact is large despite equivalent output settings. Some of the newer digital ECG designs result in a marked signal-to-signal variation in amplitude as a result of the digital sampling rate of the recording system. Other recording systems create an artificial uniform amplitude artifact with any high-frequency electrical transient, thereby precluding differentiation of a bipolar from a unipolar pacing system based on the analysis of the ECG recording.
In a previously stable system, a mechanical problem developing with the lead—either a breach in the insulation or a conductor fracture—results in a change in the stimulation impedance, which may be reflected by a change in the ECG-recorded stimulus artifact (Fig. 29-4). In a bipolar pacing system, an insulation defect between the proximal conductor and the tissues of the body is not likely to affect capture thresholds, but it results in a larger stimulus artifact, making it appear unipolar. Depending on the actual location of the insulation failure in either the bipolar or the unipolar lead, stimulation of the extracardiac muscle contiguous to the insulation defect may occur. Insulation failures may also attenuate the electrical signal reaching the pacemaker, possibly resulting in sensing failure.
Programming of the output configuration to unipolar (most pacing systems, but not ICDs, now have this capability) may prevent the loss of capture and possibly undersensing from an internal short circuit. This does not prevent the oversensing behavior associated with make-break electrical transients generated by intermittent contact between the two conductors, as is caused by failed inner insulation. Typically, a bipolar lead with failed internal insulation exhibits a higher impedance when pacing is programmed to the unipolar rather than the bipolar output configuration.18,19 This is opposite to the expected higher impedance of a bipolar system. Although programming to a unipolar configuration may result in an apparent resolution of a malfunction, it is not a cure and should be considered only as a temporary measure, one that allows the observed problem to be managed on an elective rather than emergent basis. The malfunctioning lead should be replaced expeditiously.
An increase in lead impedance may be the result of a conductor fracture or a connector problem.20 When this occurs, the lead impedance often rises to high levels. It is inappropriate, however, to assume that a normal lead impedance is 500 Ω. Leads are available that are designed to have high impedance, with values ranging from 1500 to 2500 Ω. Other leads, at implantation, may have an impedance in the range of 250 to 300 Ω. Therefore, it is essential to look for a trend in serial lead impedance measurements rather than a single measurement. Impedance, taken in conjunction with the stability or changes in capture and sensing thresholds, is the best way to determine the condition of a pacing lead. A mechanical problem with the lead—either a conductor fracture resulting in high impedance or an insulation failure resulting in low impedance—eventually results in an overt clinical problem that can be identified by telemetric measurement of the stimulation impedance. If the impedance is sufficiently high, there is no current flow and no effective output. It must be understood that, although the telemetered event markers indicate a pace output, there may be loss of capture. The reduced current flow also results in a fall in the measured current drain of the battery. Note that any problem may be intermittent. This typically occurs when the two broken ends make contact at times but are separated at other times, or in the case of an insulation failure, when lead movement either opens the compromised area or pushes the edges of the break together, resulting in intermittent normal function.
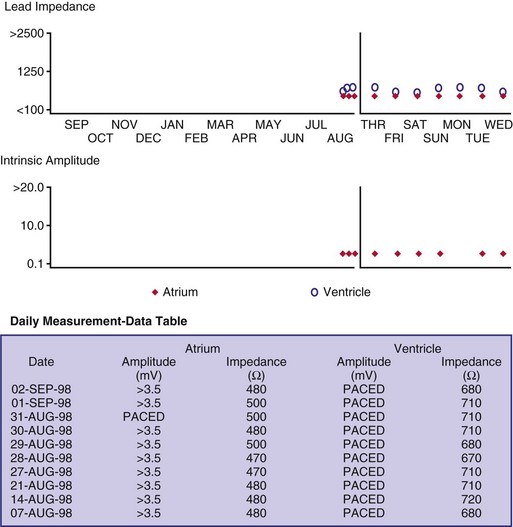
Some pacemakers are able to report lead impedance measurements on a beat-by-beat basis, allowing the clinician to observe the digital readout of lead impedance on the programmer screen over many cycles. As with the oscilloscopic monitoring of the pulse wave morphology, this technique reduces but does not eliminate the incidence of false-negative results. A further enhancement is the “automatic periodic monitoring” of lead impedance, which results in a graphic display reporting the history of lead impedance performance. Measurements can be obtained continuously or daily. This increases the frequency of measurement, increasing the likelihood of diagnosing an intermittent lead problem and possibly intervening on an automatic basis (Fig. 29-5). Some devices respond by automatically programming the pacemaker from bipolar polarity to unipolar in the presence of either a marked rise in impedance, reflecting a conductor fracture,21 or a marked drop in impedance, consistent with an insulation failure.
Event Marker Telemetry
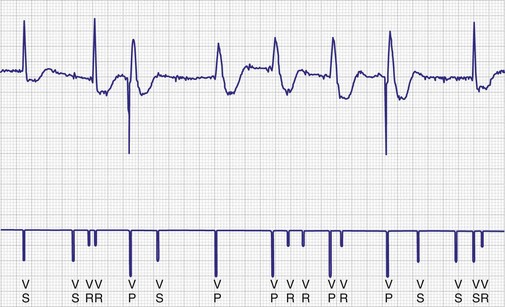
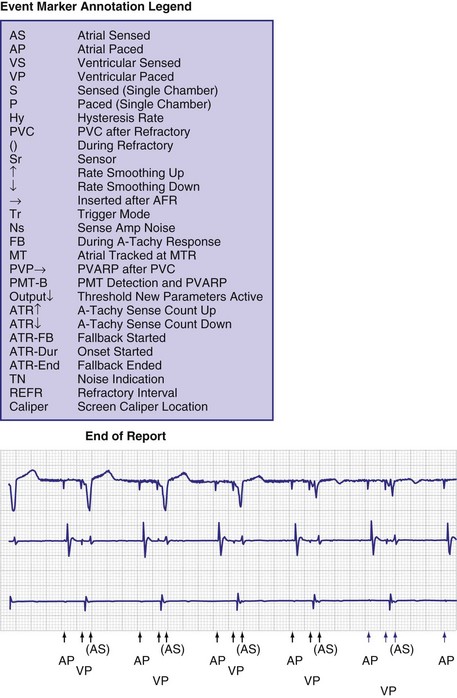
To facilitate interpretation of the paced rhythm, almost all modern pacing and ICD systems incorporate the ability to transmit information regarding real-time pacing system behavior to the programmer. These data are displayed on the programmer screen and may also be printed as well. Both paced and sensed events are communicated to the programmer. Displayed as a series of positive or negative marks, with or without alphanumeric annotation, these are generically termed event markers. They have the greatest diagnostic value when superimposed above or below a simultaneously recorded surface ECG (Fig. 29-6). Some systems also display the duration of the atrial and ventricular refractory periods and interval measurements. Others show events that are sensed during the refractory period even though they do not play a role in altering the system timing (i.e., they are sensed but not used). Events may be displayed either in real time or after the tracing has been frozen on the programmer screen using cursors to identify the interval of interest. If the real-time monitor screen method is used to show the rhythm and event markers, the tracing may be frozen and then printed for inclusion in the medical record.
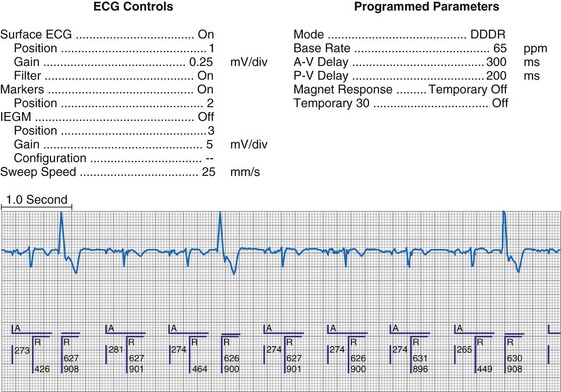
Figure 29-6 Surface ECG and simultaneous event markers.
Data are from a Pacesetter Trilogy DR+ Model 2360 (St. Jude Medical CRMD, Sylmar, Calif).
Event markers (also called marker channels, annotated event markers, and main timing events by various manufacturers) are most effectively used when they are displayed with a simultaneously recorded ECG rhythm.22–25 Without the ECG, the event marker simply reports the behavior of the pacemaker. This information is valuable in showing that an output has been released or that sensing has occurred. It does not confirm that the stimulus effectively resulted in capture, or that a sensed event was a true atrial or ventricular depolarization. The presence of an output marker does not confirm that the stimulus even reached the heart. The output marker serves only to confirm that the pacemaker delivered a stimulus from its output circuit. This notation is transmitted directly from the pacemaker to the programmer by way of the telemetry module. An open circuit (e.g., a fractured conductor coil) may preclude the output pulse from reaching the heart, but the pacemaker would indicate that an output pulse was released. Similarly, a native depolarization may not be sensed, allowing the pacing stimulus to be released at a time when the myocardium is physiologically refractory. If the markers reported that an event was sensed on the atrial channel and was followed by a ventricular output pulse after a preset delay (known as P-wave synchronous ventricular pacing or tracking), the clinician would know that the pacemaker was capable of sensing in the atria and pacing in the ventricles. Without a simultaneously recorded ECG, it would be impossible to determine whether the pacemaker was responding to inappropriate signals on the atrial channel, whether the ventricular stimulus was effective, or whether a native QRS complex was present but not sensed. Therefore, telemetered event markers are most effective when displayed with a simultaneously recorded ECG.
Event Marker Displays
The next improvement was to transmit coded signals representing paced and sensed events from the pacemaker to the programmer. The programmer reconstituted these signals into a series of varying-amplitude pulses or alphanumeric labels representing paced or sensed events. These could be either displayed on a monitor screen or recorded using a printer integral to the programming system, which allowed for the simultaneous recording of a surface ECG acquired by way of a separate set of cables. The simultaneous ECG and markers allowed the clinician to correlate the behavior of the pacemaker directly with the patient’s rhythm, to determine whether the system is functioning properly. A calibration signal composed of a series of different amplitude pulses or a legend of the cryptic labels allowed the clinician to interpret the various markers (Fig. 29-7). In an early series of markers, the largest pulse represented a pacing output, the intermediate one indicated a sensed event, and the smallest represented either the end of the refractory period or a sensed complex that occurred during the refractory period. With the advent of dual-chamber pacing systems, a marker pulse extending above the baseline identified atrial events, and ventricular events were labeled with a pulse extending below the baseline. This type of marker system has become obsolete, and there are very few devices remaining as active implants that use this scheme.
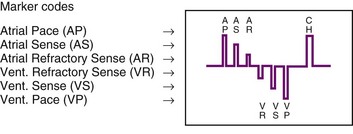
One method for single-chamber pacing systems with event marker telemetry uses the letter P to reflect a paced event and S to represent a sensed event. This may cause confusion with other dual-chamber systems in which the letter P reflects a sensed atrial event indicative of a native P wave (with which most medical personnel are familiar, based on their knowledge of the standard ECG). The interpretation of the alphanumeric event markers is often product specific, and the clinic personnel who evaluate the pacing system must take this into account (Fig. 29-8).
Other symbols may be used for a paced or sensed event and are usually displayed with an identifying key on the resultant printout. Each paced or sensed event may also be identified by a vertical line, going up in the case of atrial events and down for ventricular events. In some cases, a difference in the amplitude of these lines has been retained in conjunction with the alphanumeric lettering. Indeed, as the complexity of the devices increases, the variety of symbols and letters identifying specific events and behaviors is also increasing (see Fig. 29-8).
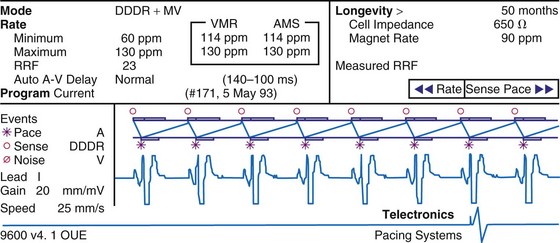
Laddergramming
Laddergramming is an advanced adjunct to the interpretation of clinical arrhythmias. It was incorporated in some programming systems by using the known programmed parameters of the pacemaker combined with the event marker information telemetry from the implanted pacemaker23–26 (Fig. 29-9). For all the elegance of these graphic interpretations of the pacemaker’s behavior, they still require the simultaneously recorded ECG rhythms. Although the pacemaker may be functioning normally, in that it is behaving properly with respect to its programmed parameters, failure to capture or properly sense would not be diagnosed from the various diagrams and markers without the simultaneously recorded surface ECG.27 Laddergramming has become a teaching tool at this time, because no programmers currently provide this level of graphic description.
Event Marker Limitations
Several limitations are associated with event marker telemetry. First, used alone, markers report the behavior of the pacemaker but do not allow the clinician to determine whether this behavior is appropriate for the patient.27 In this regard, markers are analogous to the hand-held digital counters that report pacing rates and intervals. The counters only detect and report the pacing stimuli, not whether these output pulses are effective in causing a cardiac depolarization, or whether native events are properly and consistently sensed. A long interval between consecutive pacing stimuli could reflect normal function because the pacemaker responded appropriately to a native complex, or it could represent a system malfunction with oversensing or no output (e.g., from intermittent lead fracture). Neither event marker telemetry nor the digital counters should be used independently of a simultaneously monitored ECG rhythm.
Most pacemaker event marker telemetry is limited to real-time recordings. The markers must be telemetered from the pacemaker to the programmer or another display system while the rhythm is being actively monitored. Neither the pacemaker nor the programmer can retrospectively provide markers for a previously recorded rhythm. If the pacemaker is responding to events that are not visible on the surface ECG, the event marker simply confirms this fact but does not identify the specific signal. An evaluation of sensed but otherwise invisible events requires intracardiac electrogram telemetry or an invasive procedure to record the signal from the implanted lead. Many premium-level pacemakers can store event markers with or without electrograms. Markers may be stored using a patient trigger (e.g., magnet application),28 a simple battery-operated radiofrequency transmitter, or on spontaneous activation of predefined algorithms or sequences of sensed or paced events.
Electrogram Telemetry
At implantation, the amplitude of the EGM is usually measured with a pacing system analyzer (PSA) that reports a millivoltage amplitude. The PSA uses its own unique set of filters, which frequently is not identical to those in the pacemaker’s sense amplifier. Therefore, the reported PSA signal, at best, provides an approximation of what the pacemaker effectively sees. Newer pacing system analyzers are now being introduced that will allow adjustment of the filters to match specific models of pacemakers and ICDs to eliminate this discrepancy. Likewise, the morphology of the EGM observed on a high-fidelity monitor is not identical to the signal as seen by the pacemaker, because filters in the pacemaker’s sense amplifier usually have a narrower band-pass and therefore block out some of the frequencies (Fig. 29-10). Examining the EGM recorded with a physiologic recorder or telemetry with a wide band-pass can provide valuable information on the slew rate, splintering of the intrinsic deflection, and other morphologic abnormalities.
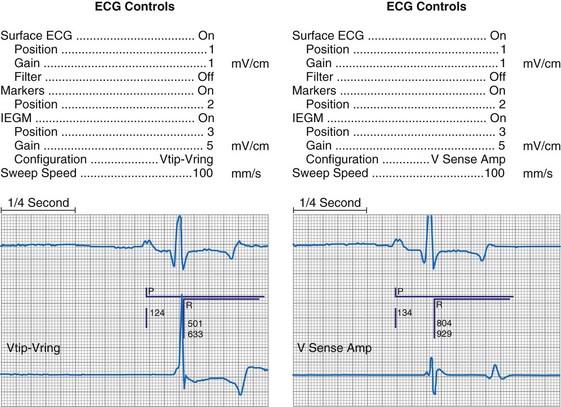
Figure 29-10 Side-by-side display of telemetered bipolar ventricular electrograms.
These signals were telemetered from a Pacesetter Affinity DR pacemaker, Model 5330 (St. Jude Medical CRMD, Sylmar, Calif).
Measurements of the peak-to-peak amplitude of the EGM, as recorded at implantation or as telemetered from an already-implanted pacemaker, are typically used to determine the sensing threshold. This approach may be inappropriate if the frequency content of the signal is outside the constraints of the band-pass filter of the sense amplifier. If the clinician wants to determine the sensing threshold for a given patient, the sensitivity of the system should be progressively reduced until the system no longer consistently senses the native signal. The least sensitive setting (usually identified by millivolt amplitude) at which there is consistent sensing is the sensing threshold. The precision of this measurement is limited by the number and range of programmable sensitivity options in the specific model of pacemaker.29–31 All modern pacing systems now have the ability automatically to measure the EGM amplitude and report this to the clinician. This measurement is done through the pacemaker’s band-pass filter and therefore is a good estimation of the EGM size. The limitation to this method occurs when there is a large beat-to-beat or respiratory variation of the EGM size. The best method available uses this automatic measurement together with a beat-by-beat digital readout of the EGM amplitude. With this approach, the range of actual EGMs can be accurately evaluated. Unfortunately, this method of measurement is not widely available.
Other EGMs are obtained after the signal is processed by the pacemaker’s sense amplifier. As shown in Figure 29-10, both filtered and unfiltered EGMs may be available. Although the unfiltered telemetered EGM should not be used to determine the sensing threshold, it has many other roles.32,33 A primary value is in identifying signals that are being sensed but are not visible on the surface ECG. Another role is to facilitate analysis of the timing of the pacing system, because the sensed intrinsic deflection resets one or more timers. The intrinsic deflection at which sensing occurs can best be identified from the EGM; it is only indirectly measured from the surface ECG. In many cases, the telemetered EGM may be used to confirm capture (particularly atrial) when the evoked complex (P-wave or QRS) is not visible in any lead of the surface ECG.34,35 The evoked EGM may be enhanced by using a unique output pulse configuration to help cancel the residual polarization artifact, or by recording the signal through electrodes not directly involved with the output pulse. The output pulse tends to overload the telemetry or sense amplifier, driving the signal off scale. This is followed by a refractory period within the telemetry amplifier before anything can again be recognized. However, many of the newer pacing systems have more advanced telemetry systems that are able to blank the output pulse and quickly recover to provide high-quality EGM signals.
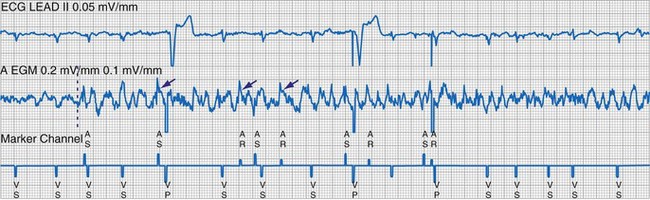
The telemetered EGM has been effectively used to diagnose native arrhythmias, in which the pacemaker is simply an innocent bystander, or to identify retrograde P waves not visible on the surface ECG. The latter ability may facilitate programming of the PVARP to prevent pacemaker-mediated tachycardia.35–43 The telemetered EGM provides clues to why episodes of undersensing may be occurring, including splintering of the EGM and low slew rates, which may place the signal outside the tight constraints of the pacemaker’s sense amplifier, despite an adequate peak-to-peak amplitude44 (Fig. 29-11).
The telemetered EGM can also be monitored periodically to follow the progression of the patient’s intrinsic disease process. A decrease in the amplitude of the telemetered EGM was reported to identify early rejection effectively in cardiac transplantation recipients; a return to the baseline amplitude correlated with resolution of the rejection process.45 Preliminary work on the signal-averaged EGM, either atrial or ventricular, suggests that it may be helpful in identifying disease in the respective chamber that is beyond the resolution of signal-averaging the surface ECG.46
Limitations of Electrogram Telemetry
The apparently adequate amplitude of the telemetered EGM for sensing does not mean that the pacemaker will sense it. The telemetry amplifier may use filters different from those in the sensing circuit, providing qualitative rather than quantitative data on the EGM (see Fig. 29-11). In most pacing systems, telemetered EGMs also have limitations similar to those of event markers. EGMs are real-time recordings and cannot be retrospectively provided by the programmer to facilitate the interpretation of an earlier ECG.
Real-time telemetry allows the physician to analyze the behavior of the pacing system when the patient is in the physician’s office or clinic while these diagnostics are being accessed with the programmer. This is impractical over a long period. In addition, it does not allow the patient to move around much while these recordings are being obtained. Long-term monitoring of pacing system behavior requires a Holter monitor, a loop memory recorder, or event counter telemetry, depending on the desired degree of precision. Pacemakers with microprocessors and significant random access memory (RAM) can now store select EGMs,47,48 as well as event markers, when triggered by the patient or by a predefined set of circumstances. This may greatly reduce the need for Holter or other monitoring techniques to evaluate intermittent symptoms in patients with pacemakers.
Event Counter Telemetry
The first use of stored diagnostic data in cardiac pacemakers was associated with the introduction of multiparameter programmability. Simple data using codes to identify implant indications and medications could be downloaded into the pacemaker for retrieval at subsequent follow-up evaluations. This ability has been expanded, allowing entry of free text (date of implantation, lead model numbers, pharmacologic regimens, and acute implant measurements, including capture and sensing thresholds and lead impedances; see Fig. 29-1, B). This information is printed with the programmed parameters each time the pacemaker is interrogated.
Total System Performance Counters
The simplest systems keep track of the number of times a pacing stimulus is released or a native complex is sensed. This allows for an assessment of the degree to which the pacemaker was used by calculating the percent pacing in each chamber. A refinement of this ability allows the pacemaker to diagnose bradycardia and, in the dual-chamber modes, to determine whether the bradycardia was the result of sinus node dysfunction or AV block. Event counters with this ability have also been termed diagnostic data, implanted Holter systems, and data logging.49–55
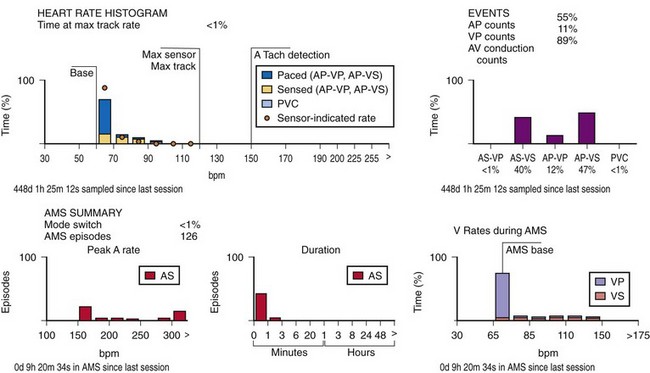
This information may be collected in conjunction with events occurring in specific rate bins, allowing for a detailed report of heart rate distributions. Additional data collected include the percentage of pacing in the atrium and ventricle, length of time at the maximum tracking rate, and the number of episodes in which the pacing system reached the programmed upper rate limit (Fig. 29-12). Additional data may be recorded regarding mode-switching events, pacemaker-mediated tachycardia (PMT) termination algorithm use, or the number of times any one of several other special features was activated. The counters are able to continue to accumulate data until one of the pacing state bins is full and cannot accept additional information. At this point, one or more of the counters are frozen. The volume of data that can be stored depends on the memory capacity of the pacemaker that is dedicated to these features.
Storing a simple marker of the pacing state and rate requires relatively little memory compared with storing waveform data representing the rhythm, as depicted by a consecutive series of EGMs. A theoretical 100-Hz bandwidth with 200 samples per cardiac cycle at eight bits of resolution per sample, recording the entire rhythm during a 24-hour period, would require 140,000,000 bits/day, even if the heart rate was a steady 60 beats per minute (bpm).47 Most implantable defibrillator systems store a series of EGMs preceding and following the delivery of antitachycardia therapy. Premium pacing systems use certain triggers to initiate EGM storage. These triggers may be a high atrial or a high ventricular rate, initiation of mode switching, or activation of any of several other specialized algorithms. Storage may also be triggered by application of the magnet or use of a simple transmitter device by the patient when symptoms are present. An early method to save memory was to provide “snapshots” of representative complexes; the trigger to store these data in an ICD was delivery of antitachycardia therapy. Extensive storage of cardiac rhythm data within pacemakers became possible with increasingly sophisticated data compression algorithms and more memory than previously available. Higher-bandwidth data transmission channels are required for this volume of data storage, particularly for long series of rhythms, so that transmission can be accomplished as efficiently and as quickly as possible.
When the additional ability to monitor a series of rates and pacing states is added, chronotropic function can be assessed by the distribution of atrial sensed rates (AS-VS or PR and AS-VP or PV; see Fig. 29-12). Furthermore, atrial pacing at rates above the programmed base rate reflects sensor drive in the DDDR pacing systems, providing an overview of the sensor behavior. The ability to report both rates and pacing states can provide the clinician with a better insight into the cause of PVEs as well as overall pacing system function. True premature ventricular contractions tend to occur at short coupling intervals, which is equivalent to a rapid rate. Large numbers of PVEs might suggest recurrent ventricular arrhythmias.56,57 If there are large numbers of PVE counts at relatively low rates, the clinician should consider episodes of atrial undersensing or accelerated junctional rhythms, which would also fulfill the pacemaker’s criteria for a PVE (i.e., a sensed R wave not preceded by an atrial event).
Subsystem Performance Counters
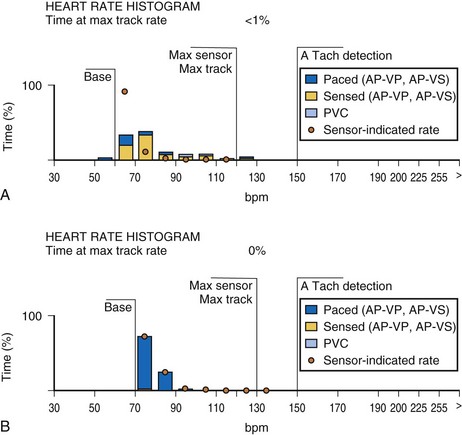
An increasing number of specific algorithms and capabilities are used either intermittently or potentially independently of the functional performance of the pacing system. An early counter representative of this capability is the sensor-indicated rate histogram, which reports the distribution of pacing rates that would have occurred had the sensor been totally controlling the pacing rates.58,59 This counter reports the sensor-defined rates, even if the pacemaker was inhibited by a faster native rhythm or the actual functional rate was being controlled by the sensed atrial activity (Fig. 29-13).
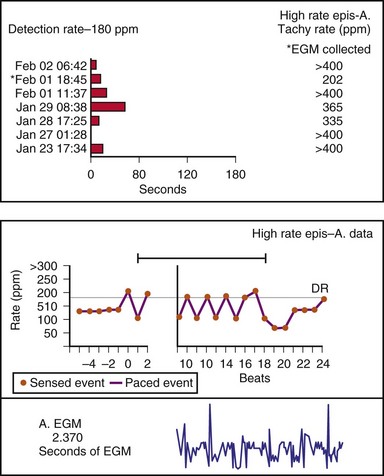
Other subsystem performance counters include automatic mode switch histograms, reports of the cumulative length of time for which the system functioned at MTR, number of times the PMT algorithm was enabled, high atrial or ventricular rate episodes (Fig. 29-14), and sudden rate-drop episodes. These diagnostic counters provide detailed information about the use of a specific algorithm or system behavior that is not activated daily or is not visible on the ECG, making identification difficult using standard recording techniques such as a Holter monitor.
The principal limitation associated with the two types of counters so far described is that counts are placed in a bin, either the pacing state alone or the pacing state and rate, which provides a one-dimensional view of the system’s behavior. If the period of monitoring is short, as during a casual or brisk walk, the clinician can reasonably assess the behavior of the pacing system. Longer periods of monitoring accumulate and overlap the results of many activities. This precludes an assessment of the pacing system’s behavior during a specific activity, or the identification of a symptomatic episode occurring at an earlier time. The ability of the system to store pacing state and rate data with respect to time (i.e., time-based event counters) has been variably termed event record or pacemaker Holter systems.60–62 Technically, this is not yet a true Holter monitor, because continuous rhythm recordings are not retained in memory, even though rate data may be available.
Time-Based System Performance Counters
The other option is to collect the data continuously. As the counters fill, new data are added at the expense of the oldest data (Fig. 29-15). This has been called rolling trend, final trend, or continuous data storage and is based on the “first in, first out” (FIFO) principle. When the patient is seen in follow-up, the data acquired over the time immediately preceding the interrogation of the system are available for review. The patient can often recall symptoms and activities during this period. These can be correlated with the behavior of the pacing system at the time of the symptoms. In this manner, the clinical staff caring for the patient may further assess chronotropic function, the behavior of the pacemaker during a variety of special or usual activities, and whether the sensor and other algorithms are behaving appropriately. The clinician may gain insight into the cause of palpitations and other symptoms that may have occurred during this time by correlation of the recorded data and the patient’s complaints or activities.51,58–62
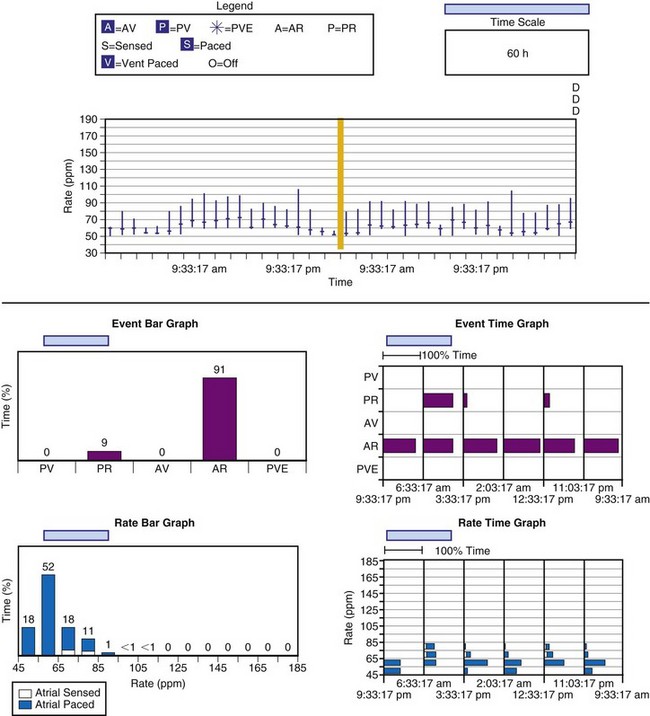
Figure 29-15 Event record display.
Display is from a Pacesetter Trilogy DR+ Model 2364 (St. Jude Medical).
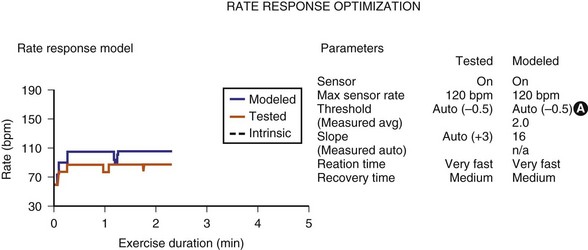
Sensor-input data have been combined with the actual rates achieved to facilitate reprogramming of the sensor parameters. Once acquired, the data from an exercise session are retained in the memory of the programmer, uploaded to the programmer, and then displayed on a screen. The system’s performance is based on a given set of sensor parameters that were in effect at that time. Because the pacemaker has the actual sensor-signal data, it can calculate how the unit would perform in response to a different set of sensor parameters. If a new set of sensor parameters is entered into the programmer, the curves that were based on the original input data are redrawn to display the system’s projected behavior in response to the new set of parameters. The clinical staff can then determine the best sensor parameters for the individual patient without having the patient perform repeated activities (Fig. 29-16). This feature has been termed redraw,63 exercise test, or prediction model.64