Published reports of randomized clinical trials tend to emphasize the statistical significance of the treatment effect (p values) rather than its magnitude (effect size), although the clinical importance of the evidence depends more on the latter than on the former. We, therefore, compared the standard measures of effect size (relative and absolute risk reduction) and nonstandard composites of these measures (the product of the relative and absolute risk reductions and information content) with conventional assessments of statistical significance for 100 trials published in The New England Journal of Medicine . The p values were reported for 100% of the trials, relative risk reductions for 89%, and absolute risk reductions for 39%. Only 35% of trials reported both standard measures, and none reported either of the nonstandard measures. The standard measures correlated weakly (unexplained variance 77%). In contrast, the nonstandard measures correlated highly (unexplained variance 1.3%) but correlated weakly with statistical significance (unexplained variance 83%). Consequently, 25% of the trial results were adjudged “clinically unimportant” despite being “statistically significant.” In conclusion, our results have shown that composite measures of effect size communicate the clinical importance of trial results better than do conventional assessments of risk reduction and statistical significance.
Although the relative and absolute risk reductions are the most common categorical measures of effect size used in the analysis, interpretation, and communication of clinical trial results, they can be confusing to patients and physicians. Therapeutic enthusiasts, for example, might be inclined to emphasize the comparatively large relative difference, even for arguably subjective outcomes such as symptomatic improvement, and therapeutic skeptics might be inclined to emphasize the comparatively small absolute difference, even for inarguably objective outcomes such as mortality. Nevertheless, little attention has been directed toward the integrated interpretation of these widely used metrics. We sought to determine whether the evidentiary content of these effect size measures could be communicated more effectively by a single composite measure. Accordingly, the explicit goals of the present study were to quantify the correlations among the various measures of effect size, and to identify those that best communicate the clinical importance versus the statistical significance of the trial results.
Methods
A preliminary search of the PubMed database recovered a total of 53,649 randomized controlled trials published in its subset of core clinical journals from January 1, 1990 to September 1, 2011. Instead of conducting a systematic survey of this unmanageably large set of publications, we selected a single journal, the The New England Journal of Medicine , as the focus of our attention, because it is widely recognized by physicians, the press, and the public-at-large as the most influential “journal-of-record” for the publication of important clinical trials. According to the Institute for Scientific Information, it currently has an impact factor of 53.48, versus 33.63 for the second-place journal, The Lancet (data available from http://impactfactor.weebly.com/medicine.html ).
A total of 100 randomized clinical trials, approximating the journal’s average output of 90 annually, were randomly selected for review if the categorical cell counts and sample size for the control and treatment groups were reported in the text or tables of the published report. Only superiority trials relative to efficacy were considered for review. Accordingly, we excluded meta-analyses of previously published trials and trials designed to assess safety, cost-effectiveness, or noninferiority. To avoid inclusion of atypical end-of-life studies, we also excluded trials having a control event rate >50%.
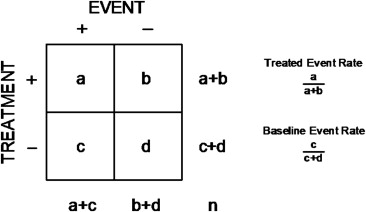
For each trial, the cell counts were summarized in the form of a conventional 2 × 2 contingency table ( Figure 1 ), and a variety of effect size indexes were calculated using equations summarized in the Appendix . The “standard” indexes comprised the familiar absolute and relative risk reductions derived from the control and treatment event rates. The “nonstandard” indexes comprised the product of the absolute and relative risk reductions (the manifold risk reduction) and the logarithmic reduction in uncertainty (information content). Statistical significance was quantified by the standardized difference (σ), representing the number of standard errors separating the control and treatment event rates, or its attendant p value, where σ = 1.96 is equivalent to p = 0.05. The associations among the various measures of effect size were quantified by the correlation coefficient (r) or the unexplained variance (1 − r 2 ), and precision was expressed using 95% confidence intervals (CIs).
Results
The selected trials encompassed a spectrum of acute and chronic diseases. Treatments ranged from the medical to the surgical. Outcomes ranged from subjective to objective, from morbidity to mortality, and from single events to complex composites. The primary outcome was mortality in 22% of the trials, a composite of mortality and morbidity in 40%, and morbidity alone in 38%. Control event rates ranged from 1.3% to 49.5%, and the sample size ranged over 3 orders of magnitude, from 44 to 39,876. A trend was seen toward larger sample sizes in trials with lower control event rates (r = 0.49, 95% CI 0.33 to 0.63), but no relation was found between sample size and the year of publication (r = 0.10, 95% CI −0.10 to 0.29).
The median and interquartile ranges for each of the measures of contrast in the study sample are summarized in Table 1 . Standardized differences (σ) ranged over 2 orders of magnitude, and the associated p values ranged over 20 orders of magnitude. Nevertheless, the effect size measures were generally small, with the morbidity trials exhibiting somewhat greater values than the mortality trials by a margin of 2:1 (0.51 vs 0.34 for relative risk reduction, 0.13 vs 0.07 for absolute risk reduction, 0.06 vs 0.02 for the manifold risk reduction, and 0.02 vs 0.01 for information content).
| Measure | Median | Interquartile Range |
|---|---|---|
| Control event rate | 0.200 | 0.083–0.316 |
| Treatment event rate | 0.101 | 0.048–0.193 |
| Relative risk reduction | 0.399 | 0.227–0.585 |
| Absolute risk reduction | 0.056 | 0.029–0.113 |
| Manifold risk reduction | 0.020 | 0.008–0.056 |
| Information content | 0.005 | 0.002–0.017 |
| Standardized difference | 3.180 | 2.548–4.391 |
| p Value | 0.001 | 0.00001–0.01 |
Although all 100 studies reported the size of the study sample, the counts and rates of the primary outcome for the control and treatment groups, and the p value for their comparison, only 89 reported an index of relative risk reduction, only 39 reported an index of absolute risk reduction, and only 35 reported both an absolute and a relative index. In contrast, 7 reported neither an absolute nor a relative index, and none reported either nonstandard index.
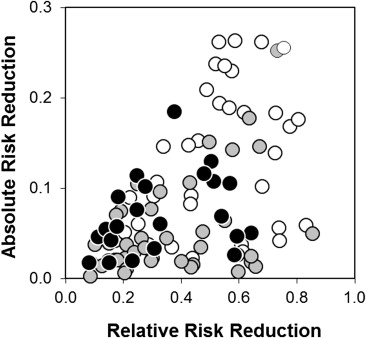
The correlation between the absolute and relative risk reduction, stratified by the primary outcome, is illustrated in Figure 2 . Despite their mathematical dependence (both indexes being simple functions of the underlying event rates), the relative risk reduction and absolute risk reduction correlated weakly (1 − r 2 = 77%, 95% CI 62 to 90).
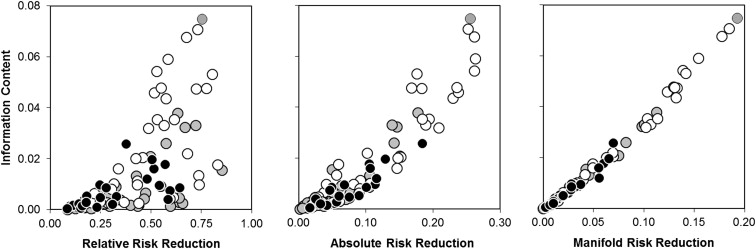
In contrast to the standard measures, the nonstandard measures correlated highly (1 − r 2 = 1.3%, 95% CI 0.9 to 1.9; Figure 3 ). Thus, because information content and manifold risk reduction were directly proportional to each other, either of these nonstandard measures would serve equally to integrate the combined evidentiary content of the standard measures.
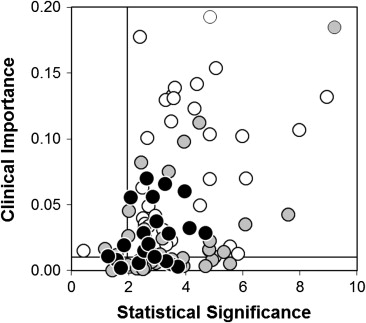
Manifold risk reduction (a putative index of “clinical importance”) and the standardized difference (a putative index of “statistical significance”) correlated weakly (1 − r 2 = 83%, 95% CI 68 to 95; Figure 4 ). Numerical thresholds were therefore assigned to these measures, and each of the 100 trials was thereby classified as important and significant, important but insignificant, significant but unimportant or insignificant and unimportant. Using typical thresholds for significance (a standardized difference of 1.96, equivalent to p = 0.05) and importance (a manifold risk reduction of 0.01, equivalent to a relative risk reduction of 25% and an absolute risk reduction of 4%), 25 of the 100 trials were adjudged significant but unimportant. Thus, from a clinical perspective, 1 in 4 of these trials was “right, but irrelevant.”
Stay updated, free articles. Join our Telegram channel

Full access? Get Clinical Tree


