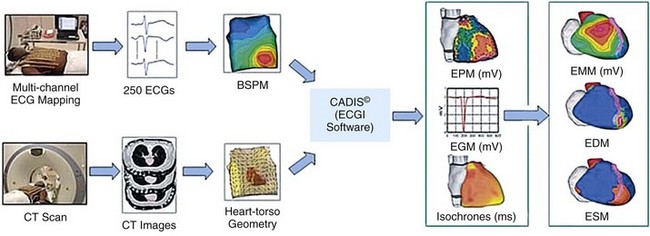
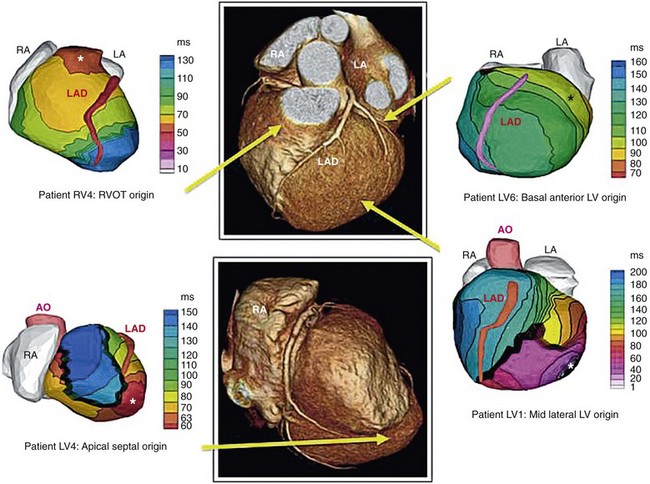
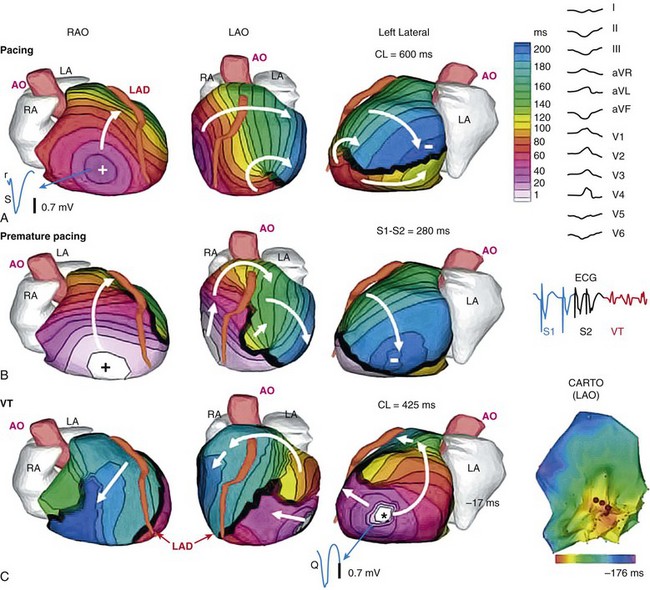
70 Ventricular arrhythmia continues to be a major cause of death and disability; however, our understanding of excitation patterns in the human heart during ventricular tachycardia (VT) and ventricular fibrillation (VF) is limited. Such knowledge is essential for improved diagnosis, prevention, and treatment of VT, and for prevention of its deterioration to VF. It requires detailed mapping of activation during the arrhythmia, which is often dynamically changing (polymorphic) and unstable. In other words, mapping should be conducted simultaneously over the ventricles with sufficient spatial resolution and continuously in time over a sufficiently long duration. These requirements cannot be met with current invasive, catheter-based mapping techniques. Electrocardiographic imaging (ECGI; also called electrocardiographic mapping) is a noninvasive method for electroanatomic mapping developed previously.1,2 ECGI provides continuous maps of activation and repolarization on the epicardial surface of the heart. With ECGI, dynamically changing VT can be mapped to capture its evolution in time, and mapping is conducted under real-world conditions, without the need for sedation, surgery, or other invasive procedures. In this chapter, we provide examples of VT patterns mapped noninvasively with ECGI. In many instances, VT is related to abnormal electrophysiological (EP) substrate associated with anatomic scars. We also provide examples of EP substrate imaging using ECGI in patients after myocardial infarction (MI). This chapter describes previously published studies3–5 and covers ventricular arrhythmias. ECGI applications to atrial arrhythmias have been described elsewhere.6,7 The ECGI methodology has been detailed elsewhere.1,8 Briefly (Figure 70-1), body surface electrocardiographic (ECG) potentials are acquired at 1-ms intervals using 250 electrodes mounted in a vest or in strips. The electrode positions and the patient-specific epicardial geometry are imaged simultaneously using a noncontrast, ECG-gated computed tomographic (CT) scan at 3-mm axial resolution. ECGI algorithms combine the body surface ECG data and CT anatomic data to construct, noninvasively, epicardial potential maps, electrograms (EGM), activation sequences (isochrone maps), and repolarization patterns on the epicardial surface of the heart. For EP substrate imaging, EGM magnitude maps, EGM deflection maps, and EP scar maps (ESMs) were constructed during sinus rhythm. Low-voltage regions and very-low-voltage regions associated with scar were defined by EGMs with an amplitude less than 30% or 15% of the maximum in a given patient’s heart, respectively. The “electrical scar” (abnormal EP substrate associated with a scar) was defined as a region with EGMs characterized by low-voltage and multiple deflections; it was presented visually as ESM. Figure 70-1 The electrocardiographic imaging (ECGI) procedure. Two hundred fifty simultaneously recorded body surface electrocardiograms generate a body surface potential map every millisecond (upper row). A computed tomographic scan provides the body surface electrode positions and heart-torso geometry (lower row). The electrical and geometric information is combined and processed by ECGI algorithms to reconstruct epicardial potential maps noninvasively, epicardial electrograms (EGMs), activation sequences (isochrones), and repolarization patterns. For noninvasive electrophysiological substrate mapping, EGM magnitude maps, EGM deflection maps, and electrical scar maps (ESM) are also constructed. The ESM shows, in red, regions of low-magnitude fractionated (multiple deflections) EGMs. (With permission from Cuculich PS, Zhang J, Wang Y, et al: The electrophysiologic cardiac ventricular substrate in patients after myocardial infarction: noninvasive characterization with ecg imaging [ECGI], J Am Col Cardiol 58:1893–1902, 2011.) ECGI was performed on 25 patients with symptomatic VT or premature ventricular contractions who also underwent invasive, catheter-based EP study (EPS). In patients with spontaneous abnormal ventricular rhythms (18 patients), ECGI was performed before EPS. In other patients, ECGI was performed during EPS, where the rhythm was induced. The ECGI-determined sites of VT origin were in good agreement with the sites identified by the invasive EPS; examples are provided in Figure 70-2. Myocardial depth of the initiation site was determined based on the ECGI-reconstructed EGM morphology at the site of earliest epicardial activation. A pure Q wave morphology indicated an epicardial origin, whereas a small R wave preceding an S wave was indicative of an intramural initiation site. The noninvasive depth determination was consistent with the EPS determination in most cases (92%). Figure 70-2 Localization of ventricular tachycardia (VT) site of origin. Four isochrone maps are shown from four patients. Earliest epicardial activation site is marked with an asterisk. The sites of VT origin, as determined with invasive catheter mapping during EP study, are indicated under each map. Arrows show the VT origin on a representative computed tomographic scan. RA, right atrium; LA, left atrium; AO, aorta; LAD, left anterior descending coronary artery; LV, left ventricle; RVOT, right ventricular outflow tract. (From Wang Y, Cuculich PS, Zhang J, et al. Noninvasive electroanatomic mapping of human ventricular arrhythmias using ECG imaging [ECGI], Sci Trans Med 3;191–200, 2011.) Based on the invasive EPS, VT in 18 patients was judged to be focal. In all 18 patients, ECGI isochrone maps showed a radial spread of excitation from the site of origin. An example from a patient with nonischemic cardiomyopathy is provided in Figure 70-3. ECGI was applied in the EP laboratory, during induction of VT by programmed electrical stimulation. Figure 70-3, A, shows isochrones during baseline pacing (cycle length = 600 ms) from a catheter in the right ventricular (RV) apex (marked by a plus sign). There is a line of block (thick black line) in the lateral left ventricle (LV) that is circumvented by the excitation wavefront. Premature pacing (see Figure 70-3 B; S1-S2 interval = 280 ms) extends functionally the line of block (see Figure 70-3, B), forcing the wavefront to make a longer arc around this line and activate a more inferior region of the LV last (indicated by a minus sign). The first VT beat is shown in Figure 70-3, C; it originates from the location (marked by an asterisk) of latest activation by the S2 premature paced beat in Figure 70-3, B, suggesting that triggered activity is the mechanism of initiation of this focal VT. Note that the local EGM at the site of VT initiation has a pure Q wave morphology, indicating an epicardial origin. An ECGI movie (Video Clip 70-1) is provided to show the dynamic progression in this case. Figure 70-3 Focal ventricular tachycardia (VT) induced by programmed electrical stimulation. A, Epicardial activation isochrones during the drive train (S1). Site of earliest epicardial activation is marked by a plus sign (right anterior oblique view) and corresponds to the position of the underlying endocardial pacing electrode. The reconstructed electrogram (EGM) at this site (blue, blue arrow) is rS in morphology, consistent with endocardial pacing. White arrows show direction of wavefront propagation. The thick black line (left lateral and left anterior oblique views) indicates conduction block; the wavefront pivots around this line and terminates at the site indicated by a minus sign. Twelve-lead surface electrocardiogram (ECG) during VT is shown on the right. B,
Noninvasive Electrocardiographic Imaging of Human Ventricular Arrhythmias and Electrophysiological Substrate
The Electrocardiographic Imaging Method

Examples of Ventricular Tachycardia3,4
Localization of Ventricular Tachycardia Initiation Site

Patterns of Ventricular Tachycardia

![]()
Stay updated, free articles. Join our Telegram channel

Full access? Get Clinical Tree


Noninvasive Electrocardiographic Imaging of Human Ventricular Arrhythmias and Electrophysiological Substrate
