NONINVASIVE CARDIAC IMAGING: ECHOCARDIOGRAPHY, NUCLEAR CARDIOLOGY, AND MRI/CT IMAGING
Rick A. Nishimura ![]() Panithaya Chareonthaitawee
Panithaya Chareonthaitawee ![]() Matthew Martinez
Matthew Martinez
Cardiovascular imaging plays an essential role in the practice of cardiology. Two-dimensional (2D) echocardiography is able to visualize the heart directly in real time using ultrasound, providing instantaneous assessment of the myocardium, cardiac chambers, valves, pericardium, and great vessels. Doppler echocardiography measures the velocity of moving red blood cells and has become a noninvasive alternative to cardiac catheterization for assessment of hemodynamics. Transesophageal echocardiography (TEE) provides a unique window for high-resolution imaging of posterior structures of the heart, particularly the left atrium, mitral valve, and aorta. Nuclear cardiology uses radioactive tracers to provide assessment of myocardial per-fusion and metabolism, along with ventricular function, and is applied primarily to the evaluation of patients with ischemic heart disease. Cardiac MRI and CT can delineate cardiac structure and function with high resolution. They are particularly useful in the examination of cardiac masses, the pericardium, the great vessels, and ventricular function and perfusion. Gadolinium enhancement during cardiac MRI adds information on myocardial perfusion. Detection of coronary calcification by CT as well as direct visualization of coronary arteries by CT angiography (CTA) may be useful in selected patients with suspected coronary artery disease (CAD). This chapter provides an overview of the basic concepts of these cardiac imaging modalities as well as the clinical indications for each procedure.
ECHOCARDIOGRAPHY
TWO-DIMENSIONAL ECHOCARDIOGRAPHY
Basic principles
2D echocardiography uses the principle of ultrasound reflection off cardiac structures to produce images of the heart (Table 12-1). For a transthoracic echocardiogram (TTE), the imaging is performed with a handheld transducer placed directly on the chest wall. In selected patients, a TEE may be performed, in which an ultra-sound transducer is mounted on the tip of an endoscope placed in the esophagus and directed toward the cardiac structures.
TABLE 12-1
CLINICAL USES OF ECHOCARDIOGRAPHY TWO-DIMENSIONAL ECHOCARDIOGRAPHY
Current echocardiographic machines are portable and can be wheeled directly to the patient’s bedside. Thus, a major advantage of echocardiography over other imaging modalities is the ability to obtain instantaneous images of the cardiac structures for immediate interpretation. Thus, echocardiography has become an ideal imaging modality for cardiac emergencies. A limitation of TTE is the inability to obtain high-quality images in all patients, especially those with a thick chest wall or severe lung disease, as ultrasound waves are poorly transmitted through lung parenchyma. Technology such as harmonic imaging and IV contrast agents (which traverse the pulmonary circulation) can be used to enhance endocardial borders in patients with poor acoustic windows.
Chamber size and function
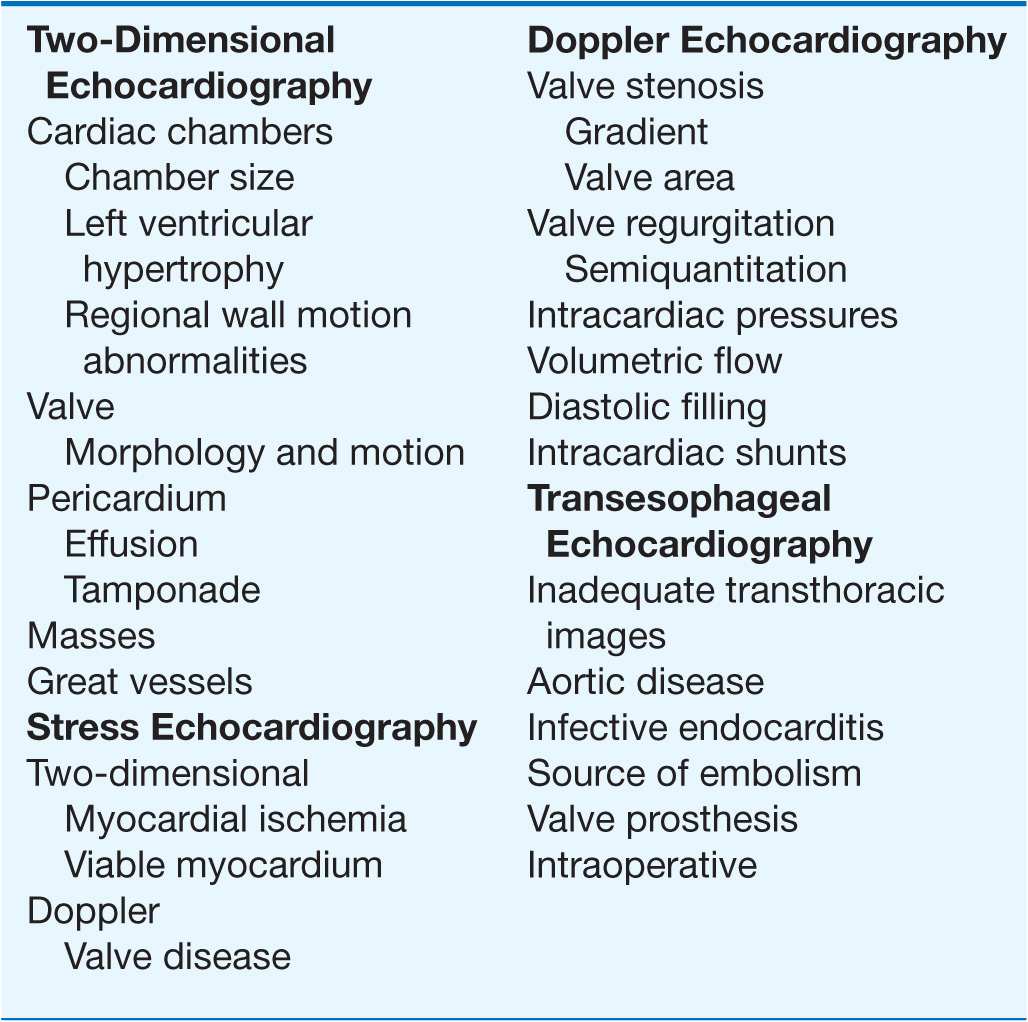
2D echocardiography is an ideal imaging modality for assessing left ventricular (LV) size and function (Fig. 12-1). A qualitative assessment of the ventricular cavity and systolic function can be made directly from the 2D image by experienced observers. 2D echocardiography is useful in the diagnosis of LV hypertrophy and is the imaging modality of choice for the diagnosis of hypertrophic cardiomyopathy. Other chamber sizes are assessed by visual analysis, including the left atrium and right-sided chambers.
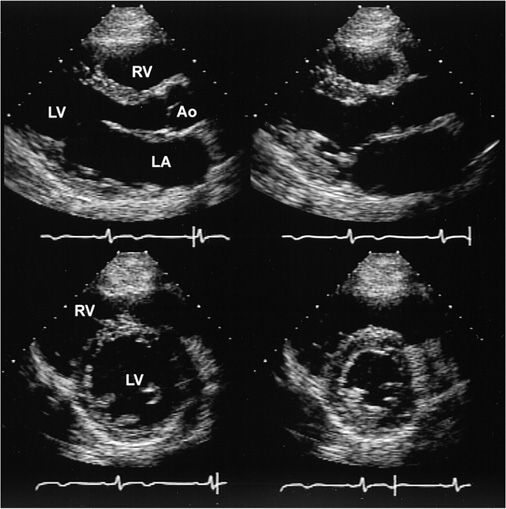
FIGURE 12-1
Two-dimensional echocardiographic still-frame images from a normal patient with a normal heart. Upper: Parasternal long-axis view during systole and diastole (left) and systole (right). During systole, there is thickening of the myocardium and reduction in the size of the left ventricle (LV). The valve leaflets are thin and open widely. Lower: Parasternal short-axis view during diastole (left) and systole (right) demonstrating a decrease in the left ventricular cavity size during systole as well as an increase in wall thickening. LA, left atrium; RV, right ventricle; Ao, aorta.
Valve abnormalities
2D echocardiography is the “gold standard” for imaging valve morphology and motion. Leaflet thickness and mobility, valve calcification, and the appearance of subvalvular and supravalvular structures can be assessed. Valve stenosis is reliably diagnosed by the thickening and decreased mobility of the valve. 2D echocardiography is also the gold standard for the diagnosis of mitral stenosis, which produces typical tethering and diastolic doming, and the severity of the stenosis can be ascertained from a direct planimetry measurement of the mitral valve orifice. The presence and often the etiology of stenosis of the semilunar valves can be made by 2D echocardiography (Fig. 12-2), but evaluation of the severity of the stenosis requires Doppler echocardiography (discussed later). The diagnosis of valvular regurgitation must be made by Doppler echocardiography, but 2D echocardiography is valuable for determining the etiology of the regurgitation, as well as its effects on ventricular dimensions, shape, and function.
FIGURE 12-2
Two-dimensional echocardiographic still-frame images from a patient with aortic stenosis. Parasternal long-axis view shows a heavily calcified aortic valve. RV, right ventricle; LV, left ventricle; Ao, aorta; LA, left atrium.
Pericardial disease
2D echocardiography is the imaging modality of choice for the detection of pericardial effusion, which is easily visualized as a black echolucent ovoid structure surrounding the heart (Fig. 12-3). In the hemodynamically unstable patient with pericardial tamponade, typical echo findings include a dilated inferior vena cava, right atrial collapse, and then right ventricular collapse. Echocardiographically guided pericardiocentesis has now become a standard of care.
FIGURE 12-3
Two-dimensional echocardiographic still-frame image of a patient with a pericardial effusion. Pericardial effusion (PE) is shown as a black echo-free space surrounding the heart. LV, left ventricle.
Intracardiac masses
Intracardiac masses can be visualized on 2D echocardiography, provided that image quality is adequate. Solid masses appear as echo-dense structures, which can be located inside the cardiac chambers or infiltrating into the myocardium or pericardium. LV thrombus appears as an echo-dense structure, usually in the apical region associated with regional wall motion abnormalities. The appearance and mobility of the thrombus are predictive of embolic events. Vegetations appear as mobile linear echo densities attached to valve leaflets. Atrial myxoma can be diagnosed by the appearance of a well-circumscribed mobile mass with attachments to the atrial septum (Fig. 12-4). The high-resolution images provided by TEE may be required for further delineation of myocardial masses, especially those <1 cm in diameter.
FIGURE 12-4
Transesophageal still-frame echocardiographic images of a patient with a left atrial myxoma. There is a large echo-dense mass in the left atrium, attached to the atrial septum. The mass moves across the mitral valve in diastole. LV, left ventricle; RV, right ventricle.
Aortic disease
2D echocardiography can provide extremely useful information on diseases of the aorta. The proximal ascending aorta, the arch, and the distal descending aorta can usually be visualized via the transthoracic approach. The definitive diagnosis of a suspected aortic dissection usually requires a TEE, which can rapidly provide high-resolution images of the proximal ascending and descending thoracic aorta (Fig. 12-5).
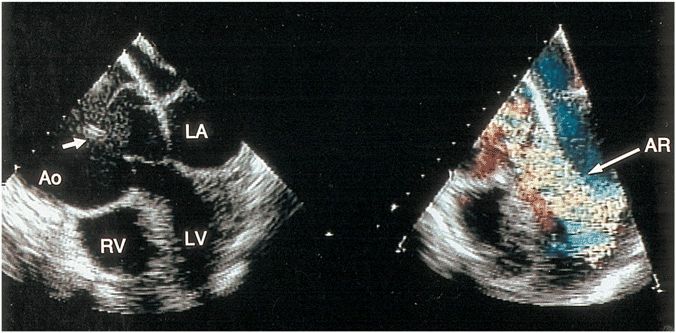
FIGURE 12-5
Transesophageal still-frame echocardiographic view of a patient with a dilated aorta, aortic dissection, and severe aortic regurgitation. The arrow points to the intimal flap that is seen in the dilated ascending aorta. Left: The long-axis apex-down view of the black-and-white two-dimensional image in diastole. Right: Color-flow imaging that demonstrates a large mosaic jet of aortic regurgitation. Ao, aorta; RV, right ventricle; AR, aortic regurgitation.
DOPPLER ECHOCARDIOGRAPHY
Basic principles
Doppler echocardiography uses ultrasound reflecting off moving red blood cells to measure the velocity of blood flow across valves, within cardiac chambers, and through the great vessels. Normal and abnormal blood flow patterns can be assessed noninvasively. Color-flow Doppler imaging displays the blood velocities in real time superimposed upon a 2D echocardiographic image. The different colors indicate the direction of blood flow (red toward and blue away from the transducer), with green superimposed when there is turbulent flow. Pulsed-wave Doppler measures the blood flow velocity in a specific location on the 2D echocardiographic image. Continuous-wave Doppler echocardiography can measure high velocities of blood flow directed along the line of the Doppler beam, such as occur in the presence of valve stenosis, valve regurgitation, or intracardiac shunts. These high velocities can be used to determine intracardiac pressure gradients by a modified Bernoulli equation:
Pressure change = 4 times (velocity)2
Tissue Doppler echocardiography measures the velocity of myocardial motion. Myocardial velocities can be used to determine myocardial strain rate, which is a quantitative measure of regional myocardial contraction and relaxation.
Valve gradients
In the presence of valvular stenosis, there is an increase in the velocity of blood flow across the stenotic valve. A continuous-wave Doppler can be used to determine the pressure gradient across the valve (Fig. 12-6). A valve area can also be calculated from the Doppler velocities.
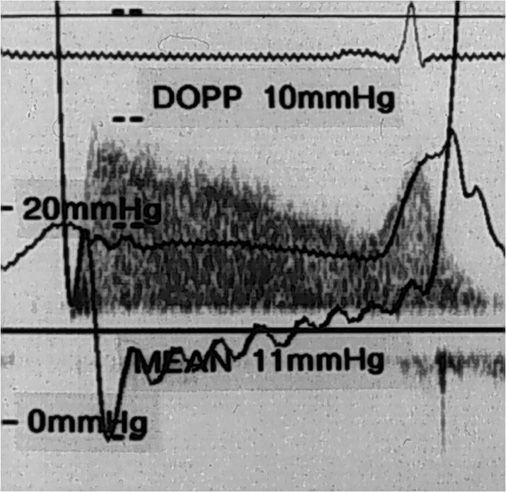
FIGURE 12-6
Continuous-wave Doppler of mitral valve velocities in a patient with mitral stenosis. The mean gradient calculated from Doppler (DOPP) of 10 mmHg is similar to the mean gradient of 11 mmHg from simultaneous cardiac catheterization in this patient.
Valvular regurgitation
Valvular regurgitation is diagnosed by Doppler echo-cardiography when there is abnormal retrograde flow across the valve. Color-flow imaging is the Doppler method used most frequently to detect valve regurgitation by visualization of a high-velocity turbulent jet in the chamber proximal to the regurgitant valve (Fig. 12-7). The size and extent of the color-flow jet into the receiving cardiac chamber provide a semiquantitative estimate of the severity of regurgitation.
FIGURE 12-7
Left: Transesophageal echocardiographic view of a patient with severe mitral regurgitation due to a flail posterior leaflet. The arrow points to the portion of the posterior leaflet that is unsupported and moves into the left atrium during systole. Right: Color-flow imaging demonstrating a large mosaic jet of mitral regurgitation during systole. LA, left atrium; LV, left ventricle; AV, aortic valve.
Intracardiac pressures
These can be calculated from the peak continuous-wave Doppler signal of a regurgitant lesion, which reflects the pressure gradient between two cardiac chambers. This approach is commonly applied to a tricuspid regurgitant jet, from which the systolic pressure gradient between the right atrium and right ventricle can be calculated, yielding an accurate measurement of pulmonary artery systolic pressure (Fig. 12-8).
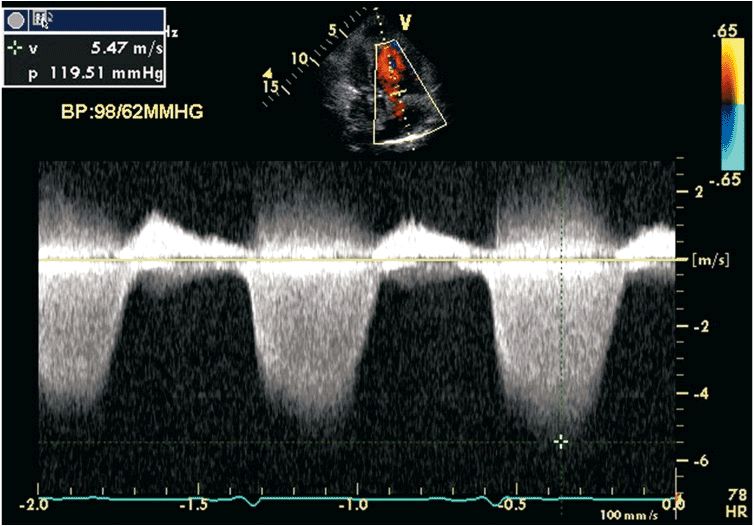
FIGURE 12-8
Continuous-wave Doppler of tricuspid regurgitation in a patient with pulmonary hypertension. There is an increase in the velocity to 5.4 m/s. Using the modified Bernoulli equation, the peak pressure gradient between the right ventricle and right atrium during systole is 116 mmHg. Assuming a right atrial pressure of 10 mmHg, the right ventricular systolic pressure is 126 mmHg. In the absence of right ventricular outflow tract obstruction, this indicates there is severe pulmonary hypertension with a pulmonary artery systolic pressure of 126 mmHg.
Cardiac output
Volume flow rates (or stroke volume and cardiac output) can be reliably measured noninvasively by Doppler echocardiography. Flow is calculated as the product of the cross-sectional area of the vessel or chamber through which blood moves and the velocity of blood flow as assessed by Doppler.
Diastolic filling
Doppler echocardiography allows noninvasive evaluation of ventricular diastolic filling. The transmitral velocity curves reflect the relative pressure gradients between the left atrium and ventricle throughout diastole and are influenced by the rate of ventricular relaxation, the driving force across the valve, and the compliance of the ventricle. In the early phase of diastolic dysfunction there is primarily an impairment of LV relaxation, with reduced early transmitral flow and a compensatory increase in flow during atrial contraction (Fig. 12-9). As disease progresses and ventricular compliance declines, left atrial pressure rises, resulting in a higher early transmitral velocity and shortening of the deceleration of flow in early diastole. Analysis of Doppler tissue velocities of annular motion and myocardial strain provides further information concerning the diastolic properties of the heart.
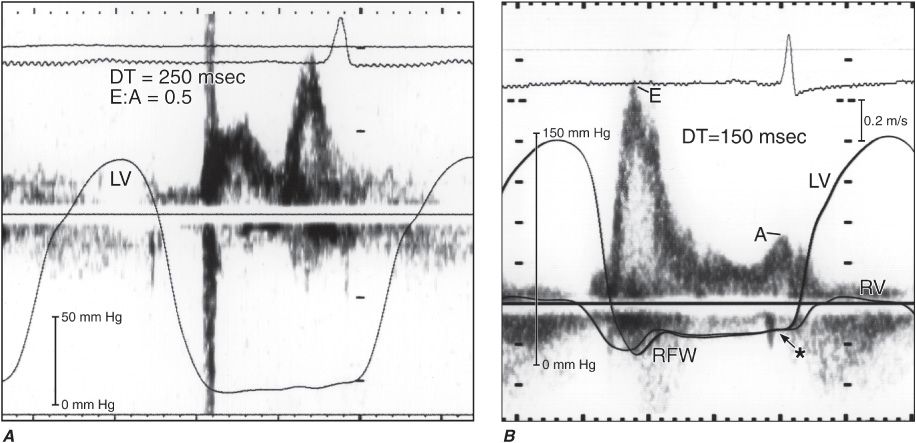
FIGURE 12-9
High-fidelity left ventricular (LV) pressure curves superimposed on a mitral inflow velocity curve obtained by Doppler echocardiography. The ratio of early and late diastolic flows is termed the E:A ratio. The deceleration time (DT) measures the rate of decline of early velocity and reflects the effective operative compliance of the left ventricle. Left: In early stages of diastolic dysfunction, there is an abnormality of relaxation. There is a decrease in the early diastolic filling and an increase with filling at atrial contraction, resulting in a low E:A ratio of 0.5, with a deceleration time (DT) of 250 ms. In this instance, the LV diastolic pressure is low at 6 mmHg. Right: As diastolic dysfunction progresses, there is a restriction to filling, in which there is a high early diastolic velocity and low velocity at atrial contraction resulting in a high E:A ratio of 3.0, with DT of 150 ms. In this instance, the LV diastolic pressure is markedly elevated to 34 mmHg.
Congenital heart disease
2D and Doppler echocardiography have been useful in the evaluation of patients with congenital heart disease. Congenital stenotic or regurgitant valve lesions can be assessed. The detection of intracardiac shunts is possible by 2D and Doppler echocardiography. Patency of surgical shunts and conduits can also be evaluated.
STRESS ECHOCARDIOGRAPHY
2D and Doppler echocardiography are usually performed with the patient in the resting state. Further information can be obtained by reimaging during either exercise or pharmacologic stress. The primary indications for stress echocardiography are to confirm the suspicion of ischemic heart disease and determine the extent of ischemia.
A decrease in systolic contraction of an ischemic area (segment) of myocardium, termed a regional wall motion abnormality, occurs before symptoms or electrocardiographic changes (Fig. 12-10). New regional wall motion abnormalities, a decline in ejection fraction, and an increase in end-systolic volume with stress are all indicators of myocardial ischemia. Exercise stress testing is usually done with exercise protocols using either upright treadmill or bicycle exercise. In patients who are not able to exercise, pharmacologic testing can be performed by infusion of dobutamine to increase myocardial oxygen demand. Dobutamine echocardiography has also been used to assess myocardial viability in patients with poor systolic function and concomitant CAD; when used for this purpose, dobutamine is administered at lower doses than standard pharmacologic stress doses.
Stay updated, free articles. Join our Telegram channel

Full access? Get Clinical Tree


