Fig. 34.1
Continuous multimodal neuromonitoring during postcardiotomy ECMO; on the upper side, the neurophysiological, NIRS, and TCD monitoring are highlighted
34.3 Neurophysiological Monitoring of Brain Function
Brain function can be monitored directly by EEG and SEPs, the spectrograms of which correlate directly with CBF (cerebral blood flow) [4, 5]. A gradual reduction in cerebral perfusion is associated initially with changes in synaptic transmission and at the end with neuron death due to the impossibility of maintaining the electrochemical gradient of the cell membrane. Normally, CBF is approximately 50–80 ml/100 g/min. Moderate hypoperfusion up to values of 30 ml/100 g/min is well tolerated and does not cause neuron dysfunction; when the flow decreases below the functional limit (25 ml/100 g/min), both the EEG and SEPs begin to change. The functional limit is not time dependent, but the injury limit is. The necrosis area increases with time beyond the injury limit.
EEG and SEPs disappear at flow values of about 12–15 ml/100 g/min, although some authors consider that cortical SEPs disappear at a flow that is 20 % less than the flow necessary to bring about an isoelectric EEG [6].
Between the functional and injury limit is the ischaemic penumbra: the brain tissue in this area is electrically silent and not functional but still vital [7]. The ischaemic penumbra is a dynamic area extending from the periphery of an infarcted area, and its progression from functional damage to structural damage depends on the timing and efficacy of therapy.
The ischaemic penumbra can evolve to functional recovery if the flow increases or to necrosis if the ischaemia persists. Thus, the potential regression of the ischaemic penumbra area introduces a basic concept for brain recovery that is directed at preventing or minimising a secondary lesion by improving DO2, reducing CMRO2 (brain metabolism), and reducing reperfusion damage. There is no doubt that the duration and size of the ischaemia influence the degree of brain damage. There are regional differences in resistance to ischaemic damage that depend on metabolic activity, differing susceptibility to ischaemia, availability of collateral pathways, and capillary density. A reduction in EEG and SEP amplitude, slowing of the EEG, and increased latency of the SEPs indicate that the functional limit of CBF has been reached.
These changes are extremely important during extracorporeal perfusion of the patient because they provide an alarm signal that goes off before the brain lesion becomes irreversible. If the proper steps are taken to increase the CBF (increasing the pump rate or administering vasoconstrictors) or in general the DO2 and reduce brain metabolism (increasing the depth of sedation or level of hypothermia), the functional limit will not be reached.
34.3.1 EEG
Much of the literature agrees that gradual reduction in CBF produces an attenuation in the EEG with amplitude reduction and slowing at a frequency expressed by a reduction in alpha rhythm (α, 8–13 Hz) and beta rhythm (ß, >14 Hz) and an increase in theta rhythm (θ, 5–7 Hz) and delta rhythm (δ, 0.5–4 Hz). These changes can be generalised (global ischaemia) or regional (focal ischaemia). The degree of ischaemia is associated with the severity of the electroencephalographic changes; the EEG cannot evaluate the entire cerebral cortex and is less effective in distinguishing changes in subcortical structures. In addition, the asymmetry between the hemispheres is considered significant in patients given stable sedation or anaesthesia to induce electroencephalographic suppression.
The EEG changes may have latency from 10 s after a cardiac arrest [8] and up to 3 min after an embolic injury [9]. In general, the EEG has had a secondary role with respect to the somatosensory evoked potentials in given information about the neurological prognosis; recently, some studies have pointed out the high predictive value of an accurate neurological prognosis from a good and reactive EEG in the acute phase of post-anoxic coma. A good EEG is considered a continuous pattern without a period of suppression, while isoelectric or low voltage and burst suppression are considered EEG patterns associated with a negative outcome [10]. Moreover, one of the most important EEG patterns that can be detected is nonconvulsive status epilepticus; rapid recognition guarantees early treatment.
Fourier spectral analysis is an established method of quantitative analysis of the EEG and is useful for providing data in tighter groups for easier interpretation and early identification of brain ischaemia [11]. The data from the Fourier analysis can be presented in the form of CSA (compressed spectral analysis) or DSA (modulated-density spectral analysis); CSA and DSA are both graphic representations based on finding a total reduction in the power of the tracing and/or an increase in the power of the components in the θ- and δ-slow bands (Figs. 34.2 and 34.3).
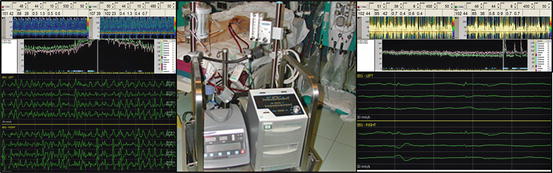
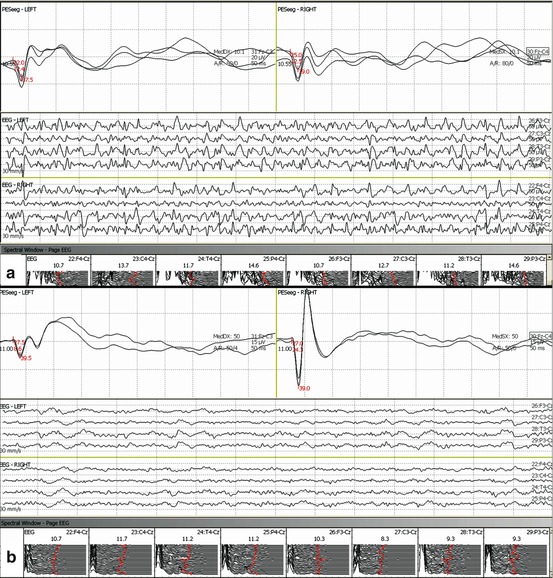
Fig. 34.2
TCD-EEG coupling during ECMO. Left side: a nonconvulsive status epilepticus at EEG (lower) induced an increase of blood-flow velocity at TCD (upper). Right side: showers of gas microemboli (TCD upper) induced a further decrease in amplitude of EEG signals (lower)
Fig. 34.3
Two possible neurophysiological scenarios of patients with good outcomes. Bilateral somatosensory evoked potentials of normal amplitude and with both middle- and long-latency waves; nonconvulsive status epilepticus on the upper side (a) and a low-voltage theta and delta rhythm at the lower side (b)
34.3.2 Somatosensory Evoked Potentials (SEPs)
SEPs are used more than BAEPs (brainstem auditory evoked potentials) and VEPs (visual evoked potentials) to find cerebral ischaemia because they provide a direct correlation between function and perfusion of the territory of the middle cerebral artery. They are less sensitive to pharmacological depression brought about by the anaesthetic agents and are also easier to monitor because the cortical somatosensory projections are located on the convexity of the hemispheres.
The cortical generators of N20 are located in the territory of the middle cerebral artery. A flow reduction below the electrical compromise threshold produces desynchronisation of the activity of the cortical neurons and reduction in the number of functional neurons with a reduction in amplitude.
Numerous studies propose using the N20 parietal amplitude as the diagnostic criterion of cerebral hypoperfusion [5, 12]. It is believed that the latency of SEPs is less sensitive with respect to amplitude in the case of reduced CBF because the metabolic requirement of the white substance (axonal) is less than that of the grey substance (neuronal bodies) [13]. Nonetheless, the CCT (central conduction time) is always measured: this variable reflects electrical conduction between the spinal medulla, the trunk, and the other subcortical hemispherical areas. The significant values are a reduction in N20 amplitude of greater than 50 % and an increase in the CCT of 1 ms [14] or 20 % relative to the baseline value [15].
Both anaesthesia and hypothermia induce a reduction of cerebral metabolism during ECMO and influence brain function. Hypothermia and anaesthesia bring about a gradual, symmetrical change in the EEG and, at temperatures below 30°, in SEP as well. Moderate and mild hypothermia (body temperature over 30 °C) is associated with a reduction in EEG amplitude and frequency. The EEG becomes isoelectric at 22–25 °C [16].
The SEPs react to steady-state hypothermia with an increase in latency and amplitudes of the peripheral and cortical potentials at temperatures over 30°. Below 28–30°, the SEP amplitude reduces [17]. The N20 and P14 components of the SEP can disappear between 15–26 °C and 15–20 °C nasopharyngeal temperature, respectively [16, 17].
Most of the anaesthetic agents cause similar effects in the cortical EEG and SEPs, with the exception of ketamine. These anaesthetic drugs initially cause an increase in the speed of the EEG tracing, which consists of disappearance of the α-rhythm and appearance of a β-rhythm, followed by gradual synchronisation and postero-frontal slowing with subsequent appearance of θ- and δ-rhythms. Increasing the dose of anaesthesia appears as a burst suppression pattern followed by a gradual increase in the isoelectric period until the isoelectric pattern emerges.
Generally the effects of total intravenous sedation on the cortical SEPs, expressed by increased latency and reduction in amplitude, are irrelevant. Opiates may cause slowing of the EEG and the appearance of δ-waves at high amplitudes; the effect on the SEPs, however, is negligible.
Finally, curarisation does not affect the neurophysiological electrical signals; on the contrary, it may bring about an increase in SEP amplitude due to a better signal-to-noise ratio caused by the removal of muscular artefacts.
In addition to standard clinical examination, SEPs improve the accuracy of neurological prognosis of comatose patients from multifactorial etiopathogenetics [18]. Regarding cardiac arrest and therapeutic hypothermia, it has been shown that a multidisciplinary approach composed of the Glasgow Coma Scale (GCS), patient’s pupil light reactivity, corneal reflexes, serum neuron-specific enolase, and short-latency somatosensory evoked potentials (N20/P25) improves the accuracy of neurological prognosis [19]. Indeed, the bilateral absence of the early cortical SEP (i.e. N20/P25) has a high predictive value for adverse outcomes such as death or survival in a vegetative state. However, the presence of N20/P25 is not sensitive enough to predict a good neurological outcome [18]. It is well established that only event-related evoked potentials (i.e. P300) and the presence of middle-latency cortical somatosensory evoked potentials (MLCEP) strongly correlate with a favourable neurological prognosis in patients affected by severe brain injury [20, 21].
The appearance of MLCEP can be produced by an electrical stimulation on the median nerve, because the SEP responses can reflect a more integrated cerebral processing of pain that includes primary and secondary somatosensory cortices: the insular, anterior cingulate, and prefrontal cortices [22].
Pain-related MLCEP may be a measure to predict good neurological outcomes in comatose patients, as demonstrated by previous studies without a pain-related method [23]. Given that only high-intensity stimulation would generate MLCEP, this method allows the detection of the quiescent brain network in the ischaemic penumbra and represents a dynamic test of brain availability; it can be considered a sort of neurophysiological GCS with which the clinicians can evaluate the brain’s reactivity to painful stimulation [24]. Interestingly, this method might also be a useful tool to evaluate brain connectivity in patients without normal EEG patterns (e.g. the NCSE).
SEP is a stable signal, is reproducible, and is more resistant to temperature changes, anaesthesia changes, and electrical interference. It also gives information on subcortical structures. SEP provides information on the function of the somatosensory area and, indirectly, on the rest of the parenchyma perfused by the middle cerebral artery. Moreover, exploring neurophysiological reactivity with the painful stimulation gives the physician the chance to gain information on brain function with an isoelectric EEG trace.
The neurophysiological evaluation also provides the possibility of testing other brain functions such as motor, acoustic, and visual, which can contribute to a better definition of the neurological prognosis.
Stay updated, free articles. Join our Telegram channel

Full access? Get Clinical Tree


