Although most of the additional increases in coronary heart disease morbidity and mortality are estimated to occur outside developed regions such as North America and Europe, few nationwide studies have been published of acute myocardial infarction (MI) epidemiology from other regions. We thus sought to expand the global data regarding MI trends. Nationwide trends of incident MI, ST-segment elevation MI (STEMI), and non–ST-segment MI (non-STEMI) were analyzed during a 17-year period in Australia. We identified 714,262 hospitalizations for MI from 1993 to 2010, representing 331,871,389 person-years. During the study period, the age- and gender-adjusted incidence of all MIs increased from 215 to 251 cases per 100,000 person-years, a relative increase of 76% (p <0.0001 for trend). The adjusted incidence of STEMI decreased from 147 to 70 cases per 100,000 person-years, a relative decrease of 30% (p <0.0001 for trend). In contrast, the adjusted incidence of non-STEMI increased from 67 to 182 cases per 100,000 person-years, a relative increase of 315% (p <0.0001 for trend). Age-specific analyses suggested that statistically significant increases in MI incidence were present in those aged <50 and ≥80 years. In conclusion, although it has previously been suggested that declining trends in MI incidence in North American and European reports might be generalizable given the seemingly consistent observations thus far, the present results highlight the possibility that other global populations might have less favorable trends. The incidence of MI in Australia might not be decreasing as rapidly as that seen in other regions and requires additional exploration.
Given the public health burden associated with coronary heart disease, monitoring the trends in acute myocardial infarction (MI) is of critical importance. Previous reports have proposed that the epidemiology of MI might be changing, suggesting that the evolving strategies for primary and secondary prevention of MI could be contributing to a decreasing incidence of MI. Although these existing studies have provided invaluable insights into the epidemiology of MI, they have been predominantly conducted in cohorts drawn from North American or European populations. It has been estimated that >80% of the future increase in morbidity and mortality from coronary heart disease will occur outside developed regions such as North America and Europe. Given these statistics, a need exists for additional studies in diverse sociodemographic settings and countries. In the present report, we have described the nationwide trends in the incidence of MI across all of Australia, expanding the global data regarding the epidemiology of MI.
Methods
Australia has a racially and culturally diverse population of 22.8 million. Since 1993, the Australian Institute of Health and Welfare has maintained the National Hospital Morbidity Data Set, a source that includes information on patient care at every public and private hospital in Australia. The proportion of missing data is negligible, representing <0.004% annually.
From this data set, we identified hospitalizations with a primary discharge diagnosis of acute MI using on the International Classification of Diseases, 9th Revision, Clinical Modification (ICD-9-CM) and International Classification of Diseases, 10th Revision, Australian Modification (ICD-10-AM) from 1993 to 1997 and 1998 to 2010, respectively. ICD-9-CM codes 410.0 to 410.6 and 410.8 and ICD-10-AM codes I21.0 to I21.3 were classified as STEMI. ICD-9-CM codes 410.7 and 410.9 and ICD-10-AM codes I21.4 and I21.9 were classified as non-STEMI. To determine the accuracy and consistency of diagnostic coding over time, we performed a detailed chart review of 50 hospitalizations annually (25 presumed STEMIs and 25 presumed non-STEMIs) from 1993 to 2010. We applied standardized criteria from the joint European Society of Cardiology and American College of Cardiology Global Task Force. The positive predictive value of the categorization scheme was 98.6% for any MI, 78.5% for STEMI and 91.5% for non-STEMI, with no significant differences for the latter 2 conditions across the years.
We calculated the incidence rates for all MIs, STEMIs, and non-STEMIs (per 100,000 person-years) for each year. For the denominator, the total person-months in each year were calculated in 10-year age groups (<50, 50 to 59, 60 to 69, 70 to 79, and ≥80 years). The incidence rates were directly standardized using the age and gender structure of the Australian population in 2010. Population estimates were sourced from the Australian Bureau of Statistics. Time trends in the yearly number of incident MI, both overall and separately for STEMI and non-STEMI, were assessed using negative binomial regression models. In the models, the year was fitted as a continuous predictor, and age group, gender, and the interaction between age group and gender were included as categorical predictors to control for population changes over time. Similarly, a negative binominal regression model was used to assess whether the time trends in incident MI varied according to age group. In the model year (continuous), age group, gender, and the interaction between age group and year were included as predictors. The natural logarithm of the population size for each year, gender, and age group combination were also included as an offset variable in these models. All analyses were conducted using Statistical Analysis Systems, version 9.3 (SAS Institute, Cary, North Carolina), and statistical significance was set at p <0.05.
Results
We identified 714,262 hospitalizations for MI from July 1993 to July 2010 (representing a period of 331,871,389 person-years; Table 1 ). Overall, 333,538 hospitalizations (46.7%) were for STEMI and 380,724 (53.5%) for non-STEMI. The proportion of MIs that were STEMI decreased from 69.3% in 1993 to 27.7% in 2010.
| Year | All MIs | STEMIs | Non-STEMIs | Incidence (per 100,000 Population) | ||
|---|---|---|---|---|---|---|
| All MIs | STEMIs | Non-STEMIs | ||||
| 1993 | 31,195 | 21,616 | 9,579 | 176.5 | 122.3 | 54.2 |
| 1994 | 31,623 | 21,952 | 9,671 | 177.1 | 122.9 | 54.2 |
| 1995 | 32,999 | 23,192 | 9,807 | 182.6 | 128.3 | 54.3 |
| 1996 | 32,808 | 22,975 | 9,833 | 179.1 | 125.5 | 53.7 |
| 1997 | 33,261 | 22,770 | 10,491 | 179.6 | 123.0 | 56.6 |
| 1998 | 33,550 | 21,279 | 12,271 | 179.3 | 113.7 | 65.6 |
| 1999 | 35,418 | 20,684 | 14,734 | 187.1 | 109.3 | 77.8 |
| 2000 | 37,672 | 20,847 | 16,825 | 196.6 | 108.8 | 87.8 |
| 2001 | 40,330 | 20,871 | 19,459 | 207.7 | 107.5 | 100.2 |
| 2002 | 43,766 | 19,153 | 24,613 | 222.6 | 97.5 | 125.2 |
| 2003 | 46,884 | 17,704 | 29,180 | 235.6 | 89.0 | 146.6 |
| 2004 | 47,631 | 16,291 | 31,340 | 236.6 | 80.9 | 155.7 |
| 2005 | 49,534 | 15,550 | 33,984 | 242.8 | 76.2 | 166.6 |
| 2006 | 51,666 | 15,917 | 35,749 | 249.5 | 76.9 | 172.7 |
| 2007 | 55,676 | 15,811 | 39,865 | 264.8 | 75.2 | 189.6 |
| 2008 | 55,223 | 16,095 | 39,138 | 258.3 | 75.3 | 183.1 |
| 2009 | 44,003 | 15,222 | 39,781 | 251.4 | 69.6 | 181.8 |
| Relative increase 1993–2009 ∗ (%) | 76.3 | −29.6 | 315.3 | 42.3 | −43.1 | 235.3 |
∗ 2009 value minus 1993 value divided by 1993 value multiplied by 100.
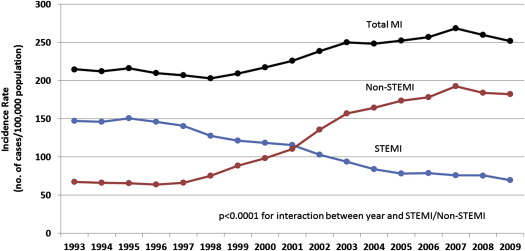
The age- and gender-standardized incidence of MI increased from 215 cases per 100,000 person-years in 1993 to 251 cases per 100,000 person-years in 2010, a relative increase of 76% ( Figure 1 ). The age- and gender-adjusted incidence of STEMI decreased from 147 cases per 100,000 person-years to 70 cases per 100,000 person-years, a relative decrease of 30%. In contrast, the age- and gender-standardized incidence of non-STEMI increased from 67 cases per 100,000 person-years to 182 cases per 100,000 person-years, a relative increase of 315%.

Negative binomial regression analysis revealed an increase of 1.98% annually in MIs, a decrease of 4.81% annually in STEMI and an increase of 9.20% annually in non-STEMI (p <0.0001 for all; Table 2 ). A significant interaction was found between year and MI type, suggesting differing trends over time for incident STEMI and non-STEMI (p <0.0001).
| Variable | Rate Ratio | 95% Confidence Interval | p Value |
|---|---|---|---|
| Overall MI | 1.020 | 1.017–1.023 | <0.0001 |
| STEMI | 1.092 | 1.085–1.100 | <0.0001 |
| Non-STEMI | 0.952 | 0.945–0.959 | <0.0001 |
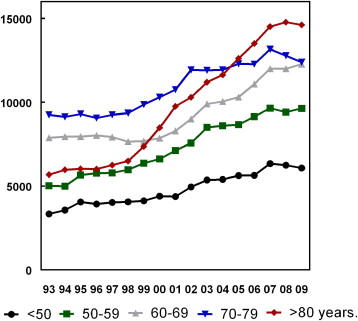
When stratified by age group, negative binomial regression analysis revealed a statistically significant interaction in MI incidence among the age groups over time, suggesting the temporal trends differed among the age groups (p = 0.017; Figure 2 ). Both the <50- and ≥80-year age groups demonstrated statistically significant increases in MI incidence (3.88% and 2.88 annually, respectively; Table 3 ).

| Age Group (y) | Rate Ratio | 95% Confidence Interval | p Value |
|---|---|---|---|
| <50 | 1.039 | 1.023–1.055 | <0.0001 |
| 50–59 | 1.015 | 0.999–1.030 | 0.07 |
| 60–69 | 1.006 | 0.991–1.022 | 0.45 |
| 70–79 | 1.009 | 0.993–1.024 | 0.29 |
| ≥80 | 1.029 | 1.013–1.045 | 0.0004 |
Stay updated, free articles. Join our Telegram channel

Full access? Get Clinical Tree


