The acute impact of hypertensive crisis, and changes after treatment, on left ventricular (LV) systolic and diastolic function using comprehensive echocardiography, including speckle tracking, has not been well characterized. Thirty consecutive patients admitted to the hospital from the emergency room with hypertensive crisis underwent Doppler echocardiography at baseline and after blood pressure optimization. The mean age of the patients was 54 ± 13 years, with 19 men (63%). The most common presenting symptoms included dyspnea (70%), chest pain (43%), and altered mental status (13%). Mean systolic and diastolic blood pressures at presentation were 198 ± 12 and 122 ± 12 mm Hg, decreasing to 143 ± 15 and 77 ± 12 mm Hg (p <0.001 for both) after treatment. There was no significant change in LV ejection fraction between baseline and follow-up (48 ± 18% vs 46 ± 18%, p = 0.50); however, global longitudinal LV systolic strain (−10 ± 4% to −12 ± 4%, p = 0.01) and global systolic strain rate (−1.0 ± 0.4 vs −1.4 ± 0.6 s −1 , p = 0.01) significantly improved. Mean global early diastolic strain (−7.2 ± 4.0% to −9.4 ± 2.9%, p = 0.004) and early diastolic strain rate (0.3 ± 0.2 to 0.5 ± 0.4 s −1 , p = 0.05) also improved after treatment. On multivariate analysis, the independent predictors of LV longitudinal strain at follow-up were LV ejection fraction (p <0.001), heart rate (p = 0.005), systolic blood pressure (p = 0.04), and left atrial volume index (p = 0.05). In conclusion, as opposed to LV ejection fraction, LV systolic strain and strain rate were depressed during hypertensive crisis and significantly improved after medical treatment. LV diastolic function, assessed using conventional and speckle-tracking parameters, was also depressed and significantly improved after treatment.
Hypertensive crisis, including urgency and emergency, is an important cause of hospital visits to the emergency room. Yet there are few data on the impact of acute worsening of blood pressure on left ventricular (LV) systolic and diastolic function using conventional and advanced Doppler echocardiographic parameters. One study assessed the impact of acute hypertensive crisis with pulmonary edema on LV ejection fraction (LVEF) but did not find a significant change in LVEF after the optimization of blood pressure. Several reports have demonstrated reduced longitudinal and circumferential systolic strain (ε) as well as early and late diastolic ε in patients with hypertension in various stages, and myocardial global longitudinal ε has been reported to be a superior predictor of mortality compared with LVEF and wall motion systolic index. It has further been demonstrated that speckle-tracking imaging may be more sensitive than LV volumetric changes, as speckle-tracking ε and strain rate (SR) (correlating with myocardial deformation and the rate of deformation, respectively) may be more sensitive to pathologic changes than LVEF. However, it is unknown if hypertensive crisis is associated with LV systolic and diastolic abnormalities as assessed by speckle-tracking imaging and if acute treatment of hypertensive crisis results in significant improvement in function. Therefore, we hypothesized that speckle-tracking echocardiography would identify LV systolic and diastolic abnormalities associated with hypertensive crisis that would improve with treatment and, furthermore, that these abnormalities and subsequent improvement would not necessarily be detected by changes in LVEF.
Methods
This study was conducted at a tertiary-level academic public hospital in Houston, Texas. All patients presenting to the emergency room with symptoms or signs consistent with hypertensive emergency or urgency (hypertensive crisis) were eligible for inclusion in this study. Patients were included in the study if they had presenting blood pressures ≥180 mm Hg systolic or ≥120 mm Hg diastolic (recorded by emergency room medical staff members on presentation) in addition to clinical evidence of chest pain, shortness of breath, altered mental status, cerebrovascular accident (including transient ischemic attack and stroke), or acute renal failure. All patients who were included in this study underwent 2 separate transthoracic echocardiographic exams, first at initial screening in the emergency room while blood pressure was still elevated within the aforementioned parameters, with follow-up echocardiography performed ≥48 hours after hospital admission when medical optimization of blood pressure had been achieved.
Baseline and follow-up echocardiographic exams were performed using a GE Vivid 7 ultrasonographic machine (GE Medical Systems, Milwaukee, Wisconsin). Two-dimensional measurements were performed according to the American Society of Echocardiography and included LVEF by the biplane method of discs, maximal left atrial volume by the method of discs, and LV mass by the area-length method; the latter 2 variables were indexed to body surface area. Studies were analyzed by echocardiologists blinded to all clinical data. Mitral inflow measurements included peak early (E) and peak late (A) velocities, the E/A ratio, and the deceleration time of E. Three cardiac cycles were measured and averaged for all Doppler measurements. For 2-dimensional speckle tracking, images of LV myocardium were obtained with a frame rate ≥60 frames/s (mean frame rate 82 ± 9).
Measurements of 2-dimensional ε and SR were performed by off-line analysis. The endocardial border was manually traced, and a myocardial region of interest was then automatically identified by the software package (EchoPAC Dimension ’06; GE Medical Systems). As previously described, systolic, early diastolic, and late diastolic event timing was based on the timing of these respective events on SR imaging; in this way, the time from peak QRS to these events was measured with SR imaging and the same time intervals were used to identify these respective events for ε imaging. In systole, ε and SR were measured in the parasternal short-axis views at the papillary muscle level to determine circumferential ε and SR and in the 3 apical views (which were then averaged) to determine longitudinal ε and SR. Similarly, in diastole, early and late diastolic ε and SR were determined in the circumferential and longitudinal vectors.
Continuous data are presented as mean ± SD and categorical data as number (percentage). For continuous variables, Student’s t test was performed, and for dichotomous variables, the chi-square test was used. Linear regression was performed to determine the correlation between continuous variables, and multivariate regression was performed to determine independence. A p value ≤0.05 was considered significant. Analyses were performed with SPSS version 16.0 (IBM, Armonk, New York).
Results
A total of 30 patients with hypertensive crisis, consecutively enrolled from June 2008 to July 2009, were included in the study. Table 1 lists details of baseline demographic and clinical variables, and Table 2 lists vital signs, medications, and comprehensive echocardiographic measurements at baseline and follow-up. At the time of follow-up echocardiography, more patients were receiving angiotensin-converting enzyme inhibitors and β blockers, mean systolic and diastolic blood pressures were significantly lower, and baseline left atrial volume index was significantly decreased; in contrast, LVEF and LV fractional shortening at baseline and follow-up were similar. There were no significant differences in lateral and septal annular tissue Doppler myocardial velocities at baseline and follow-up; however, there was a significant decrease in lateral and septal E/e′ ratios.
| Variable | Value |
|---|---|
| Age (yrs) | 54 ± 13 |
| Body mass index (kg/m 2 ) | 33 ± 9.6 |
| Body surface area (m 2 ) | 2.0 ± 0.3 |
| Men | 19 (63%) |
| African American | 19 (63%) |
| Asian | 1 (3%) |
| European American | 2 (7%) |
| Hispanic/Latino | 8 (27%) |
| Hypertension | 30 (100%) |
| Diabetes mellitus | 16 (53%) |
| Dyslipidemia ∗ | 27 (90%) |
| Coronary artery disease † | 6 (20%) |
| Cardiomyopathy ‡ | 16 (53%) |
| Tobacco | 17 (57%) |
| Myocardial infarction | 6 (20%) |
| Congestive heart failure | 15 (50%) |
| Previous hypertensive crisis | 3 (10%) |
| Cerebrovascular accident | 6 (20%) |
| Chronic renal insufficiency | 12 (40%) |
| Dyspnea | 21 (70%) |
| Heart failure | 20 (67%) |
| Chest pain | 13 (43%) |
| Acute coronary syndromes | 2 (7%) |
| Altered mental status/encephalopathy | 4 (13%) |
| Cerebrovascular accident | 5 (17%) |
| Acute renal failure | 12 (40%) |
| Cocaine intoxication | 2 (7%) |
∗ Documented total cholesterol ≥240 mg/dl or low-density lipoprotein ≥160 mg/dl or currently taking lipid-lowering medication.
† Documented myocardial infarction, coronary artery bypass surgery, or percutaneous coronary intervention or diameter coronary stenosis ≥70% in ≥1 major epicardial coronary artery.
‡ Documented hypertensive heart disease (LV mass index >115 g/m 2 ) or a documented LVEF <50%.
| Variable | Baseline | Follow-Up | p Value |
|---|---|---|---|
| Systolic blood pressure (mm Hg) | 199 ± 12 | 143 ± 15 | <0.001 |
| Diastolic blood pressure (mm Hg) | 123 ± 12 | 77 ± 12 | <0.001 |
| Heart rate (beats/min) | 82 ± 14 | 76 ± 14 | 0.005 |
| Angiotensin-converting enzyme inhibitors | 13 (43%) | 24 (80%) | 0.004 |
| β blockers | 7 (23%) | 26 (87%) | <0.001 |
| Calcium channel blockers | 11 (37%) | 16 (53%) | 0.19 |
| Statins | 5 (17%) | 21 (70%) | <0.001 |
| Aspirin | 7 (23%) | 16 (53%) | 0.02 |
| Nitrates | 2 (7%) | 7 (23%) | 0.07 |
| Diuretics | 14 (47%) | 19 (63%) | 0.20 |
| Vasodilators | 6 (20%) | 7 (23%) | 0.70 |
| Angiotensin-converting enzyme inhibitors | 13 (43%) | 24 (80%) | 0.004 |
| Left atrial volume (ml) | 74 ± 30 | 64 ± 24 | 0.004 |
| Left atrial volume index (ml/m 2 ) | 37 ± 13 | 32 ± 11 | 0.005 |
| Right atrial volume (ml) | 51 ± 26 | 40 ± 20 | <0.001 |
| Right atrial volume index (ml/m 2 ) | 25 ± 12 | 20 ± 9 | <0.001 |
| LV end-diastolic dimension (cm) | 4.8 ± 0.8 | 4.7 ± 0.8 | 0.30 |
| LV end-systolic dimension (cm) | 3.6 ± 1.2 | 3.3 ± 1.0 | 0.09 |
| LV end-diastolic volume (ml) | 127 ± 56 | 125 ± 61 | 0.70 |
| LV end-diastolic volume index (ml/m 2 ) | 62 ± 22 | 61 ± 25 | 0.70 |
| LV end-systolic volume (ml) | 70 ± 47 | 70 ± 46 | 1.00 |
| LV end-systolic volume index (ml/m 2 ) | 34 ± 20 | 35 ± 21 | 0.90 |
| LV fractional shortening (%) | 28 ± 15 | 31 ± 14 | 0.20 |
| LVEF (%) | 48 ± 18 | 46 ± 18 | 0.50 |
| Mitral deceleration time (ms) | 175 ± 63 | 204 ± 70 | 0.04 |
| E velocity (m/s) | 0.9 ± 0.2 | 0.8 ± 0.2 | 0.40 |
| A velocity (m/s) | 0.7 ± 0.3 | 0.8 ± 0.3 | 0.10 |
| Mitral E/A ratio | 1.4 ± 0.7 | 1.0 ± 0.6 | 0.09 |
| Tissue Doppler lateral annular velocity (e′) (m/s) | 0.06 ± 0.03 | 0.07 ± 0.03 | 0.40 |
| Tissue Doppler septal annular velocity (e′) (m/s) | 0.05 ± 0.2 | 0.05 ± 0.2 | 0.30 |
| Mitral E/e′ lateral annular velocity ratio | 15 ± 9 | 12 ± 5 | 0.04 |
| Mitral E/e′ septal annular velocity ratio | 20 ± 7 | 15 ± 7 | 0.04 |
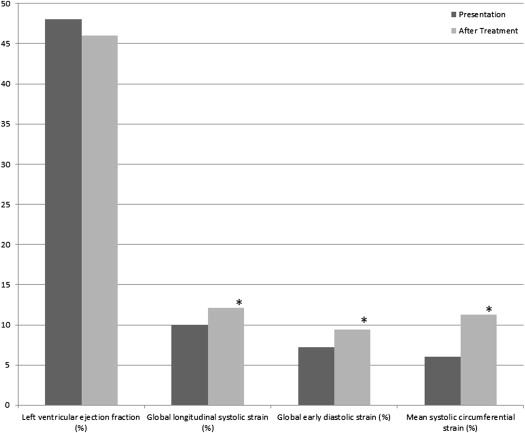
Table 3 lists systolic and diastolic speckle-tracking variables. In contrast to LVEF, global LV longitudinal systolic ε improved from baseline to follow-up. There was also significant improvement in mean global systolic SR and mean global circumferential systolic ε. Mean global early diastolic ε improved from baseline to follow-up, as did mean global early diastolic SR and early circumferential diastolic ε and SR. Ratios of mitral valve E-wave velocity to early diastolic longitudinal ε decreased from baseline to follow-up, as did the ratio of mitral E-wave velocity to early diastolic SR. Left ventricular ejection fraction and ε variables at baseline and follow-up are depicted in Figure 1 . Among continuous variables, significant univariate correlates of global LV longitudinal ε were LVEF (R = 0.70, p = 0.01), systolic blood pressure (R = 0.52, p = 0.02), left atrial volume index (R = 0.49, p = 0.03), E/A ratio (R = 0.47, p = 0.04), and heart rate (R = 0.41, p = 0.05). On multivariate analysis, the independent predictors of LV longitudinal ε at follow-up were LVEF (p <0.001), heart rate (p = 0.005), systolic blood pressure (p = 0.04), and left atrial volume index (p = 0.05). Because most patients in this study (20 of 30 [67%]) presented with clinical diagnoses of congestive heart failure, the study cohort was divided into patients with and without clinical congestive heart failure, with the results listed in Table 4 . The patients with clinical congestive heart failure at presentation were more likely to demonstrate improvement in systolic and diastolic speckle-tracking ε parameters after treatment compared with those without congestive heart failure.
| Variable | Baseline | Follow-Up | p Value |
|---|---|---|---|
| Mean global longitudinal systolic ε (%) | −10 ± 4 | −12 ± 4 | 0.01 |
| Mean global longitudinal systolic SR (s −1 ) | −1.0 ± 0.4 | −1.4 ± 0.6 | 0.01 |
| Mean global longitudinal early diastolic ε (%) | −7.2 ± 4.0 | −9.4 ± 2.9 | 0.004 |
| Mean global early diastolic SR (s −1 ) | 0.3 ± 0.2 | 0.5 ± 0.4 | 0.05 |
| Mitral E/early longitudinal diastolic ε ratio | −0.2 ± 0.1 | −0.09 ± 0.04 | <0.001 |
| Mitral E/early longitudinal diastolic SR ratio | 1.9 ± 1.4 | 1.4 ± 0.6 | 0.04 |
| Mean systolic circumferential ε (%) | −6.0 ± 3.2 | −11.3 ± 5.4 | 0.03 |
| Mean systolic circumferential SR (s −1 ) | −0.6 ± 0.3 | −0.7 ± 0.5 | 0.49 |
| Mean early diastolic circumferential ε (%) | −4.9 ± 2.7 | −9.4 ± 5.0 | 0.05 |
| Mean early diastolic circumferential SR (s −1 ) | 0.4 ± 0.2 | 0.7 ± 0.3 | 0.03 |
| Variable | Heart Failure (n = 20) | No Heart Failure (n = 10) | ||||
|---|---|---|---|---|---|---|
| Baseline | Follow-Up | p Value | Baseline | Follow-Up | p Value | |
| Systolic blood pressure (mm Hg) | 196 ± 18 | 146 ± 22 | <0.001 | 202 ± 23 | 137 ± 17 | <0.001 |
| Diastolic blood pressure (mm Hg) | 110 ± 20 | 80 ± 16 | <0.001 | 101 ± 19 | 67 ± 17 | <0.001 |
| Heart rate (beats/minute) | 80 ± 13 | 74 ± 12 | 0.01 | 83 ± 14 | 77 ± 17 | 0.07 |
| Left atrial volume index (ml/m 2 ) | 38 ± 13 | 33 ± 10 | 0.05 | 34 ± 14 | 29 ± 12 | 0.05 |
| Right atrial volume index (ml/m 2 ) | 27 ± 11 | 22 ± 9 | 0.001 | 21 ± 11 | 16 ± 7 | 0.03 |
| LV fractional shortening (%) | 23 ± 13 | 28 ± 14 | 0.08 | 38 ± 14 | 36 ± 13 | 0.60 |
| LVEF (%) | 43 ± 16 | 43 ± 16 | 0.90 | 59 ± 18 | 53 ± 20 | 0.30 |
| Mitral deceleration time (ms) | 178 ± 64 | 206 ± 68 | 0.20 | 170 ± 20 | 199 ± 76 | 0.14 |
| E velocity (m/s) | 0.9 ± 0.3 | 0.9 ± 0.2 | 0.90 | 0.7 ± 0.1 | 0.6 ± 0.2 | 0.02 |
| A velocity (m/s) | 0.7 ± 0.3 | 0.8 ± 0.3 | 0.10 | 0.7 ± 0.2 | 0.8 ± 0.2 | 0.80 |
| Mitral E/A ratio | 1.5 ± 0.8 | 1.3 ± 0.6 | 0.30 | 1.1 ± 0.5 | 0.9 ± 0.2 | 0.20 |
| Tissue Doppler lateral annular velocity (e′) (m/s) | 0.06 ± 0.03 | 0.07 ± 0.02 | 0.20 | 0.06 ± 0.03 | 0.05 ± 0.02 | 0.20 |
| Tissue Doppler septal annular velocity (e′) (m/s) | 0.05 ± 0.02 | 0.05 ± 0.02 | 0.20 | 0.05 ± 0.02 | 0.05 ± 0.02 | 0.90 |
| Mitral E/e′ lateral annular velocity ratio | 17 ± 5 | 13 ± 5 | 0.08 | 15 ± 10 | 12 ± 9 | 0.17 |
| Mitral E/e′ septal annular velocity ratio | 20 ± 6 | 15 ± 5 | 0.05 | 18 ± 9 | 14 ± 9 | 0.11 |
| Mean global longitudinal systolic ε (%) | −10 ± 4 | −12 ± 5 | 0.02 | −11 ± 5 | −12 ± 3 | 0.30 |
| Mean global longitudinal systolic SR (s −1 ) | −0.8 ± 0.2 | −1.1 ± 0.4 | 0.20 | −1.4 ± 0.4 | −2.0 ± 0.6 | 0.15 |
| Mean global longitudinal early diastolic ε (%) | −8.4 ± 3.7 | −9.2 ± 3.2 | 0.30 | −7.0 ± 4.4 | −10 ± 3.0 | 0.08 |
| Mean global early diastolic SR (s −1 ) | 0.6 ± 0.3 | 0.8 ± 0.4 | 0.10 | 0.5 ± 0.2 | 0.5 ± 0.1 | 0.50 |
| Mitral E/early longitudinal diastolic ε ratio | −0.2 ± 0.1 | −0.1 ± 0.04 | 0.01 | −0.2 ± 0.1 | −0.07 ± 0.02 | 0.02 |
| Mitral E/early longitudinal diastolic SR | 1.7 ± 0.8 | 1.3 ± 0.5 | 0.03 | 2.2 ± 0.8 | 1.6 ± 0.8 | 0.50 |
| Mean systolic circumferential ε (%) | −5.2 ± 3.0 | −11.4 ± 6.2 | 0.04 | −16 ± 6.9 | −16 ± 7.3 | 0.90 |
| Mean systolic circumferential SR (s −1 ) | −0.5 ± 0.3 | −0.6 ± 0.6 | 0.50 | −1.0 ± 0.2 | −1.1 ± 0.5 | 0.30 |
| Mean early diastolic circumferential ε (%) | −4.5 ± 2.9 | −9.9 ± 5.6 | 0.01 | −9.2 ± 5.1 | −10.7 ± 5.7 | 0.50 |
| Mean early diastolic circumferential SR (s −1 ) | 0.3 ± 0.2 | 0.7 ± 0.3 | 0.01 | 1.0 ± 0.5 | 0.8 ± 0.3 | 0.40 |
| Mean global longitudinal systolic ε (%) | −10 ± 4 | −12 ± 4 | 0.02 | −11 ± 5 | −12 ± 3 | 0.30 |
| Mean global longitudinal systolic SR (s −1 ) | −0.8 ± 0.2 | −1.1 ± 0.4 | 0.20 | −1.4 ± 0.4 | −2.0 ± 0.6 | 0.15 |
| Mean global longitudinal early diastolic ε (%) | −8.3 ± 3.6 | −9.2 ± 3.2 | 0.30 | −7.0 ± 4.5 | −10 ± 3.0 | 0.08 |
Stay updated, free articles. Join our Telegram channel

Full access? Get Clinical Tree


