Left ventricular (LV) infarct size affects prognosis after acute myocardial infarction (AMI). Delayed enhancement cardiac magnetic resonance (DE-CMR) provides accurate infarct quantification but is unavailable or contraindicated in many patients. This study tested whether simple electrocardiography (ECG) parameters can stratify LV infarct size. One hundred fifty-two patients with AMI underwent DE-CMR and serial 12-lead ECG. Electrocardiograms were quantitatively analyzed for multiple aspects of Q-wave morphology, including duration, amplitude, and geometric area (QWAr) summed across all leads except aVR. Patients with pathologic Q waves had larger infarcts measured by DE-CMR or enzymes (both p <0.001), even after controlling for infarct distribution by CMR or x-ray angiography. Comparison between early (4 ± 0.4 days after AMI) and follow-up (29 ± 6 days) ECG demonstrated temporal reductions in Q-wave amplitude (1.8 ± 1.4 vs 1.6 ± 1.6 mV; p = 0.03) but not QWAr (41 ± 38 vs 39 ± 43 mV•ms; p = 0.29). At both times, QWAr augmented stepwise with DE-CMR quantified infarct size (p <0.001). QWAr increased markedly at 10% LV infarct threshold, with differences more than threefold on early ECG (59 ± 39 vs 18 ± 20 mV•ms; p <0.001) and nearly fivefold (59 ± 46 vs 13 ± 16 mV•ms; p <0.001) on follow-up. Diagnostic performance compared with a 10% infarction cutoff was good on early (area under the curve = 0.84) and follow-up (area under the curve = 0.87) ECG. Optimization of sensitivity (95% to 98%) enabled QWAr to exclude affected patients with 90% to 94% negative predictive value at each time point. In conclusion, LV infarct size is accompanied by stepwise increments in Q-wave morphology, with QWAr increased three- to fivefold at a threshold of 10% LV infarction. Stratification based on QWAr provides excellent negative predictive value for exclusion of large (≥10%) LV infarct burden.
Left ventricular (LV) infarct size is an established determinant of adverse clinical outcomes after acute myocardial infarction (AMI). Myocyte necrosis provides a proarrhythmic substrate and has been shown to predict risk for ventricular tachyarrhythmias independent of contractile dysfunction. Accordingly, stratification of LV infarct size is of prognostic importance for post-AMI patients. Delayed enhancement cardiac magnetic resonance (DE-CMR) is well validated as a noninvasive reference standard for LV infarct quantification. DE-CMR has been used clinically to measure infarct size and transmurality. However, population-based use of DE-CMR as a primary means of stratifying infarct burden would entail substantial costs and be infeasible in many patients. Electrocardiography (ECG), a routine component of post-AMI care, is inexpensive and readily obtainable in nearly all patients. Although it is known that small infarcts can occur without pathologic Q waves on electrocardiogram, it is possible that a size threshold exists above which Q-wave morphology can be used to stratify infarct burden. ECG might therefore be useful as a primary screening test to exclude infarcts below a given threshold, with more sophisticated testing reserved to quantify infarct size in patients with specific Q-wave abnormalities in the QRS complex. To date, studies comparing DE-CMR with ECG-based infarct quantification have used scoring systems that encompass several aspects of the QRS waveform, without addressing whether Q-wave morphology alone can serve as a marker of global infarct burden. The aims of this study were twofold: (1) to evaluate whether Q-wave morphology, as assessed on early and follow-up post-AMI ECG, parallels global infarct size on DE-CMR, and (2) to determine whether a quantitative cutoff exists whereby Q-wave indexes can be used to stratify patients above and below a given threshold for global LV infarct size.
Methods
The population comprised patients with first ST elevation AMI enrolled in a prospective registry of post-AMI remodeling ( ClincalTrials.gov no. NCT00539045 ) from September 2006 to October 2012. In accordance with established criteria, AMI was defined by chest pain with ST segment elevation in ≥2 contiguous ECG leads and elevated cardiac enzymes (more than ninety-ninth percentile). Patients were excluded for previous AMI or contraindication to CMR. Comprehensive clinical data were collected, including cardiac risk factors, coronary artery disease history, and treatment regimen. Coronary angiograms were reviewed for infarct related artery and lesion-based (Alberta Provincial Project for Outcome Assessment in Coronary Heart Disease [APPROACH]) myocardial jeopardy score. Electrocardiograms were acquired at 2 time points (1) <1 week (target 3 to 5 days) after AMI, and (2) 2 to 6 weeks after AMI. In all patients, CMR was performed on the same day as follow-up (2- to 6-week) ECG. The study was conducted in accordance with the Weill Cornell Institutional Review Board.
Electrocardiograms were acquired using a standard 12-lead surface electrode recording system (MAC 5000/550, General Electric, Waukesha, Wisconsin). Recordings were performed at a sampling rate of 500 Hz. Data were stored digitally using a dedicated (GE Muse, General Electric) archival system. Electrocardiograms were quantitatively analyzed using a dedicated processing software (Magellan, GE Healthcare, Wauwatosa, Wisconsin). A band-pass filter of 0.05 to 150 Hz was applied before measurement, consistent with American Heart Association/American College of Cardiology recommendations. Multiple aspects of Q-wave morphology were measured in each surface lead, including duration, maximal amplitude, and geometric area subtended within each respective Q wave. Q waves were defined as the first negative deflection of the QRS complex. If a QS complex pattern was seen, the entire QS wave was defined as a Q wave. To minimize the impact of ECG noise artifact, Q-wave area (QWAr) was only recorded when ≥160 μV•ms. Respective Q-wave parameters (amplitude, duration, and area) were similarly measured for all other QRS waveform deflections as recorded within all ECG leads.
Each Q-wave parameter was summed across individual surface leads to calculate total amplitude, duration, and area, which were calculated as unadjusted parameters and with adjustment for absolute QRS data (i.e., total QWAr/total QRS area). Q waves as recorded in lead aVR were excluded from all analyses. Established consensus criteria were used to define binary presence or absence of pathologic Q waves (V 2 to V 3 : duration ≥0.02 second | I, II, aVL, aVF, V 4 to V 6 : duration ≥0.03 second, amplitude ≥0.1 mV).
CMR was performed using 1.5-Tesla scanners (General Electric, Waukesha, Wisconsin). Exams consisted of 2 components: (1) cine-CMR for function or morphology, and (2) DE-CMR for infarct quantification. Cine-CMR was performed using a steady-state free precession sequence (typical parameters: repetition time 3.5 milliseconds, echo time 1.6 milliseconds, flip angle 60°, inplane spatial resolution 1.9 × 1.4 mm). After cine-CMR, gadolinium was intravenously administered (0.2 mmol/kg) and DE-CMR performed 10 to 30 minutes thereafter using a segmented inversion recovery sequence. Cine-CMR and DE-CMR images were obtained in matching short- and long-axis planes. Short-axis images were acquired throughout the LV (6-mm slice thickness, 4-mm gap) from the level of the mitral valve annulus through the apex. Long-axis images were acquired in standard 2-, 3-, and 4-chamber orientations.
Global LV infarct size (%LV myocardium) was quantified on DE-CMR using the full width at half maximum method, for which high reproducibility has been reported. Regional infarct location and transmurality was scored using an established 17-segment model or 5-point-per-segment scoring system (0 = no hyperenhancement; 1 = 1% to 25%; 2 = 26% to 50%; 3 = 51% to 75%; 4 = 76% to 100%). LV structure and function were quantified using cine-CMR. LV mass was quantified at end-diastole, with inclusion of papillary muscles and trabeculae within myocardial contours. LV ejection fraction and cavity volumes were based on end-diastolic and end-systolic endocardial contours of contiguous short-axis images. Regional LV wall motion was scored using a 17-segment model. Segmental function was graded as 0 = normal contraction, 1 = mild hypokinesia, 2 = moderate hypokinesia, 3 = severe hypokinesia, 4 = akinesia, and 5 = dyskinesia.
Comparisons of continuous variables were made using Student’s t test (expressed as mean ± standard deviation) for 2 group comparisons and analysis of variance for multiple group comparisons. Categorical variables were compared using chi-square or Fisher’s exact tests when <5 outcomes were expected per cell; paired categorical variables were compared using McNemar’s test. Linear regression was used to evaluate multivariable associations between Q-wave parameters and DE-CMR. Receiver operating characteristic analysis was used to evaluate diagnostic performance of Q-wave parameters for detection of DE-CMR quantified global LV infarct size. Area under the curve (AUC) comparisons were performed based on z-transformation in accordance with established methods. Two-sided p <0.05 was considered indicative of statistical significance. Calculations were performed using SPSS 14.0 (SPSS, Chicago, Illinois).
Results
The population comprised 152 patients who had both early (4 ± 0.4 days) and follow-up (29 ± 6 days post-AMI) ECG performed after AMI. In all patients, follow-up ECG was performed on the same day as CMR.
Table 1 details baseline characteristics of the study population, with stratification based on presence or absence of follow-up ECG-evidenced pathologic Q waves (defined based on established criteria). As expected, affected patients had larger global infarct burden, whether measured by cardiac enzymes or DE-CMR evidenced hyperenhancement (both p <0.001). Consistent with this, pathologic Q waves were associated with hemodynamic instability as assessed based on need for pharmacologic and/or mechanical support (p = 0.04).
| Parameter | Overall (n = 152) | Q-Wave + (n = 104) | Q-Wave − (n = 48) | p Value |
|---|---|---|---|---|
| Age (yr) | 56 ± 12 | 55 ± 12 | 58 ± 13 | 0.24 |
| Men | 126 (83%) | 91 (88%) | 35 (73%) | 0.03 |
| Hypertension | 59 (39%) | 38 (37%) | 21 (44%) | 0.40 |
| Diabetes mellitus | 34 (22%) | 23 (22%) | 11 (23%) | 0.91 |
| Hypercholesterolemia | 72 (47%) | 45 (43%) | 27 (56%) | 0.14 |
| Tobacco use | 46 (30%) | 25 (24%) | 21 (44%) | 0.01 |
| Family history of coronary disease | 39 (26%) | 28 (27%) | 11 (23%) | 0.60 |
| Previous coronary revascularization | 8 (5%) | 4 (4%) | 4 (8%) | 0.26 |
| Revascularization strategy | ||||
| 1° PCI | 115 (76%) | 78 (75%) | 37 (77%) | 0.78 |
| Primary thrombolysis | 37 (24%) | 26 (25%) | 11 (23%) | 0.78 |
| Thrombolysis with emergent PCI | 22 (15%) | 17 (16%) | 5 (10%) | 0.33 |
| Pharmacologic/mechanical support | 31 (20%) | 26 (25%) | 5 (10%) | 0.04 |
| Cardiovascular medications | ||||
| β blocker | 144 (95%) | 101 (97%) | 43 (90%) | 0.05 |
| ACE inhibitor/angiotensin receptor blocker | 91 (60%) | 66 (64%) | 25 (52%) | 0.18 |
| HMG-CoA reductase inhibitor | 146 (96%) | 99 (95%) | 47 (98%) | 0.67 |
| Thienopyridine | 147 (97%) | 101 (97%) | 46 (96%) | 0.65 |
| Aspirin | 152 (100%) | 104 (100%) | 48 (100%) | – |
| IIb/IIIa antagonists | 122 (82%) | 89 (86%) | 33 (72%) | 0.03 |
| Infarct size and distribution | ||||
| DE-CMR | ||||
| LV hyperenhancement (g) | 15 ± 12 | 19 ± 12 | 6 ± 6 | <0.001 |
| Hyperenhancement (% myocardium) | 12 ± 9 | 16 ± 8 | 5 ± 4 | <0.001 |
| Anterior wall involvement | 80 (53%) | 67 (64%) | 13 (27%) | <0.001 |
| Lateral wall involvement | 51 (34%) | 34 (33%) | 17 (35%) | 0.74 |
| Inferior wall involvement | 86 (57%) | 56 (54%) | 30 (63%) | 0.32 |
| Angiography | ||||
| Jeopardy score | 26 ± 11 | 29 ± 10 | 21 ± 11 | <0.001 |
| Infarct-related artery | ||||
| Left anterior descending | 84 (55%) | 67 (64%) | 17 (35%) | 0.001 |
| Left circumflex | 14 (9%) | 4 (4%) | 10 (21%) | 0.002 |
| Right coronary | 54 (36%) | 33 (32%) | 21 (44%) | 0.15 |
| Cardiovascular enzymes | ||||
| Creatine phosphokinase † | 2,284 ± 1,964 | 2,906 ± 2,043 | 968 ± 811 | <0.001 |
| LV function/geometry | ||||
| Ejection fraction (%) | 54 ± 11 | 51 ± 10 | 62 ± 8 | <0.001 |
| Wall motion score | 0.7 ± 0.5 | 0.9 ± 0.5 | 0.3 ± 0.3 | <0.001 |
| End-diastolic volume (ml/m 2 ) | 76 ± 16 | 78 ± 16 | 69 ± 13 | 0.001 |
| End-systolic volume (ml/m 2 ) | 36 ± 15 | 40 ± 15 | 27 ± 10 | <0.001 |
| Myocardial mass (g/m 2 ) | 65 ± 13 | 67 ± 13 | 61 ± 11 | 0.003 |
∗ Stratified based on consensus criteria for pathological QWDur (≥20 ms V2 to V3, ≥30 ms I, II, aVL, aVF, V4 to V6) and QWAmp (≥0.1 mV I, II, aVL, aVF, V4 to V6).
Regarding infarct distribution, pathologic Q waves were more common with anterior wall infarction, whether assessed directly by DE-CMR or angiographically based on left anterior descending culprit vessel involvement (both p ≤0.001). In multivariate analysis, pathologic Q waves were independently associated with DE-CMR quantified global infarct size (odds ratio [OR] = 1.3 per %LV myocardium, 95% confidence interval [CI] = 1.2 to 1.4; p <0.001) after controlling for anterior wall involvement (OR = 1.5, 95% CI = 0.6 to 4.0; p = 0.38) (model chi-square = 65.6; p <0.001). Conventional assessment of infarct size and distribution demonstrated a similar relation, as evidenced by an independent association between Q waves and peak serum creatinine phosphokinase (OR = 1.1 per 100 u/L, 95% CI = 1.1 to 1.2; p <0.001) after controlling for left anterior descending infarction on angiography (OR = 1.7, 95% CI = 0.7 to 4.3; p = 0.23; model chi-square = 52.4; p <0.001).
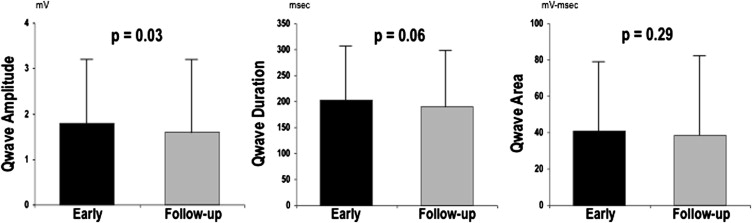
Prevalence of pathologic Q waves, as scored based on presence or absence in any ECG lead, was similar between time points (72% vs 68%, p = 0.36). However, aggregate number of Q waves was slightly higher on early post-AMI ECG (1.4 ± 1.4) compared with follow-up (1.2 ± 1.2; p <0.01). Figure 1 compares Q-wave morphology between early and follow-up ECG. Consistent with decrements in absolute number of pathologic Q waves, total Q-wave amplitude (QWAmp; summed across ECG leads) was lower at follow-up (1.6 ± 1.6 vs 1.8 ± 1.4 mV; p = 0.03). However, there was only a trend toward lower total Q-wave duration (QWDur; 190 ± 109 vs 202 ± 105; p = 0.06), and total QWAr was similar between time points (39 ± 43 vs 41 ± 38 mV•ms; p = 0.29).
As shown in Table 2 , QWAr, an aggregate parameter accounting for both duration and amplitude, correlated with global infarct size on early and follow-up ECG. Similarly, global LV infarct size correlated with increases in both total QWAmp and QWDur. However, multivariate analysis demonstrated differences between time points: Early post-AMI, total QWAmp independently correlated with infarct size, whereas total QWDur did not. Conversely, QWDur on follow-up ECG independently correlated with infarct size, with nonsignificance for QWAmp.
| Early After AMI | |||||
|---|---|---|---|---|---|
| Q-wave Indices | Correlation (r) | p Value | Multivariate | ||
| QWAr | 0.49 | <0.001 | |||
| Adjusted QWAr | 0.52 | <0.001 | |||
| Model r = 0.52 | |||||
| Partial r | β | p | |||
| QWDur | 0.46 | <0.001 | 0.11 | 0.15 | 0.17 |
| QWAmp | 0.51 | <0.001 | 0.28 | 0.39 | 0.001 |
| Model r = 0.56 | |||||
| Partial r | β | p | |||
| Adjusted QWDur (Qw-dur/QRS-dur) | 0.43 | <0.001 | −0.07 | −0.10 | 0.42 |
| Adjusted QWAmp (Qw-amp/QRS-amp) | 0.55 | <0.001 | 0.39 | 0.64 | <0.001 |
Stay updated, free articles. Join our Telegram channel

Full access? Get Clinical Tree


