It was previously reported that event-free survival rates of symptomatic patients with coronary artery disease (CAD) diagnosed by computed tomographic angiography decreased incrementally from normal coronary arteries to obstructive CAD. The aim of this study was to investigate the clinical outcomes of symptomatic patients with nonobstructive CAD with luminal stenoses of 1% to 49% on the basis of coronary plaque morphology in an outpatient setting. Among 3,499 consecutive symptomatic subjects who underwent computed tomographic angiography, 1,102 subjects with nonobstructive CAD (mean age 59 ± 14 years, 69.9% men) were prospectively followed for a mean of 78 ± 12 months. Coronary plaques were defined as noncalcified, mixed, and calcified per patient. Multivariate Cox proportional-hazards models were developed to predict all-cause mortality. The death rate of patients with nonobstructive CAD was 3.1% (34 deaths). The death rate increased incrementally from calcified plaque (1.4%) to mixed plaque (3.3%) to noncalcified plaque (9.6%), as well as from single- to triple-vessel disease (p <0.001). In subjects with mixed or calcified plaques, the death rate increased with the severity of coronary artery calcium from 1 to 9 to ≥400. The risk-adjusted hazard ratios of all-cause mortality in patients with nonobstructive CAD were 3.2 (95% confidence interval 1.3 to 8.0, p = 0.001) for mixed plaques and 7.4 (95% confidence interval 2.7 to 20.1, p = 0.0001) for noncalcified plaques compared with calcified plaques. The areas under the receiver-operating characteristic curve to predict all-cause mortality were 0.75 for mixed and 0.86 for noncalcified coronary lesions. In conclusion, this study demonstrates that the presence of noncalcified and mixed coronary plaques provided incremental value in predicting all-cause mortality in symptomatic subjects with nonobstructive CAD independent of age, gender, and conventional risk factors.
Cardiovascular computed tomographic angiography (CTA) is an emerging noninvasive technology able to identify and prognosticate coronary artery disease (CAD) and its outcome. With its excellent negative predictive value and incremental value in predicting cardiovascular events, CTA is an invaluable tool in assessing symptomatic patients with an intermediate likelihood of CAD. CTA’s ability to visualize the characteristics and morphology of coronary plaques is promising. Recent studies have shown that CTA can accurately evaluate the burden of atherosclerosis and plaque morphology, with results comparable to those of intravascular ultrasound (IVUS). The purpose of this study was to investigate the long-term outcomes of patients with nonobstructive CAD on the basis of coronary plaques.
Methods
Among 3,499 consecutive symptomatic subjects with suspected CAD who underwent CTA, 1,102 with nonobstructive CAD (luminal stenoses of 1% to 49%) were prospectively followed for a mean of 78 ± 12 months. Subjects with irregular heart rates, allergies to contrast media, previous known CAD, liver disease, or impaired renal function were excluded. After receiving a full explanation about the procedure, all eligible patients provided signed written informed consent before they underwent CTA. Subjects were given a risk-factor questionnaire to assess ethnicity and cardiovascular risk factors. The presence and number of risk factors were calculated on the basis of the National Cholesterol Education Program guidelines. Risk factors included age (men aged ≥45 years, women aged ≥55 years), current cigarette smoking, diabetes mellitus, history of premature coronary disease in a first-degree relative (men aged ≥55 years, women aged ≥65 years), hypertension, and hypercholesterolemia. In addition, body mass index data were collected.
CTA was performed using a C300 electron-beam tomographic scanner (GE-Imatron, South San Francisco, California). A noncontrast scan acquiring 15 slices was initially performed craniocaudally (3-mm section thickness without gap) to obtain coronary artery calcium (CAC). After this, a flow study was performed (8-mm section thickness with 4-mm intersection gap) to obtain the circulation time (the time from contrast injection in the vein to the peak visualization of the ascending aorta). The circulation time (averaging 19 seconds in this study) was determined by a time-density curve at the aortic root, using 15 to 20 ml nonionic contrast injection (iopamidol 370; Bracco Diagnostics, Plainsboro, New Jersey). To facilitate adequate breath hold, the patients were connected to an oxygen mask and asked to hyperventilate before breath hold during scanning. Atropine was used to increase heart rates when heart rates were ≤40 beats/min, and nitroglycerin (0.4 mg sublingual) was used in all studies unless contraindicated. All computed tomographic angiographic images used a 100-ms acquisition per image and were reconstructed with a 512 × 512 matrix and a 15-cm field of view, yielding a voxel size of 0.34 × 0.34 × 3.0 mm 3 . Nonionic contrast was administered through an antecubital vein with an injection rate of 4 ml/s and total volume of 120 to 160 ml. Image acquisitions was triggered to the patient’s electrocardiogram. Electrocardiographic triggering corresponding to a fixed point after the R wave (rate-adjusted trigger) to approximate end-systole was done. The delay time after the R wave was varied on the basis of the heart rate at rest just before the scan, previously demonstrated to improve calcium reproducibility and the diagnostic accuracy of CTA. The trigger delays were 350 ms for heart rates ≤60 beats/min, 320 ms for 61 to 70 beats/min, 300 ms for 71 to 80 beats/min, 280 ms for 81 to 90 beats/min, 260 ms for 91 to 100 beats/min, and 246 ms for ≥100 beats/min. The data obtained by the scanner for the analysis were transferred and processed at a dedicated, commercially available image workstation (Insight, Neo Imagery Technology, Industry, California).
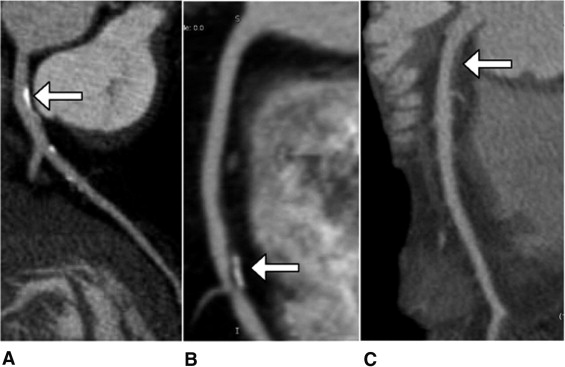
All studies were analyzed by an experienced reader, blinded to all clinical variables, history, and patient demographics. Axial images ( Figure 1 ), as well as maximum-intensity and volume-rendered images, were used for analysis. On the basis of plaque morphology assessed in the entire coronary tree by CTA, the patients with nonobstructive CAD were assigned to 1 of the following groups: noncalcified (CAC = 0), mixed, and calcified coronary lesion. Patients with multiple complex coronary plaque morphology were excluded. Patients were further subdivided with respect to the number of vessels diseased: 1-, 2-, or 3-vessel disease. Three-vessel disease was defined as either nonobstructive CAD in all 3 of the major epicardial vessels (right, left anterior descending, and left circumflex coronary arteries) or right coronary artery and left main artery disease.
CAC was defined as a plaque of ≥3 contiguous pixels (area 1.03 mm 2 ) with attenuation of ≥130 Hounsfield units. Quantitative CAC was calculated according to the Agatston method. Total CAC was calculated from the sum of each of the 4 major epicardial vessels (left main, left anterior descending, circumflex, and right coronary arteries).
Epidemiologic methods for follow-up included the ascertainment of events blinded to the results of CTA. The primary end point was the occurrence of all-cause mortality, which was verified by querying the Social Security Death Index. Death status was ascertained in all patients (i.e., 100% follow-up). Patients who underwent cardiovascular scanning were followed up for a mean of 78 ± 12 months.
Analyses were performed with SPSS version 18 (SPSS, Inc., Chicago, Illinois). All continuous data are presented as mean ± SD, and all categorical data are reported as percentages or absolute numbers. Chi-square analysis was used to assess differences between groups. Kruskal-Wallis tests and analysis-of-variance tests were used to assess differences between groups. Kaplan-Meier survival curves were constructed for coronary plaque morphology in nonobstructive CAD assessed by CTA and compared using the log-rank test.
The effect of the plaque morphology in nonobstructive CAD assessed by cardiac CTA on all-cause mortality was determined using Cox regression analysis. After adjustment for age, gender, smoking status, diabetes mellitus, hypertension, hypercholesterolemia, and family history of premature CAD, the forward stepwise model was used to determine independent predictors for all-cause mortality. Hazard ratios (HR) and confidence intervals (CIs) were calculated.
Time-dependent receiver-operating characteristic curves were constructed for 2 models: model 1, mixed versus calcified plaque, and model 2, noncalcified versus calcified plaque. The area under the curve (AUC) was calculated to predict the ability of each model to detect all-cause mortality, with an AUC of 0.50 indicating no accuracy and a value of 1.00 indicating maximal accuracy.
The effect of the severity of CAC in patients with nonobstructive CAD with calcified or mixed plaques on all-cause mortality was determined using Cox regression analysis. The study protocol and consent form were approved by the Institutional Review Board Committee, Board of Los Angeles Biomedical Research Institute at Harbor UCLA Medical Center, Torrance, California.
Results
The study population consisted of 1,102 subjects; 69% were men, and the mean age was 59 ± 14 years (range 36 to 82). Most of the patients were Caucasian (n = 654 [59.3%]); 6.4% (n = 54) were African American, 10.7% (n = 90) Hispanic, 2.5% (n = 21) Asian, and 3.0% (n = 25) of other races or ethnicities. Of the studied subjects with nonobstructive CAD, 501 (45.5%) had calcified, 486 (44.1%) had mixed, and 115 (10.4%) had noncalcified coronary plaques. There were no significant differences among subjects in terms of incidence of diabetes mellitus, hypertension, and family history of premature CAD. Patients with calcified coronary lesion tended to be older and male and to have hypercholesterolemia. The mean CAC increased from 0 in patients with noncalcified to 118 in patients with mixed and 310 in patients with calcified coronary lesions ( Table 1 ).
| Variable | Calcified | Mixed | Noncalcified | p Value |
|---|---|---|---|---|
| (n = 501) | (n = 486) | (n = 115) | ||
| Age (years) | 64 ± 9 | 60 ± 10 | 56 ± 10 | 0.001 |
| Men | 83% (416) | 70% (341) | 67% (77) | 0.001 |
| Current smokers | 7% (35) | 8% (39) | 4% (5) | 0.3 |
| Hypertension ⁎ | 48% (240) | 43% (209) | 43% (50) | 0.3 |
| Hypercholesterolemia † | 63% (316) | 54% (262) | 46% (53) | 0.01 |
| Diabetes mellitus ‡ | 12% (60) | 14% (68) | 11% (13) | 0.5 |
| Body mass index (kg/m 2 ) | 27.5 ± 4.6 | 28.1 ± 5.2 | 28.7 ± 6.6 | 0.03 |
| CAC score | 310 ± 68 | 118 ± 39 | 0 | 0.0001 |
| Diseased coronary arteries | 0.6 | |||
| 1 | 60.3% (302) | 53.9% (262) | 48.7% (56) | |
| 2 | 30.7% (154) | 35.8% (174) | 39.1% (45) | |
| 3 | 9% (45) | 10.3% (50) | 12.2% (14) | |
| Death | 1.4% (7) | 3.3% (16) | 9.6% (11) | 0.0001 |
⁎ Self-reported diagnosis of hypertension, prescribed medication for hypertension, or current blood pressure >140 mm Hg systolic or >90 mm Hg diastolic (>130/80 mm Hg if diabetic).
† Self-reported diagnosis of high cholesterol, prescribed medication for high cholesterol, or current total cholesterol >200 mg/dl.
‡ Self-reported diagnosis of diabetes (type 1 or 2) or prescribed medication for diabetes.
Noncalcified followed by mixed coronary plaques were more prevalent in patients of both genders aged <55 years and similarly in women aged >55 years. In men aged >55 years, calcified plaques followed by mixed plaques were more prevalent ( Figure 2 ).
In the 10-year follow-up period, 34 deaths were observed in subjects with nonobstructive CAD, with an event rate of 3.1% (34 of 1,102). Survival rates were 97.6%, 96.6%, and 92.4% for subjects with 1-, 2-, and 3-vessel nonobstructive CAD, respectively. HRs of mortality are shown in Table 2 . The risk-adjusted HRs of mortality were 1.46 for 2-vessel and 2.85 for 3-vessel nonobstructive CAD compared with 1-vessel disease, demonstrating the additional prognostic value of the severity of CAD (p <0.05). The survival rates were 98.6%, 96.7%, and 90.4% for patients with calcified, mixed, and noncalcified coronary plaques, respectively (p <0.0001; Figure 3 ). The unadjusted and adjusted HRs of death in subjects with nonobstructive CAD are shown in Table 3 . After adjustment for conventional risk factors and the number of diseased coronary arteries, the stepwise multivariate survival analysis revealed that the presence of noncalcified and mixed coronary plaques were independent predictors of mortality and had significant incremental value over clinical risk factors (HR 7.44%, 95% CI 2.76 to 20.08, p = 0.0001, and HR 3.24%, 95% CI 1.32 to 8.01, p = 0.001, respectively). This remained significant after adjustment for risk factors in both genders ( Table 3 ).
| Model (by Number of Narrowed Coronary Arteries) | Unadjusted Model | Adjusted Model | ||
|---|---|---|---|---|
| HR (95% CI) | p Value | HR (95% CI) | p Value | |
| 1-vessel disease | 1 (reference) | 1 (reference) | ||
| 2-vessel disease | 1.96 (1.06–4.86) | 0.01 | 1.46 (1.02–2.89) | 0.03 |
| 3-vessel disease | 3.27 (1.16–9.25) | 0.002 | 2.85 (1.07–7.96) | 0.01 |
| Model (by Type of Plaque) | Unadjusted Model | Adjusted Model | ||
|---|---|---|---|---|
| HR (95% CI) | p Value | HR (95% CI) | p Value | |
| Overall | ||||
| Calcified | 1.0 (reference) | 1.0 (reference) | ||
| Mixed | 3.35 (1.39–8.87) | 0.001 | 3.24 (1.32–8.01) | 0.001 |
| Noncalcified | 7.84 (3.03–20.27) | 0.0001 | 7.44 (2.76–20.08) | 0.0001 |
| Male | ||||
| Calcified | 1.0 (reference) | 1.0 (reference) | ||
| Mixed | 3.35 (1.39–8.87) | 0.001 | 4.34 (1.77–10.70) | 0.0001 |
| Noncalcified | 7.84 (3.03–20.27) | 0.0001 | 9.54 (3.56–25.92) | 0.0001 |
| Female | ||||
| Calcified | 1.0 (reference) | 1.0 (reference) | ||
| Mixed | 2.92 (1.16–7.34) | 0.001 | 2.92 (1.16–7.34) | 0.007 |
| Noncalcified | 7.84 (3.03–20.27) | 0.0001 | 6.92 (2.52–18.84) | 0.0001 |
Stay updated, free articles. Join our Telegram channel

Full access? Get Clinical Tree


