Cardiogenic shock (CS) continues to be the most important factor affecting the mortality rate of patients with acute myocardial infarctions (AMIs). However, controversy regarding the optimal treatment of older patients with AMIs complicated by CS still exists. The aim of this study was to compare the results of invasive (coronary angiography during index hospitalization) and noninvasive treatment strategies in patients aged ≥75 years with AMIs complicated by CS, defined as systolic blood pressure <90 mm Hg or need for hemodynamic support and end-organ hypoperfusion. A multicenter Polish registry that included data on patients with acute coronary syndromes was examined to identify patients with AMIs treated from October 2003 to May 2007. A total of 97,531 patients with AMIs were hospitalized, and 5.5% of those patients (n = 5,390) had CS on admission, including 1,976 patients aged ≥75 years (509 treated invasively and 1,467 treated noninvasively). In-hospital mortality was 55.4% in patients treated invasively and 69.9% in patients treated noninvasively (p <0.0001). After 6 months, the mortality rate was 65.8% in the invasive group and 80.5% in the noninvasive group (p <0.0001). Propensity score analysis, in which 499 patients of each group were analyzed after being matched for demographic and clinical data, confirmed the early and long-term benefits of the invasive strategy. In conclusion, applying the invasive strategy to patients with AMIs complicated by CS reduced in-hospital and 6-month mortality in patients aged ≥75 years.
Because of controversies concerning the optimal treatment of elderly patients with acute myocardial infarctions (AMIs) complicated by cardiogenic shock (CS), we undertook a detailed analysis focused on this problem on the basis of a large prospective observational database from the Polish Registry of Acute Coronary Syndromes (PL-ACS).
Methods
The PL-ACS registry design has been previously reported. In brief, the PL-ACS registry is a nationwide, multicenter, prospective, observational study of consecutively hospitalized patients with acute coronary syndromes (ACS). This registry was a joint initiative of the Silesian Center for Heart Diseases in Zabrze and the Polish Ministry of Health. Logistic support was granted from the National Health Fund, a nationwide, public health insurance institution, from which insurance policies are required for all Polish citizens. The pilot phase of the registry commenced in October 2003. From June 2005, all Polish regions collected data for the registry. This analysis includes patients enrolled from October 2003 to May 2007. Overall, 417 centers participated in the registry, including 59 centers (14%) with on-site catheterization facilities.
A detailed protocol was prepared before the registry was started, with inclusion and exclusion criteria, methods and logistics, and definitions of all fields in the data set. In May 2004, the definitions were adapted to be compatible with the Cardiology Audit and Registration Data Standards. According to the protocol, all admitted patients with suspected ACS were screened to be eligible to enter the registry, but patients were not enrolled until ACS were confirmed. The initial diagnosis was made by the attending physician on the basis of clinical presentation, initial electrocardiographic pattern, and markers of myocardial necrosis acquired ≥6 hours after symptom onset. The patients were then classified as having unstable angina, non–ST-segment elevation myocardial infarction (MI), or ST-segment elevation MI (see the following definitions). If patients were hospitalized during the same ACS events in >1 hospital (transferred patients), all hospitals were required to complete the case report form. These hospitalizations were linked together during data management and were analyzed as 1 case of ACS. Data were collected by attending physicians and entered directly into electronic case report form, or a printed case report form was used temporarily before converting data into their electronic version. Internal data checks were implemented by the software.
All-cause mortality data, including exact dates of death, were obtained from the National Health Fund and analyzed at the Silesian Center for Heart Diseases – data management and analysis center.
The definitions of the initial diagnoses were as follows: ST-segment elevation MI was defined as (1) the presence of ST-segment elevation consistent with MI ≥2 mm in adjacent chest leads and/or ST-segment elevation ≥1 mm in ≥2 standard leads or new left bundle branch block and (2) positive cardiac necrosis markers. Non–ST-segment elevation MI was defined as (1) the absence of ST-segment elevation consistent with MI ≥2 mm in adjacent chest leads and ST-segment elevation ≥1 mm in ≥2 standard leads and new left bundle branch block and (2) positive cardiac necrosis markers. CS was defined as (1) hypotension (systolic blood pressure <90 mm Hg for ≥30 minutes or need for inotropes or vasopressors or intra-aortic balloon pump counterpulsation (IABP) to maintain systolic blood pressure >90 mm Hg) and (2) end-organ hypoperfusion (cool extremities or urine output <30 ml/hour and heart rate ≥60 beats/min).
In-hospital and long-term complications were defined as follows: death was defined as death from all causes (cardiac and noncardiac). Reinfarction was defined as an ischemic event that met the European Society of Cardiology and American College of Cardiology criteria for infarction and was clearly clinically distinct from the index event at the time of admission. Stroke (hemorrhagic or ischemic) was defined as an acute neurologic deficit that lasted >24 hours and affected the ability to perform daily activities or resulted in death. Major bleeding was defined as overt clinical bleeding that (1) was associated with a decrease >5 g/dl (0.5 g/L) in hemoglobin level or >15% (absolute) in hematocrit level, (2) caused hemodynamic compromise, or (3) required blood transfusion. The combined outcome was the occurrence of death, reinfarction, stroke, or major bleeding.
The invasive strategy was defined as the performance of coronary angiography during the index hospitalization. Decisions related to treatment modalities (i.e., use of stents, IABP, glycoprotein IIb/IIIa inhibitors, methods of angioplasty) were left to the discretion of the attending physicians.
Statistical Analysis
Continuous variables are presented as medians and interquartile ranges. Categorical variables are presented as percentages. Continuous variables were compared using Student’s t tests or the Mann-Whitney U test as appropriate, and categorical variables were compared using Fisher’s exact tests or chi-square tests.
The association between treatment strategy (invasive or noninvasive) and death was analyzed using the Kaplan-Meier method with log-rank testing. The follow-up rate was 96.5%.
To identify independent predictors of death at 6-month follow-up, multivariate Cox regression analysis with a backward selection procedure was carried out. Factors included in the initial model were age, gender, previous MI, previous percutaneous coronary intervention (PCI), previous coronary artery bypass grafting (CABG), diabetes, hypertension, hypercholesterolemia, smoking, obesity, MI type, cardiac arrest before admission, systolic and diastolic arterial pressure, heart rate on admission, treatment strategy, fibrinolytic treatment, and use of IABP.
A propensity score analysis was used to compensate for the nonrandomized design of the registry. Propensity scores for each patient were calculated using a multiple regression model basing on the following covariates: age, gender, previous MI, previous PCI, previous CABG, diabetes, hypertension, hypercholesterolemia, smoking status, obesity, heart rate on admission, blood pressure on admission (systolic and diastolic), cardiac arrest before admission, and MI type. The C-statistic for this model was 0.74. For matching purposes, the “greedy” algorithm was used. The Mahalonobis distance calculation method with no matches allowed outside calipers was used. The caliper width was set to 0.2 times the SD of the scores. Distance calculation was based on the propensity score, and covariates were used to estimate the propensity score with a means of logistic regression. The degree of balance between measured covariates in matched groups was assessed using the standardized difference. A difference of <10% is considered an indicator of good balance between matched samples. In-hospital outcomes in the matched cohort were compared using McNemar’s test, and long-term survival was compared using the Prentice-Wilcoxon test.
A p value <0.05 was considered statistically significant. All reported p values are 2-sided. Analyses were performed with Statistica version 7.1 (StatSoft, Inc., Tulsa, Oklahoma), Number Crunching Statistical Systems version 2007 (NCSS, Kaysville, Utah), and SAS version 9.1 (SAS Institute Inc., Cary, North Carolina).
Results
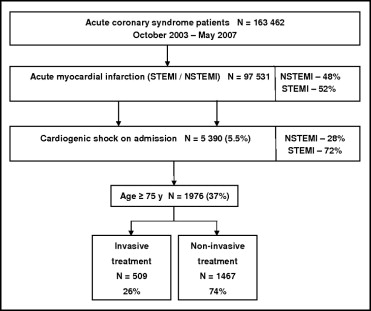
From October 2003 to May 2007, a total of 163,462 completed case report forms for patients with ACS were collected from 417 centers, including 97,531 patients with AMIs. Of all the patients, 5.5% (n = 5,390) had CS on admission, including 3,414 patients aged <75 years (1,470 treated invasively and 1,944 treated noninvasively) and 1,976 patients aged ≥75 years (509 treated invasively and 1,467 treated noninvasively) ( Figure 1 ).
The baseline clinical characteristics of invasively treated patients differed substantially from those of patients treated noninvasively. The former group included a higher rate of ST-segment elevation MI compared to the latter group. Additionally, clinical characteristics were more favorable in the invasive group. Detailed clinical characteristics are listed in Table 1 .
| Variable | Total Population of Patients Aged ≥75 Years (n = 1,976) | Invasive Strategy (n = 509) | Noninvasive Strategy (n = 1,467) | p Value |
|---|---|---|---|---|
| Demographics and medical history | ||||
| Age (years) | 80 (77–84) | 79 (77–82) | 81 (77–84) | <0.0001 |
| Men | 833 (42.2%) | 237 (46.6%) | 596 (40.6%) | 0.02 |
| Previous MI | 515 (26.1%) | 118 (23.2%) | 397 (27.1%) | 0.09 |
| Previous PCI | 34 (1.7%) | 15 (2.9%) | 19 (1.3%) | 0.02 |
| Previous CABG | 81 (4.1%) | 34 (6.7%) | 47 (3.2%) | 0.001 |
| Diabetes | 620 (31.4%) | 166 (32.6%) | 454 (30.9%) | 0.51 |
| Hypertension ⁎ | 1,093 (55.3%) | 294 (57.8%) | 799 (54.5%) | 0.21 |
| Hypercholesterolemia † | 574 (29.0%) | 167 (32.8%) | 407 (27.7%) | 0.03 |
| Current smokers | 212 (10.7%) | 82 (16.1%) | 130 (8.9%) | <0.0001 |
| Obesity ‡ | 358 (18.1%) | 94 (18.5%) | 264 (18.0%) | 0.84 |
| Clinical characteristics on admission | ||||
| ST-segment elevation MI | 1,314 (66.5%) | 423 (83.1%) | 891 (60.7%) | <0.0001 |
| Cardiac arrest before admission | 254 (12,9%) | 66 (13.0%) | 188 (12.8%) | 0.94 |
| Systolic blood pressure (mm Hg) | 80 (65–90) | 80 § (70–90) | 80 ∥ (60–90) | 0.007 |
| Diastolic blood pressure (mm Hg) | 40 (20–60) | 40 ¶ (30–60) | 40 # (20–60) | <0.0001 |
| Heart rate (beats/min) | 90 (70–112) | 84 (70–110) | 92 (70–114) | 0.002 |
| Rhythm origin (n = 1,470) | 0.009 | |||
| Sinus rhythm | 950 (64.6%) | 264 (68.8%) | 686 (63.2%) | |
| Pacemaker | 32 (2.2%) | 14 (3.6%) | 18 (1.7%) | |
| Atrial fibrillation | 273 (18.6%) | 58 (15.1%) | 215 (19.8%) | |
| Other/not specified | 215 (14.6%) | 48 (12.5%) | 167 (15.4%) | |
| Conduction abnormalities (n = 1,469) | 830 (56.5%) | 234 (60.9%) | 596 (54.9%) | 0.04 |
| Median ejection fraction (%) (n = 581) | 34 (25–45) | 35 (25–45) | 32 (20–44.25) | 0.48 |
Stay updated, free articles. Join our Telegram channel

Full access? Get Clinical Tree


