Heart rate
Blood pressure
Mentation
Skin perfusion
Urine output 50 cm3/h
Normal lactate/acid base status
Appropriate response to therapeutic interventions
23.2.2 Evaluation of Cardiac Function
Another reason for consideration of advanced monitoring is for frequent evaluation of cardiac function. In particular, serious illness in patients with underlying cardiac disease (e.g., cardiomyopathy, congestive heart failure, congenital heart disease, etc.) may require a careful titration of therapy to prevent decompensation. Situations that commonly result in invasive monitoring of patients include serious infectious episodes, planned major operations, and/or decompensation of the underlying disease.
23.2.3 Titration of Vasoactive Therapy
Many patients receive advanced monitoring due to hemodynamic instability (i.e., hypotension or severe hypotension) or due to the need to titrate vasoactive therapy for other therapeutic purposes (e.g., optimization of cerebral perfusion in patients with neurologic insult). Most vasoactive agents have short half-lives, requiring frequent titration of therapy to achieve monitoring targets. This need mandates accurate, continuous monitoring of blood pressure (or other end point), typically via an invasive route.
An important, but frequently unstated, reason for invasive monitoring in the critically ill patient is to allow a more definitive diagnosis and/or end point for treatment. This more definitive observation after initial evaluation may allow ongoing management of the patient’s issues with the clinician away from the bedside, allowing the clinician to perform other duties (Fig. 23.1).
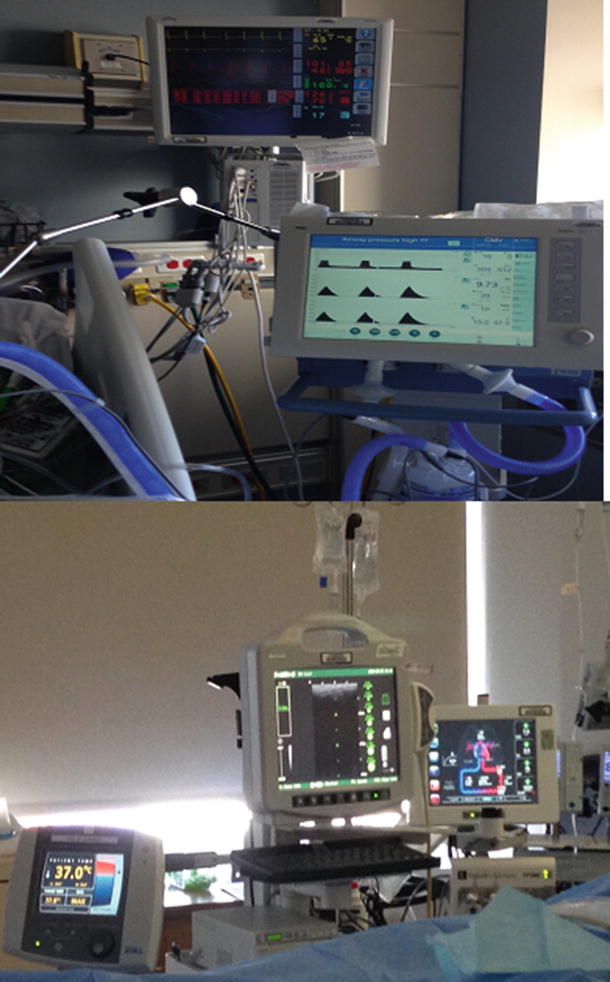

Fig. 23.1
Different monitors used in the ICU. Heart rate, arterial blood pressure, and mechanical ventilation settings (top). Intravascular temperature manager, ECHO, and perfusion monitors (below)
23.3 Monitors: Do They Help?
Despite the common reliance on monitors in the modern ICU, a number of monitoring end points commonly used have not demonstrated consistent benefit with respect to patient outcome, including continuous EKG monitoring, pulse oximetry, pulmonary artery catheters, and/or intracranial pressure monitoring. For example, with regard to pulse oximetry , Pedersen et al. in the Cochrane database systems review of 2003 [1] noted that “the conflicting subjective and objective results of the studies, despite an intense methodological collection of data from a relatively large population (>20,000 patients) indicates that the value of perioperative monitoring with pulse oximetry is questionable in relation to improved quality outcomes effectiveness and efficacy.”
Another randomized nonblinded study was performed in 2006 [2] which was designed to compare the effects of continuous and standard monitoring of pulse oximetry on patient outcomes in 1219 subjects. Ochroch and colleagues observed that there was no difference in the rate of ICU readmission from postcardiothoracic surgery care floor, mortality, or overall estimation of costs of hospitalization between the CPOX and standard monitor groups. The same can be said regarding pulmonary artery catheters. Shah et al. [3] noted that “despite almost 20 years of randomized controlled trials, a clear strategy leading to improved survival with a pulmonary artery catheter has not been devised.” This has led to the near abandonment of the use of pulmonary artery catheters in many institutions.
One nuance with regard to monitors is that the use of such devices will not change the outcome for a fatal disease if there is no treatment available for the disease [4]. For instance, while you can monitor the progression of end-stage organ function in a patient with metastatic cancer, it is unlikely that utilizing a monitor to guide therapy in such a patient will affect the ultimate survival outcome of the patient.
On the other hand, one positive bit of evidence demonstrating beneficial effects for physiologic monitoring relates to the significant decrease in anesthesia-related deaths over the last two decades. Anesthesia care is currently highly dependent on multiple physiologic monitors. As monitors have become increasingly utilized during anesthesia, the anesthesia-related mortality rate of 1 per 20,000 anesthetics reported in the late 1970s has decreased to a rate of 1 in 300,000 anesthetics at the turn of the century. Most knowledgeable clinicians in this area would agree that much of this decrease in mortality is related to both better understanding of pathophysiology and more widespread use of continuous monitoring.
23.3.1 What About Telemedicine?
Telemedicine applied to the ICU is an innovative approach to providing critical care services and to treating critical ill patients, especially those residing in broad or remote geographic areas (Fig. 23.2). Rosenfeld et al. published, in 2000 [5], the first feasibility study of telemedicine. Their study looked at a single open model surgical ICU that, for a 16-week period, was provided with 24-h off-site monitoring. Compared with the baseline periods prior to the intervention, the mortality rate, length of stay, and costs were all reduced. In another study, one from a large university medical center, administrators retrospectively reviewed their data from 2011 to 2012, which showed a reduction in mortality rates from 6.5 % before to 4.9 % after the implantation of an enhanced monitoring system [6]. Subsequently, other larger trials have also identified similar improvements in mortality [7, 8]. Finally, it was also suggested that if the hospital is able to provide the initial capital and financing for the ongoing operation, a tele-ICU may positively benefit the hospital’s profit margin [9].
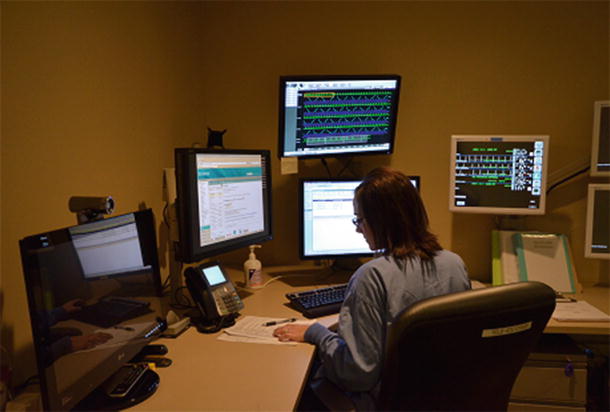

Fig. 23.2
Tele-ICU . The workstation arrangement in the tele-ICU may vary, but usually there are between 5 and 7 monitor screens displaying real-time patient data, including vital signs, medications, lab results, and the patient’s entire medical history
23.4 Invasive Monitoring Techniques in the ICU
23.4.1 Central Venous Pressure (CVP) Monitoring
Pressure monitoring in a central venous location, using a large-bore catheter, is likely the most frequently utilized invasive monitoring technique in current ICUs. Central venous catheters allow an estimate of “cardiac preload” and are typically placed via the internal jugular or subclavian venous route (Fig. 23.3). These monitors are very accurate for the identification of situations in which cardiac output is affected by a low preload. However, the assumption is made when monitoring CVPs that this value is proportional to pulmonary artery pressure, which is proportional to left atrial pressure, which is proportional to left ventricular end-diastolic volumes. Unfortunately, there are many common conditions in ICU patients which may elevate CVP that do not relate to increased filling of the left ventricle. These include: pneumonia, positive pressure ventilation, acute respiratory distress syndrome, pulmonary emboli, and others. Thus, one should have a strong concern for the situation in which a high CVP does not correlate with the clinical condition of the patient.
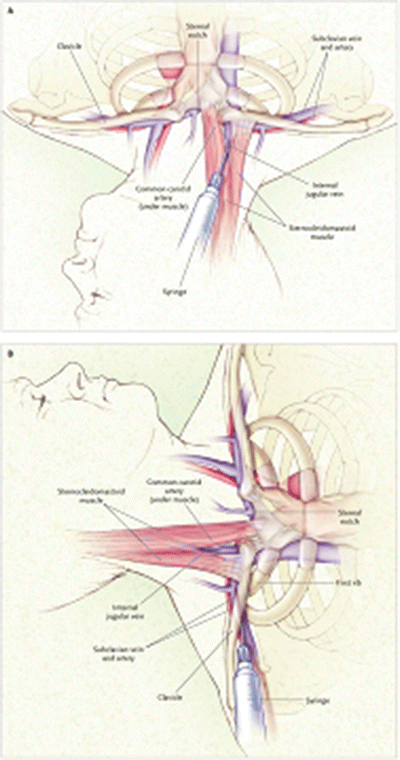

Fig. 23.3
Venous anatomy of subclavian (top) and internal jugular veins. Veins are in blue. Outline of clavicle and manubrium are in black (upper panel). Sternocleidomastoid muscle (lower panel) is in red
23.4.2 Arterial Blood Pressure Monitoring
Arterial blood pressure monitoring can be performed using both noninvasive and invasive techniques. Noninvasive monitors have progressed significantly over the years and currently allow a hands-off approach to intermittent measurement of blood pressure. Unfortunately, it is difficult to noninvasively measure blood pressure more frequently than every 5 min due to patient comfort and potential for inducing pressure sores. In situations where more frequent measures are necessary, invasive catheters placed percutaneously into a peripheral artery are utilized (Fig. 23.4). Typically, continuous beat-to-beat blood pressure is measured using an arterial catheter placed in one of several positions (most commonly radial or femoral arteries). However, this can be associated with injury, greater expense, and the need for required skills to acquire the data [10].
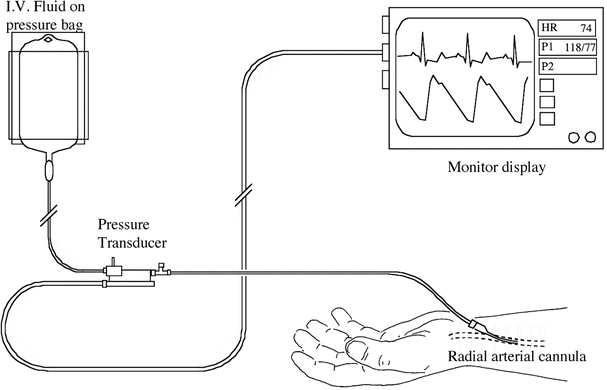

Fig. 23.4
Arterial line placed into radial artery. The line is attached to a pressure transducer which measures blood pressure and allows slow flush of intravenous fluid though the line. This line can also be utilized for sampling of arterial blood
Recently, a continuous noninvasive arterial pressure (CNAP) measurement was made possible by using a finger cuff technology (Fig. 23.5). It has been shown to be superior to intermittent oscillometric measurements in detecting rapid changes in arterial pressure [11]. Such an approach employs a double finger cuff that is easy to place on the patients’ hand, a pressure transducer mounted on the forearm, and an upper arm oscillometric cuff for calibration. The system outputs a continuous noninvasive blood pressure waveform that is similar to a direct arterial blood pressure waveform and also displays values for systolic, diastolic, and mean blood pressures as well as heart rate.
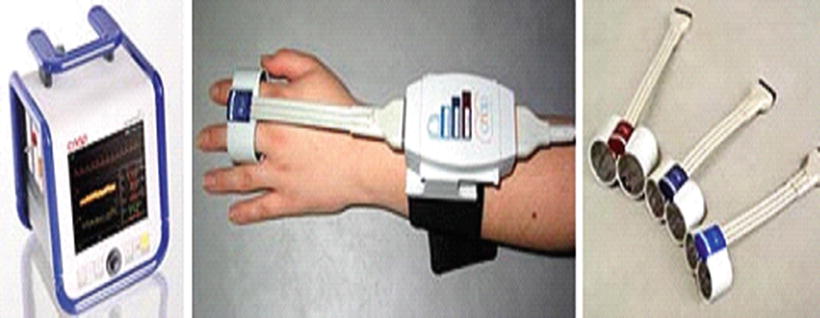

Fig. 23.5
Continuous noninvasive arterial blood pressure (CNAP) provides a continuous, beat-to-beat, blood pressure signal recorded from the fingers of a subject. The monitoring system uses a double finger cuff in three cuff sizes to accommodate small children through large adults. The system outputs a continuous blood pressure waveform that is similar to a direct arterial pressure waveform. Adopted from biopac.com
CNAP is obtained by applying pressure via the finger cuffs such that the blood volume flowing through the finger arteries is held constant (i.e., volume clamping). The diameter of a finger artery under a cuff is “clamped,” i.e., kept at a constant diameter in the presence of the changes in arterial pressure during each heart beat. The finger diameters are measured by means of an infrared photo-plethysmograph built into the finger cuff. The finger diameter is held constant by dynamically applying a counter pressure throughout the cardiac cycle. The pressure in the cuff that is needed to keep the volume constant during arterial pulsation corresponds to the relative arterial pressure. Recent studies have demonstrated comparable results to continuous invasive arterial blood pressure measurements [12]. For additional information on blood pressure monitoring, see Chap. 18.
Like CVP monitoring, there are assumptions built into blood pressure monitoring that are occasionally incorrect. Importantly, the assumption that a normal arterial blood pressure has excluded the presence of shock may be false, since afterload may be increased due to low cardiac output. This results in a normal blood pressure but inadequate oxygen delivery to tissues.
23.4.3 Pulmonary Artery Catheter
Since pulmonary artery catheterization was first described in 1970 by Drs. Swan and Ganz [13], it has been widely used as a diagnostic tool and to understand the physiology of the cardiovascular system during critical illness. The pulmonary artery catheter is inserted via central venous access through the femoral, subclavian, or internal jugular route. A balloon at the tip of the catheter allows the catheter to be “floated” to the right side of the heart and into the pulmonary artery, where it wedges into a smaller branch of the pulmonary artery (Fig. 23.6). It allows the measurement of stroke volume, cardiac output, mixed venous saturation, and pressures on the right side of the heart (Table 23.2). This catheter allows for a more accurate measure of intravascular volume than CVP because it bypasses the situations that can falsely elevate CVP; additionally, the information it provides can be utilized to distinguish among the various types of shock (Table 23.3). Since the pulmonary artery system is a high flow, low resistance system, those conditions which falsely elevate pulmonary artery pressure do not affect pulmonary artery wedge pressure. As noted previously, the use of this catheter has significantly declined in the last decade due to paucity of data supporting improved mortality, general ICU or hospital length of stay, or cost for adult patients in intensive care [14, 15]. Despite the decreased use, the pulmonary artery catheter can still be indispensable to assist in the evaluation and titration of therapy of the patient with multisystem disease.
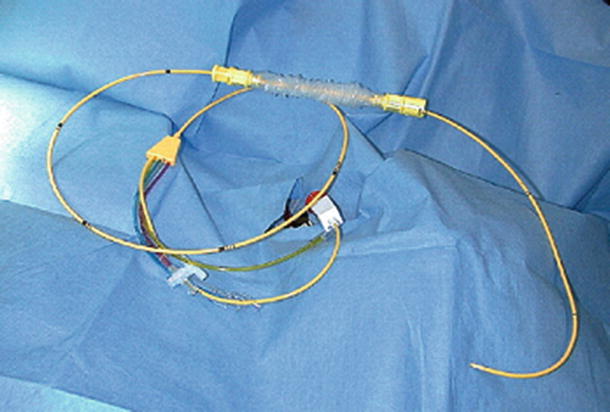

Fig. 23.6
Pulmonary artery catheter . This catheter has an inflatable balloon at the tip, allowing the catheter to be carried through the right heart and into the pulmonary artery during insertion
Table 23.2
Calculations for invasive hemodynamic measurements
Hemodynamic formula | Normal |
|---|---|
CI = CO/BSA | 2.8–4.2 l/min/m2 |
SV = CO/HR | 60–90 ml/beat |
MAP = DBP + 1/3 (SBP − DBP) | 80–120 mmHg |
SVR = [(MAP − CVP)/CO] × 80 | 900–1400 dynes cm s3 |
SVRI = [(MAP − CVP)/CI] | 1900–2400 dynes cm m3 |
PVR = [(MPAP − PAOP)/CO] × 80 | 100–250 dynes cm s3 |
Arterial oxygen content: CaO2 = (SaO2) (Hb × 1.34) + PaO2 (0.0031) | 21 ml/100 ml |
Venous oxygen content: CvO2 = (SvO2) (Hb × 1.34) + PvO2 (0.0031) | 15 ml/100 ml |
Oxygen consumption: VO2 = CO (CaO2 − CvO2) × 10 (VO2 not indexed, indexed by weight, BSA) | 225–275 ml/min, 3.5 ml/kg/min; 110 ml/min/m2 |
Oxygen delivery: DO2 = CO(CaO2) × 10 | 1000 ml/min |
Oxygen extraction ratio: O2ER = VO2/DO2 < div class='tao-gold-member'>
Only gold members can continue reading. Log In or Register to continue
Stay updated, free articles. Join our Telegram channel
Full access? Get Clinical Tree
 Get Clinical Tree app for offline access

|