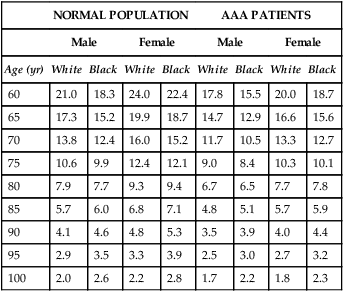
If AAA rupture risk is average or high, the next step in decision making should be to estimate the patient’s life expectancy. Thus a knowledge of life expectancy by age, sex, and race for patients with AAA becomes important (Table 1). Patients with a short life expectancy as a result of comorbid conditions are less likely to benefit from AAA repair unless the risk of AAA rupture is very high. AAA patients often have multiple comorbid diseases such as coronary artery disease (CAD) and hypertension. Therefore, the late survival rate for patients after elective AAA repair is significantly less than age-matched and sex-matched patients without AAAs (60% versus 79% at 6 years). TABLE 1 Life Expectancy in Years for Patients with Abdominal Aortic Aneurysms AAA, Abdominal aortic aneurysm. Adapted from U.S. National Center for Health Statistics: National Vital Statistics Reports (NVSR). Deaths: Final Data for 2007, Vol. 58, No. 19, May 2010. In most analyses, the strongest predictors of perioperative mortality are older age, kidney disease, and heart failure. Other predictors include female gender and evidence of atherosclerotic disease distant to that affecting the AAA. Operative mortality with open repair with concomitant renal bypass was reported to be 30% higher than open repair without renal revascularization. Preoperative estimations of a patient’s risk for mortality uses a scoring system that stratifies patients into three risk classes (depending on the procedure) that can be easily calculated using clinical or administrative data (Table 2). TABLE 2 Scoring Method to Predict Mortality after Endovascular or Open Repair of Abdominal Aortic Aneurysm
Management of Small Abdominal Aortic Aneurysms
Life Expectancy
NORMAL POPULATION
AAA PATIENTS
Male
Female
Male
Female
Age (yr)
White
Black
White
Black
White
Black
White
Black
60
21.0
18.3
24.0
22.4
17.8
15.5
20.0
18.7
65
17.3
15.2
19.9
18.7
14.7
12.9
16.6
15.6
70
13.8
12.4
16.0
15.2
11.7
10.5
13.3
12.7
75
10.6
9.9
12.4
12.1
9.0
8.4
10.3
10.1
80
7.9
7.7
9.3
9.4
6.7
6.5
7.7
7.8
85
5.7
6.0
6.8
7.1
4.8
5.1
5.7
5.9
90
4.1
4.6
4.8
5.3
3.5
3.9
4.0
4.4
95
2.9
3.5
3.3
3.9
2.5
3.0
2.7
3.2
100
2.0
2.6
2.2
2.8
1.7
2.2
1.8
2.3

Operative Risk
SCORING BY RISK FACTOR
Risk Factor
Score
OR (95% CI)
Age >80 yr
+11
3.1 (2.4–4.2)
Age 76–80 yr
+6
1.9 (1.4–2.5)
Age 71–75 yr
+1
1.2 (0.9–1.6)
Female
+4
1.5 (1.3–1.8)
Renal failure: dialysis dependent
+9
2.6 (1.5–4.6)
Renal failure: no dialysis
+7
2.0 (1.6–2.6)
Congestive heart failure
+6
1.7 (1.5–2.1)
Peripheral or cerebrovascular disease
+3
1.3 (1.2–1.6)
Total score
____
INTERPRETATION OF SCORE
Risk
Score Range
Predicted Mortality (%)
Open
EVAR
High
>11
>6.3
>2
Medium
3–11
2.8–6.3
0.9–2.0
Low
<3
<2.8
<1 ![]()
Stay updated, free articles. Join our Telegram channel

Full access? Get Clinical Tree


Management of Small Abdominal Aortic Aneurysms
