The relation between the arterial and venous systems in patients with impaired lower extremity blood flow remains poorly described. The objective of this secondary analysis of the Effectiveness of Intensive Lipid Modification Medication in Preventing the Progression on Peripheral Artery Disease Trial was to determine the association between femoral vein (FV) volumes and measurements of peripheral artery disease. FV wall, lumen, and total volumes were quantified with fast spin-echo proton density–weighted magnetic resonance imaging scans in 79 patients with peripheral artery disease over 2 years. Reproducibility was excellent for FV total vessel (intraclass correlation coefficient 0.924, confidence interval 0.910 to 0.935) and lumen volumes (intraclass correlation coefficient 0.893, confidence interval 0.873 to 0.910). Baseline superficial femoral artery volumes were directly associated with FV wall ( r = 0.46, p <0.0001), lumen ( r = 0.42, p = 0.0001), and total volumes ( r = 0.46, p <0.0001). The 2-year change in maximum walking time was inversely associated with the 24-month change in FV total volume ( r = −0.45, p = 0.03). In conclusion, FV volumes can be measured reliably with fast spin-echo proton density–weighted magnetic resonance imaging, and baseline superficial femoral artery plaque burden is positively associated with FV volumes, whereas the 2-year change in FV volumes and leg function show an inverse relation.
Peripheral artery disease (PAD) is associated with reduced blood flow in the lower extremities and impaired lower extremity function. Hemodynamic dysfunction plays a central role in PAD and in venous disease. Venous disease and venous hypertension manifest as dilated veins which over time can result in chronic venous insufficiency (CVI), a condition seen more frequently in older patients and patients with PAD. The relation between PAD and the venous system remains poorly described. The purpose of this secondary analysis of the Effectiveness of Intensive Lipid Modification Medication in Preventing the Progression on Peripheral Artery Disease Trial (ELIMIT; NCT00687076 ) was to determine the association between femoral vein (FV) volumes and measurements of PAD in patients with lifestyle-limiting intermittent claudication. We hypothesized that FV volumes are positively associated with markers of PAD including superficial femoral artery (SFA) volumes and the ankle–brachial index (ABI).
Methods
ELIMIT was a randomized, double-blinded, and double placebo-controlled trial which included 102 subjects with lifestyle-limiting claudication consistent with Fontaine stage IIa/IIb or angiographically confirmed Trans-Atlantic Inter-Society Consensus A to C lesions in the SFA. The study details of ELIMIT have been reported previously. Briefly, patients were randomized to either triple lipid modification therapy with simvastatin (40 mg/day), ezetimibe (10 mg/day), and niacin (1,500 mg/day) or monotherapy with simvastatin (40 mg/day). Patients in the monotherapy group received placebo ezetimibe and niacin. All patients were recruited between 2005 and 2008 with serial magnetic resonance imaging (MRI) scans of the lower extremities to assess SFA total vessel, lumen, and wall volumes. For this study, we have reanalyzed the MRI scans to measure FV volumes.
Scans were acquired with a 3.0T MRI scanner system (Signa Excite; GE Healthcare, Milwaukee, Wisconsin) using a unilateral phased-array coil with a field of view of 8 cm (along z axis) and 12 cm (in x and y axes; Pathway, Biomedical, Inc). The coil was centered 8 cm proximal to the patella. Fast spin-echo (FSE) proton density–weighted (PDW) scans were acquired (repetition time 2,575 ms, echo time 30 ms, flip angle 90°, slice thickness 2 mm, in-plane pixel spacing 0.43 × 0.43 mm, number of excitations of 2, echo train length of 8, matrix size 384 × 224, and field of view 22 cm). Images were acquired with the participant free breathing. Analysis was performed for the target limb that was defined as the nonintervened limb or the less-symptomatic limb in patients who were not scheduled for revascularization. In case the target limb was revascularized during the study, the analysis was limited to MRI data up to and including the last imaging visit before the intervention.
Quality scores were analyzed for the PDW, T1-weighted (T1W), and T2-weighted (T2W) scans for 12 patients across 3 imaging visits by 1 reader during the primary analysis of ELIMIT. Scan quality was determined using a 4-point image quality scale (4 being best) using edge sharpness, amount of blurring, artifacts, and amount of noise. The quality scores of PDW scans were found to be significantly greater than those of T1-weighted and T2-weighted scans (3.10 vs 2.49 and 2.29, respectively), and thus, they were used for the primary report on ELIMIT and for this analysis ( Figure 1 ).
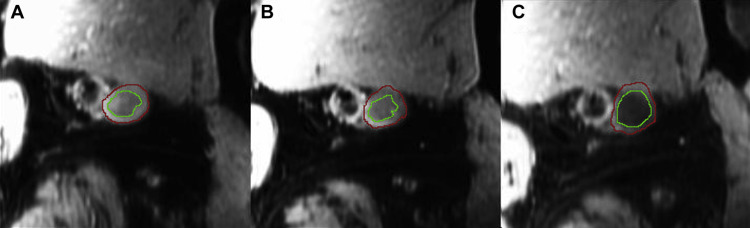
MRI coregistration by manual identification of anatomic landmarks and acquisition of the SFA wall, lumen, and total vessel volumes were performed during the main study. For this study, reading of the FV volumes was performed by 2 readers blinded to identifiable information for each scan using VesselMASS (University of Leiden, The Netherlands). The FV was identified adjacent to the SFA, and contours were drawn by freehand on the outer and inner walls of the vessel across coregistered slices with contour detection from VesselMASS. The FV total vessel, wall, and lumen volumes were then automatically calculated for each image. FV and SFA analyses were performed for the same anatomic coverage (same number of MRI slices on a per-patient basis). Interreader variability was assessed by intraclass correlation (ICC) using a 2-way random-effects model.
Baseline characteristics and 24-month changes in variables were expressed as mean ± SD. Variables were compared using the nonparametric Kruskal–Wallis rank test or parametric Student t test, as appropriate. Normality was checked with the Shapiro–Wilk test. Equal variances were determined with the Bartlett test. All tests of comparison were 2 tailed with a p value <0.05 considered statistically significant. Data from the 2 drug groups in the original study were pooled and compared to assess the relation between venous volumes and markers of PAD. Pearson correlation coefficient regression was performed to assess the relation between FV volumes and SFA volumes, ABI, and body mass index (BMI). An ICC coefficient >0.70 was considered as excellent agreement between the 2 readers. All statistical analysis was performed using STATA: Stata Statistical Software: Release 12 (College Station, Texas; StataCorp LP).
Results
Of the 102 patients who were randomized in ELIMIT, 87 completed the baseline visit. Eight patients opted out of baseline imaging, 6 declined other studies, and 1 withdrew from the study. Of the 87 patients with baseline MRIs, 8 did not have sufficient image quality for venous analysis. Thus, a total of 79 patients with baseline MRI images were used for the present analysis ( Table 1 ).
| Variable | Mono-Therapy | Triple- Therapy | P-Value |
|---|---|---|---|
| Age (years) | 64 ± 7.2 | 62 ± 7.8 | 0.16 |
| Ankle brachial index | 0.80 ± 0.22 | 0.76 ± 0.23 | 0.47 |
| Men | 40 (95%) | 34 (92%) | 0.40 |
| Body mass index (kg/m 2 ) | 31 ± 7.3 | 31 ± 7.9 | 0.74 |
| Black | 3 (7.1%) | 10 (27%) | 0.017 |
| Smoker | 15 (36%) | 17 (46%) | 0.30 |
| Diabetes Mellitus | 17 (40%) | 15 (41%) | 0.84 |
| Hypertension (history) | 36 (86%) | 30 (81%) | 0.59 |
| Hyperlipidemia | 40 (95%) | 36 (97%) | 0.59 |
| Aspirin use | 41 (98%) | 37 (100%) | 0.32 |
| Statin use | 40 (95%) | 34 (92%) | 0.56 |
| Baseline walking pain | 17 (40%) | 16 (43%) | 0.74 |
| Baseline pain-free walking time (min) | 3.72 ± 3.22 | 2.83 ± 2.22 | 0.17 |
| Baseline FV total volume (mm 3 ) | 126 ± 46 | 138 ± 48 | 0.26 |
| Baseline FV lumen volume (mm 3 ) | 57 ± 27 | 64 ± 30 | 0.25 |
| Baseline FV wall volume (mm 3 ) | 69 ± 21 | 74 ± 20 | 0.32 |
Interreader correlation was assessed for 20 PDW scans read by both readers and was found to be excellent for FV total vessel and FV lumen volumes ( Table 2 ). In addition, intrareader variability was assessed by the main reader analyzing 10 PDW scans for a second time. Intrareader variability was also found to be excellent for FV total vessel and FV lumen volumes.
| N (patients) | N (slices ∗ ) | Total FV | FV Lumen | |||
|---|---|---|---|---|---|---|
| ICC | Confidence Interval (95%) | ICC | Confidence Interval (95%) | |||
| Intra-reader correlation | 10 | 231 | 0.944 | 0.927 – 0.957 | 0.905 | 0.878 – 0.926 |
| Inter-reader correlation | 20 | 528 | 0.924 | 0.910 – 0.935 | 0.893 | 0.873 – 0.910 |
∗ Number of slices differed across patients based on MRI co-registration.
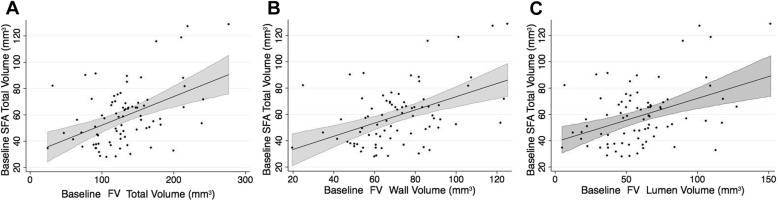
Data from both drug groups in ELIMIT were combined for pooled analyses to assess baseline association between FV volumes and parameters associated with PAD. FV volumes were correlated positively with SFA volumes ( Table 3 ). There was a significant correlation between SFA wall volume with FV total vessel volume ( r = 0.429, p = 0.0001), FV wall volume ( r = 0.448, p <0.0001), and FV lumen volume ( r = 0.384, p = 0.0005; Figure 2 ). FV total volumes were significantly larger than SFA total volumes across equal lengths (131.85 ± 5.29 vs 59.1 ± 2.51 mm 3 , p <0.001). FV volumes were positively correlated with ABI and BMI ( Table 4 ).
| SFA Total Volume | SFA Wall Volume | SFA Lumen Volume | ||
|---|---|---|---|---|
| FV total volume | r p-value | 0.458 <0.0001 | 0.429 0.0001 | 0.342 0.002 |
| FV wall volume | r p-value | 0.463 <0.0001 | 0.448 <0.0001 | 0.324 0.004 |
| FV lumen volume | r p-value | 0.422 0.0001 | 0.384 0.0005 | 0.331 0.003 |
| Independent Variable | β | SE | R 2 | Adjusted r 2 | P-Value | |
|---|---|---|---|---|---|---|
| Baseline FV total volume (mm 3 ) | Baseline SFA total volume (mm 3 ) | 0.97 | 0.21 | 0.210 | 0.200 | <0.0001 |
| Baseline SFA lumen volume (mm 3 ) | 1.51 | 0.47 | 0.117 | 0.106 | 0.002 | |
| Baseline SFA wall volume (mm 3 ) | 1.31 | 0.32 | 0.184 | 0.173 | <0.0001 | |
| ABI | 0.58 | 0.25 | 0.080 | 0.065 | 0.022 | |
| BMI | 1.79 | 0.66 | 0.087 | 0.075 | 0.009 | |
| Baseline FV wall volume (mm 3 ) | Baseline SFA total volume (mm 3 ) | 0.43 | 0.09 | 0.214 | 0.204 | <0.0001 |
| Baseline SFA lumen volume (mm 3 ) | 0.63 | 0.21 | 0.105 | 0.093 | 0.004 | |
| Baseline SFA wall volume (mm 3 ) | 0.60 | 0.14 | 0.201 | 0.190 | <0.0001 | |
| ABI | 0.24 | 0.11 | 0.074 | 0.060 | 0.027 | |
| BMI | 0.82 | 0.29 | 0.094 | 0.082 | 0.006 | |
| Baseline FV lumen volume (mm 3 ) | Baseline SFA total volume (mm 3 ) | 0.54 | 0.13 | 0.178 | 0.167 | <0.0001 |
| Baseline SFA lumen volume (mm 3 ) | 0.88 | 0.29 | 0.109 | 0.098 | 0.003 | |
| Baseline SFA wall volume (mm 3 ) | 0.71 | 0.20 | 0.147 | 0.136 | 0.001 | |
| ABI | 0.34 | 0.15 | 0.073 | 0.059 | 0.028 | |
| BMI | 0.97 | 0.40 | 0.070 | 0.058 | 0.019 |
Stay updated, free articles. Join our Telegram channel

Full access? Get Clinical Tree


