The goal of this analysis was to evaluate the ability of insulin resistance, identified by the presence of prediabetes mellitus (PreDM) combined with either an elevated triglyceride (TG >1.7 mmol/l) or body mass index (BMI ≥27.0 kg/m 2 ), to identify increased risk of statin-associated type 2 diabetes mellitus (T2DM). Consequently, a retrospective analysis of data from subjects without diabetes in the Treating to New Targets and the Stroke Prevention by Aggressive Reduction in Cholesterol Levels randomized controlled trials was performed, subdividing participants into 4 experimental groups: (1) normal fasting glucose (NFG) and TG ≤1.7 mmol/l (42%); (2) NFG and TG >1.7 mmol/l (22%); (3) PreDM and TG ≤1.7 mmol/l (20%); and (4) PreDM and TG >1.7 mmol/l (15%). Comparable groupings were created substituting BMI values (kg/m 2 <27.0 and ≥27.0) for TG concentrations. Patients received atorvastatin or placebo for a median duration of 4.9 years. Incident T2DM, defined by developing at least 2 fasting plasma glucose (FPG) concentrations ≥126 mg/dl, an increase in FPG ≥37 mg/dl, or a clinical diagnosis of T2DM, was observed in 8.2% of the total population. T2DM event rates (statin or placebo) varied from a low of 2.8%/3.2% (NFG and TG ≤1.7 mmol/l) to a high of 22.8%/7.6% (PreDM and TG >1.7 mmol/l) with intermediate values for only an elevated TG >1.7 mmol/l (5.2%/4.3%) or only PreDM (12.8%/7.6%). Comparable differences were observed when BMI values were substituted for TG concentrations. In conclusion, these data suggest that (1) the diabetogenic impact of statin treatment is relatively modest in general; (2) the diabetogenic impact is accentuated relatively dramatically as FPG and TG concentrations and BMI increase; and (3) PreDM, TG concentrations, and BMI identify people at highest risk of statin-associated T2DM.
Given widespread use of statin therapy and recent concerns as to statin-associated type 2 diabetes (T2DM), identifying people at the greatest risk of developing T2DM while on statins would provide useful clinical information. Risk of incident T2DM in association with statin therapy is increased in patients with higher blood pressures and fasting plasma glucose (FPG) and triglyceride (TG) concentrations, a constellation of abnormalities closely associated with insulin resistance. Because insulin resistance is an independent predictor of T2DM, having a simple way of identifying an insulin-resistant subpopulation before statin treatment should be clinically useful. Hyperinsulinemia is the surrogate estimate most closely correlated with direct measurements of insulin resistance, but the absence of a standardized insulin assay limits its clinical utility. Prevalence of insulin resistance is increased in patients with prediabetes mellitus (PreDM), and a diagnosis of PreDM, defined by an FPG concentration ≥5.6 mmol/l (100 mg/dl) and <7.0 mmol/L (126 mg/dl), predicts statin-associated T2DM. Although this FPG cut point provides a useful first step in efforts to identify enhanced risk of statin-associated T2DM, PreDM is a heterogeneous entity, and not all subjects with this diagnosis are insulin resistant. Consequently, we hypothesized that combining a diagnosis of PreDM with an additional index of insulin resistance would more effectively identify a subset of patients with PreDM who were further enriched with insulin resistance and at even greater greatest risk of statin-associated T2DM. For this purpose, we evaluated the impact of combining a diagnosis of PreDM with a measurement of either fasting TG concentration >1.7 mmol/l (>150 mg/dl) or a body mass index (BMI) ≥27.0 kg/m 2 , either one of which is associated with insulin resistance. The goal of this analysis was to extend our earlier findings by determining the degree to which combining PreDM with either fasting plasma TG concentration >1.7 mmol/l or a BMI ≥27.0 kg/m 2 improved identification of subjects most likely to develop statin-associated T2DM.
Methods
The study population consisted of patients without diabetes mellitus (DM) pooled from the Treating to New Targets (TNT) and the Stroke Prevention by Aggressive Reduction in Cholesterol Levels (SPARCL) trials, the design and findings of which have been published. The TNT study randomized 10,001 patients with coronary disease to atorvastatin 10 or 80 mg/day, whereas the SPARCL study randomized 4,731 patients with stroke or transient ischemic attack to atorvastatin 80 mg or placebo. Both studies had a median follow-up of 4.9 years. Patients with DM (n = 2,843) at baseline were excluded from the combined cohort, and 489 were excluded because fewer than 2 postbaseline FPG measurements were available or because baseline TG (n = 4) or FPG measurements were missing (n = 42).
Subjects were classified as having normal fasting glucose (NFG; FPG <5.6 mmol/l: n = 7,085) or PreDM (n = 4,269) on the basis of their FPG as defined by American Diabetes Association criteria. Follow-up visits occurred at week 12 and at months 6 and 9 (in TNT), and at week 12 in the first year and every 6 months thereafter. FPG was measured before statin treatment, annually, and at the end of the studies. Incident T2DM was defined prospectively as ≥2 postbaseline FPG measurements ≥7.0 mmol/l or at least 1 postbaseline FPG ≥2.0 mmol/l above baseline. Subjects were also considered to have developed T2DM on the basis of adverse event reporting or new medication for diabetes.
The analysis involved comparison of incident T2DM on the basis of baseline FPG plus either TG concentration or BMI value. Thus, comparisons were between patients subdivided into 4 subgroups on the basis of their FPG and TG concentration: NFG and TG ≤1.7 mmol/l; NFG and TG >1.7 mmol/l; PreDM and TG ≤1.7 mmol/l; and PreDM and TG >1.7 mmol/l. In addition, comparisons were made between patients subdivided into 4 subgroups on the basis of their baseline FPG and BMI values (NFG and BMI <27.0 kg/m 2 ; NFG and BMI ≥ 27.0 kg/m 2 ; PreDM BMI < 27.0 kg/m 2 , and PreDM and BMI ≥ 27.0 kg/m 2 ). Comparisons were also made using these same groupings in SPARCL to compare incident T2DM in statin-treated versus placebo-treated subjects.
Univariate and multivariate adjusted Cox proportional hazards models were used to calculate hazard ratios (HRs) and 95% confidence intervals (CIs) to compare incident T2DM between the groups. Models were adjusted for factors that may have been independently associated with development of T2DM including hypertension, high-density lipoprotein cholesterol (HDL-C), and study.
Results
Baseline demographic and metabolic characteristics of the 4 statin-treated groups, subdivided on the basis of combining glucose tolerance status with either TG concentration or BMI, are compared in Table 1 (TG concentration) and Table 2 (BMI). In Table 1 , the largest group comprised people with NFG and TG ≤1.7 mmol/l (42%), with the fewest subjects having PreDM and TG >1.7 mmol/l (15%). The 4 groups were reasonably comparable in terms of age, gender, and race. BMI was highest in those with PreDM and TG >1.7 mmol/l and lowest in subjects with NFG and TG ≤1.7 mmol/l. By selection, FPG was highest in those with PreDM, with higher TG concentrations in those selected for that characteristic. Low-density lipoprotein cholesterol (LDL-C) concentration was reasonably comparable across the 4 groups, and HDL-C concentrations were lowest in the 2 groups with elevated TG concentrations.
| Fasting glucose (mmol/L) | <5.6 | <5.6 | ≥5.6 – <7.0 | ≥5.6 – <7.0 | |
| Triglycerides (mmol/L) | ≤1.7 | >1.7 | ≤1.7 | >1.7 | |
| Total (n=11354) | (N=4782) | (N = 2303) | (N = 2544) | (N = 1725) | |
| Male | 8495 (74.8%) | 3521 (73.6%) | 1632 (70.9%) | 2039 (80.2%) | 1303 (75.5%) |
| White | 10778 (94.9%) | 4489 (94.0%) | 2219 (96.4%) | 2431 (95.6%) | 1639 (95.0%) |
| Age (years) | 61.2 ± 9.9 | 61.5 ± 10.2 | 59.2 ± 10.0 | 62.8 ± 9.3 | 60.8 ± 9.5 |
| BMI (kg/m2) | 27.8 ± 4.3 | 26.7 ± 4.0 | 28.3 ± 4.2 | 28.1 ± 4.2 | 29.6 ± 4.6 |
| Fasting glucose (mmol/L) (mg/dl) | 5.38 ± 0.59 96.8 ± 10.6 | 5.01 ± 0.38 90.18 ± 6.84 | 5.03 ± 0.37 90.54 ± 6.66 | 5.95 ± 0.34 107.10 ± 6.12 | 6.01 ± 0.37 108.18 ± 6.66 |
| Systolic BP (mmHg) | 132 ± 18 | 131 ± 18 | 131.4 ± 17 | 134 ± 19 | 133.9 ± 17 |
| Diastolic BP (mmHg) | 79 ± 10 | 79 ± 10 | 79.6 ± 10 | 79.3 ±10 | 80.3 ± 10 |
| Smoker | |||||
| Never | 3252 (28.6%) | 1554 (32.5%) | 631 (27.4%) | 691 (27.2%) | 376 (21.8%) |
| Ex | 6345 (55.9%) | 2517 (52.6%) | 1223 (53.1%) | 1536 (60.4%) | 1069 (62.0%) |
| Current | 1757 (15.5%) | 711 (14.9%) | 449 (19.5%) | 317 (12.5%) | 280 (16.2%) |
| Hypertension | 6033 (53.1%) | 2329 (48.7%) | 1256 (54.5%) | 1426 (56.1%) | 1022 (59.3%) |
| Total Cholesterol (mmol/L) (mg/dl) | 4.84 ± 0.80 187.16 ± 30.94 | 4.74 ± 0.80 183.29 ± 30.93 | 5.12 ± 0.81 197.99 ± 31.32 | 4.66 ± 0.80 180.20 ± 30.94 | 5.08 ± 0.75 196.44 ± 29.00 |
| LDL-C (mmol/L) (mg/dl) | 2.85 ± 0.67 110.21 ± 25.91 | 2.85 ± 0.67 110.20 ± 25.91 | 2.87 ± 0.70 110.98 ± 27.07 | 2.80 ± 0.67 108.27 ± 25.91 | 2.85 ± 0.65 110.21 ± 25.14 |
| HDL-C (mmol/L) (mg/dl) | 1.27 ± 0.31 49.11 ± 11.99 | 1.35 ± 0.34 52.20 ± 131.5 | 1.17 ± 0.28 45.24 ± 10.83 | 1.32 ± 0.31 51.04 ± 11.99 | 1.14 ± 0.26 44.08 ± 10.05 |
| TG (mmol/L) (mg/dl) | 1.64 ± 0.82 145.26 ± 72.63 | 1.19 ± 0.30 105.40 ± 26.57 | 2.42 ± 0.99 214.35 ± 87.69 | 1.22 ± 0.29 108.10 ± 25.69 | 2.44 ± 0.71 216.12 ± 62.89 |
| Fasting Glucose (mmol/L) | <5.6 | <5.6 | ≥5.6 – <7.0 | ≥5.6 – <7.0 | |
| BMI (kg/ m 2 ) | <27 | ≥27 | <27 | ≥27 | |
| Total (n=11281) | (N=3697) | (N = 3348) | (N = 1592) | (N = 2644) | |
| Male | 8450 (74.9%) | 2691 (72.8%) | 2439 (72.6%) | 1251 (78.6%) | 2069 (78.2%) |
| White | 10709 (94.4%) | 3522 (95.3%) | 3150 (94.1%) | 1530 (96.1%) | 2507 (94.8%) |
| Age (years) | 61.2 ± 9.9 | 61.9 ± 10.3 | 59.6 ± 9.9 | 63.3 ± 9.6 | 61.1 ± 9.2 |
| BMI (kg/m2) | 27.8 ± 4.3 | 24.3 ± 2.0 | 30.4 ± 3.5 | 24.7 ± 1.7 | 31.1 ± 3.7 |
| Fasting glucose (mmol/L) (mg/dl) | 5.38 ± 0.59 96.84 ± 10.62 | 5.0 ± 0.38 90 ± 6.84 | 5.03 ± 0.37 90.54 ± 6.66 | 5.94 ± 0.33 106.90 ± 5.93 | 6.01 ± 0.33 108.10 ± 6.0 |
| Systolic BP (mmHg) | 132.42 ± 17.8 | 131 ± 18.0 | 131.96 ± 17.1 | 133.1 ± 18.6 | 134.59 ± 17.7 |
| Diastolic BP (mmHg) | 79.26 ± 10.0 | 78.06 ± 9.8 | 80.1 ± 10.0 | 78.5 ± 10.2 | 80.4 ± 9.8 |
| Smoker | |||||
| Never | 3225 (28.6%) | 1174 (31.8%) | 997 (29.8%) | 428 (26.9%) | 626 (23.7%) |
| Ex | 6318 (56.0%) | 1853 (50.1%) | 1873 (55.9%) | 903 (56.7%) | 1689 (63.9%) |
| Current | 1738 (15.4%) | 670 (18.1%) | 478 (14.3%) | 261 (16.4%) | 329 (12.4%) |
| HTN | 5991 (53.1%) | 1651 (44.7%) | 1915 (57.2%) | 786 (49.4%) | 1639 (62.0%) |
| Total Cholesterol (mmol/L) (mg/dl) | 4.84 ± 0.81 187.16 ± 31.32 | 5.28 ± 0.14 204.18 ± 5.41 | 4.82 ± 0.80 186.39 ± 30.94 | 4.87 ± 0.83 188.32 ± 32.10 | 4.79 ± 0.76 185.23 ± 29.39 |
| LDL-C (mmol/L) (mg/dl) | 2.83 ± 0.67 109.43 ± 25.91 | 2.87 ± 0.70 110.98 ± 27.07 | 2.82 ± 0.66 109.05 ± 25.52 | 2.87 ± 0.70 110.98 ± 27.07 | 2.78 ± 0.63 107.50 ± 24.36 |
| HDL-C (mmol/L) (mg/dl) | 1.27 ± 0.32 49.11 ± 12.37 | 1.34 ± 0.35 51.82 ± 13.53 | 1.24 ± 0.30 47.95 ± 11.60 | 1.30 ± 0.31 50.27 ± 11.99 | 1.20 ± 0.27 46.40 ± 10.44 |
| TG (mmol/L) (mg/dl) | 1.62 ± 0.81 143.49 ± 71.74 | 1.45 ± 0.65 128.43 ± 57.57 | 1.71 ± 0.98 151.46 ± 86.80 | 1.54 ± 0.71 136.40 ± 62.89 | 1.79 ± 0.79 158.55 ± 69.97 |
Similar comparisons are provided in Table 2 , evaluating differences in the 4 statin-treated groups that varied in terms of glucose tolerance status and BMI. In this instance, the largest group consisted of people with NFG and a BMI ≤27 kg/m 2 (33%), with the smallest group comprising those with PreDM and a BMI ≤27.0 kg/m 2 (14%). The 4 groups were again comparable in terms of age, gender, and race. People with NFG and BMI ≥27 kg/m 2 and PreDM and BMI ≥27 kg/m 2 had fairly comparable average BMI values. Baseline total cholesterol and HDL-C levels were comparable across the 4 groups. Baseline TG concentrations were highest in the PreDM and BMI ≥27 kg/m 2 group and lowest in people with NFG and BMI <27 kg/m 2 .
There were 939 incident cases (8.2%) of T2DM identified during the median follow-up of 4.9 years. Results in Figure 1 indicate that the incidence of T2DM was lowest in statin-treated patients with NFG and TG ≤1.7 mmol/l (2.8%), increasing progressively to 5.2%, 12.8%, and 22.8%, in those with only a TG concentration >1.7 mmol/l, with only PreDM, and with combined PreDM and a TG concentration >1.7 mmol/l, respectively.
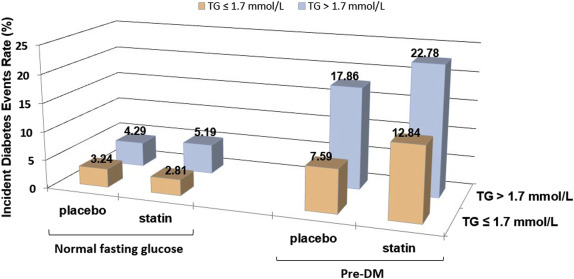
There was little or no increased risk of statin treatment in those with NFG compared to placebo. However, in those with PreDM, there was a substantial increased baseline risk for incident T2DM even with placebo treatment, for example, incident T2DM occurred in 7.6% of placebo-treated patients with PreDM and TG ≤1.7 mmol/l and 17.9% of placebo patients with PreDM and TG >1.7 mmol/l. Statin treatment markedly accentuated this risk in those with PreDM compared to placebo. For instance, 22.8% of subjects with PreDM and TG >1.7 mmol/l developed incident T2DM, a 27% increased risk versus those getting placebo therapy.
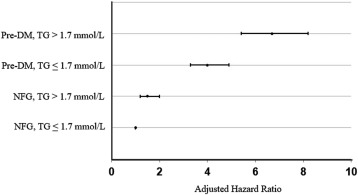
HRs in statin-treated subjects were calculated to evaluate the statistical significance of the findings in Figure 1 and are summarized in Figure 2 . Statin treatment in patients with either a TG concentration >1.7 mmol/L or PreDM or PreDM and TG concentration >1.7 mmol/l was associated with a significantly (p <0.001) greater HR for developing T2DM compared to those with NFG and TG ≤1.7 mmol/l. Furthermore, the HRs increased progressively (p <0.001), from those with only a high TG, to only PreDM, to the highest HR when both PreDM and TG >1.7 mmol/l were present at baseline (HRs [95% CIs] are 1.5 [1.2 to 2.0], 4.0 [3.3 to 4.9], and 6.7 [5.4 to 8.2], respectively).
Stay updated, free articles. Join our Telegram channel

Full access? Get Clinical Tree


