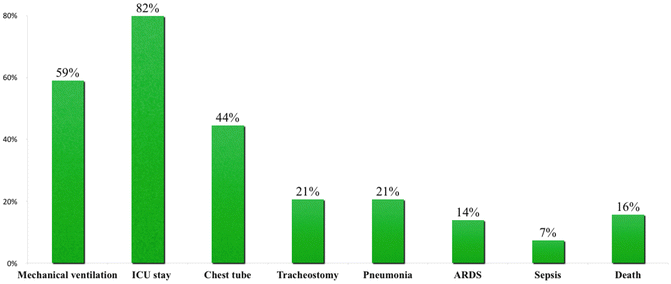
Fig. 14.1
Days on mechanical ventilation, ICU stay, and hospital stay for patients with flail chest injuries [8]
Table 14.1
Overall outcomes and complications associated with patients suffering from flail chest injuries
Outcomes | All patients | No severe head injury | With severe head injury | P value | No pulmonary contusion | With pulmonary contusion | P value | |||||
|---|---|---|---|---|---|---|---|---|---|---|---|---|
% | # | % | # | % | # | – | % | # | % | # | – | |
Number of patients | 100 % | 3,467 | 85 % | 2,944 | 15 % | 523 | 46 % | 1,587 | 54 % | 1,880 | ||
Resource utilization | ||||||||||||
Mechanical ventilation | 59 % | 1,762 | 54 % | 1,369 | 88 % | 393 | 0.00001 | 56 % | 778 | 61 % | 984 | 0.005 |
Mean day on mechanical ventilation | ||||||||||||
Ventilated patients only | 12.1 | ±11.0 | 12.0 | ±11.9 | 12.7 | ±12.1 | 0.60 | 12.4 | ±12.1 | 11.9 | ±11.9 | 0.91 |
All patients | 7.2 | ±12.0 | 6.5 | ±10.6 | 11.2 | ±12.1 | 0.001 | 7.0 | ±11.0 | 7.3 | ±11.0 | 0.016 |
ICU admission | 82 % | 2,767 | 81 % | 2,306 | 89 % | 461 | 0.00001 | 80 % | 1,229 | 84 % | ±1,538 | 0.003 |
Mean days in ICU | ||||||||||||
Patients admitted to ICU only | 11.7 | ±11.8 | 11.0 | ±11.6 | 15.0 | ±13.4 | 0.0001 | 11.5 | ±11.9 | 11.8 | ±12.1 | 0.242 |
All patients | 9.6 | ±12.0 | 8.9 | ±11.3 | 13.4 | ±13.5 | 0.001 | 9.2 | ±11.6 | 9.9 | ±11.9 | 0.0032 |
Days in hospital | 16.6 | ±16.0 | 15.8 | ±14.6 | 21.4 | ±21.7 | 0.0005 | 16.1 | ±15.6 | 17.1 | ±16.3 | 0.018 |
Complications | ||||||||||||
Chest tube | 44.5 % | 1,542 | 43.3 % | 1,276 | 50.9 % | 266 | 0.0014 | 41.8 % | 663
Stay updated, free articles. Join our Telegram channel
Full access? Get Clinical Tree
 Get Clinical Tree app for offline access

| |||
