The presence and degree of left ventricular (LV) dyssynchrony in patients with end-stage renal disease (ESRD) has not been well studied. We hypothesized that these patients would be more likely to have mechanical dyssynchrony than a control cohort. The indexes of LV mechanical dyssynchrony were measured by automated analysis of gated single photon emission computed tomography myocardial perfusion imaging in 290 patients with ESRD and 109 control patients. Only patients with normal myocardial perfusion imaging findings and a narrow QRS duration were included. The following variables were derived: LV ejection fraction (EF), volume, mass, and 2 indexes of dyssynchrony, the standard deviation and bandwidth. The standard deviation and bandwidth were significantly greater in those with ESRD (23° ± 13° vs 15° ± 6° and 65° ± 40° vs 42° ± 14°, respectively, p <0.001 for each). The LV volumes and LV mass were significantly lower and LVEF significantly greater in the control group than in the patients with ESRD (p <0.001 for each). The subgroup of 217 patients with ESRD and normal LVEF also had a significantly greater standard deviation and bandwidth than did the control group (21° ± 12° and 57° ± 35°, p <0.001 for each). However, their values were lower than those of the 73 patients with ESRD and a LVEF <50% (30° ± 13° and 90° ± 45°, p <0.001 for each). Finally, 25 patients (9%) with ESRD and none of the control group had a standard deviation >43° (p = 0.01). In conclusion, patients with ESRD had significantly more mechanical dyssynchrony than did the control group, even in absence of electrical dyssynchrony and abnormal LV perfusion or function.
The presence and degree of left ventricular (LV) dyssynchrony in patients with end-stage renal disease (ESRD) have not been well studied, because patients with ESRD have often been excluded from clinical trials of resynchronization therapy. The present study examined the prevalence of LV dyssynchrony in patients with ESRD with normal stress myocardial perfusion imaging (MPI) findings and a normal QRS duration (<120 ms) on the surface electrocardiogram, using a novel method of automated phase analysis of gated single photon emission computed tomography (SPECT) MPI. We hypothesized that mechanical dyssynchrony would be more likely to be abnormal in patients with ESRD than in a control group, even in the absence of left bundle branch block and abnormal LV function and perfusion.
Methods
The study population consisted of patients with ESRD who required dialysis and had been referred for stress MPI as a part of their renal transplant evaluation from December 2008 to August 2009. The patients were selected using the following inclusion criteria: (1) age >18 years, (2) normal perfusion according to the stress (exercise or pharmacologic)/at rest, gated SPECT MPI findings, and (3) a normal QRS duration (<120 ms) on the surface electrocardiogram recorded during the stress test. Patients with congenital heart disease, any perfusion defect (fixed or reversible), left bundle branch block, or ventricular pacing were excluded. Of the 536 patients with ESRD, 290 met the inclusion and exclusion criteria. The ejection fraction (EF) was normal in 217 patients (75%). The results were compared with those obtained from 109 consecutive patients with normal kidney function, normal MPI findings LVEF of ≥50%, and QRS <120 ms, who were studied during the same period and served as the control group. The demographics and other pertinent data were extracted by chart review.
Gated SPECT MPI was obtained at stress (exercise or pharmacologic) and at rest using technetium-99m sestamibi according to the American Society of Nuclear Cardiology guidelines and as previously described. The images were obtained with a “step and shoot” protocol, 180° elliptical orbit, 32 projections, and 30 seconds per projection. A dual-head detector gamma camera with a low-energy, high-resolution collimator and a 64 × 64 matrix was used. A window of 15% was centered on the 140-keV gamma peak, and the gating was done with 8 to 16 frames per RR cycle. Imaging was started 1 hour after tracer injection. Butterworth filtering, followed by filtered back projection reconstruction, was performed, and image interpretation was done without attenuation or scatter correction. All images were reviewed for quality control measures.
The LVEF, end-diastolic and end-systolic volumes, and LV mass were measured from the gated images at rest (because the study was usually done with a larger dose of 30 to 45 vs 10 to 15 mCi for the stress study), according to the method described by Germano et al.
The phase standard deviation and histogram bandwidth were measured, as previously described, and are summarized in brief. Three-dimensional count distributions were extracted from each of the LV short-axis data sets and submitted to Fourier phase analysis. The generated 3-dimensional phase distribution (0° to 360°) spanning the entire RR interval was displaced on a polar map and in a histogram ( Figure 1 ). The phase standard deviation represented the standard deviation of the phase distribution, and the histogram bandwidth represented the duration of the cardiac cycle during which 95% of the myocardium initiated contraction. The effective temporal resolution of this technique correlated to 1/64th of the cardiac cycle, with no significant effect on the phase standard deviation when 8 or 16 frames per cycle were applied.

A descriptive analysis was performed to examine the pertinent variables in the entire cohort of patients with ESRD and in those with a normal and depressed EF. The Student t test was used for continuous variables, and the Pearson chi-square test for categorical variables. Data are presented as the mean ± SD and median (twenty-fifth percentile, seventy-fifth percentile) for continuous variables and as percentages for categorical variables. All p values were 2-tailed, with p <0.05 set a priori and used as the level of significance. All statistical analyses were performed using the Statistical Package for Social Sciences, version 11.5, for Windows (SPSS, Chicago, Illinois).
The institutional review board at the University of Alabama at Birmingham approved the present study.
Results
The pertinent demographic data and other variables are listed in Table 1 . A total of 290 patients had ESRD (217 with a LVEF of ≥50% and 73 with a LVEF of <50%). Most had hypertension, and <5% had known coronary artery disease. More of the patients with ESRD and an EF <50% were men and had diabetes compared to those with ESRD and an EF of ≥50%.
| Variable | Controls (n = 109) | All ESRD (n = 290) | ESRD and EF≥50% (n = 217) | ESRD and EF<50% (n = 73) |
|---|---|---|---|---|
| Demographics | ||||
| Age (years) | 63 ± 12 ⁎ † | 54 ± 13 ⁎ | 54 ± 13 † | 54 ± 13 |
| Women | 57 (52%) | 132 (46%) | 110 (51%) ‡ | 22 (30%) ‡ |
| Black | 36 (33%) ⁎ † | 201 (69%) ⁎ | 14 (67%) † | 56 (77%) |
| Diabetes mellitus | 29 (27%) ⁎ § | 139 (48%) ⁎ | 96 (44%) ‡ § | 43 (57%) ‡ |
| Hypertension ¶ | 81 (74%) ⁎ † | 279 (96%) ⁎ | 206 (95%) † | 73 (100%) |
| Hyperlipidemia # | 48 (44%) | 127 (44%) | 93 (43%) | 34 (47%) |
| Atrial fibrillation | 11 (11%) † ⁎⁎ | 11 (4%) ⁎⁎ | 3 (1%)††† | 8 (11%) †† |
| Coronary artery disease ‡‡ | 7 (6%) | 14 (5%) | 9 (4%) | 5 (7%) |
| Peripheral vascular disease | 10 (9%) | 34 (12%) | 25 (12%) | 9 (12%) |
| Smokers | ||||
| Current | 15 (14%) | 54 (19%) | 33 (15%) ‡ | 21 (29%) ‡ |
| Former | 23 (21%) | 70 (24%) | 53 (24%) | 17 (23%) |
| Medications | ||||
| β Blockers | 42 (39%) ⁎ § | 176 (61%) ⁎ | 120 (55%) ‡ § | 56 (77%) ‡ |
| Angiotensin-converting enzyme/receptor blockers | 54 (50%) ⁎ § | 105 (36%) ⁎⁎ | 67 (31%) ‡ § | 38 (52%) ‡ |
| Calcium channel blockers | 42 (39%) § | 143 (49%) | 110 (51%) § | 33 (45%) |
| Diuretics | 59 (54%) ⁎ † | 62 (21%) ⁎ | 42 (19%) † | 20 (27%) |
| Statins | 40 (37%) | 94 (32%) | 70 (32%) | 24 (33%) |
| Electrocardiographic findings | ||||
| QRS (ms) | ||||
| Mean ± SD | 92 ± 22 | 91 ± 13 | 89 ± 12 †† | 95 ± 13 †† |
| Median (Q1, Q3) | 88 (80, 96) | 90 (82, 88) | 88 (80, 96) | 92 (86, 102) |
| QTc (ms) | ||||
| Mean ± SD | 439 ± 27 | 459 ± 33 | 455 ± 32 ‡ | 473 ± 71 ‡ |
| Median (Q1, Q3) | 439 (419, 454) | 459 (438, 481) | 453 (434, 478) | 470 (451, 487) |
⁎ p < 0.001 between control and ESRD group;
† p <0.001 between control group and ESRD with LVEF ≥50% group;
‡ p <0.05 between ESRD with LVEF <50% and ESRD with LVEF ≥50%;
§ p <0.05 between control group and ESRD with LVEF ≥50% group;
¶ Blood pressure ≥140/90 mm Hg or taking antihypertensive medications.
# Low-density lipoprotein greater than Adult Treatment Panel III goal or taking statins.
⁎⁎ p <0.05 between control and ESRD group;
†† p <0.001 between ESRD with LVEF <50% and ESRD with LVEF ≥50%.
The patients in the control group were more likely to be white and fewer had diabetes compared to the patients with ESRD.
The standard deviation and histogram bandwidth are displayed in Figures 2 and 3 . The standard deviation and bandwidth of the patients with ESRD were significantly greater than those of the control group (23° ± 13° vs 15° ± 6° and 65° ± 40° vs 42° ± 14°, respectively, p <0.001 for each), but the QRS duration was not. The patients with ESRD and normal LVEF also had a greater standard deviation and bandwidth than the control group (21° ± 12° and 57° ± 35°, p <0.001 for each) but lower than the group with ESRD and a LVEF <50% (30° ± 13° and 90° ± 45°, respectively, p <0.001 for each).
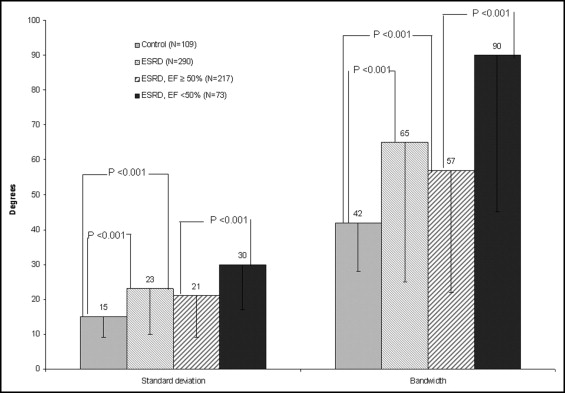

Using a phase standard deviation of 43° (cutoff value for mechanical dyssynchrony described by Henneman et al ), 25 patients with ESRD (12 with a normal and 13 with an abnormal EF) and none in the control group (9% vs 0%, p = 0.01) had a standard deviation of ≥43°.
The LV volumes, LV mass, and LVEF are listed in Tables 2 and 3 . The control group had significantly smaller LV volumes, lower LV mass, and greater LVEF than the entire cohort of patients with ESRD (p <0.001) and to the subgroup with an EF of ≥50% (p <0.001 for LV volumes and mass, p <0.05 for EF). Patients with ESRD and a standard deviation of ≥43° had significantly more dilated and hypertrophied left ventricles and a lower EF than did patients with ESRD with a standard deviation <43° and the control group (p <0.001).
| Controls (n = 109) | All ESRD (n = 290) | ESRD and EF ≥50% (n = 217) | ESRD and EF <50% (n = 73) | |
|---|---|---|---|---|
| Left ventricular end-diastolic volume (ml) | ||||
| Mean ± SD | 110 ± 41 ⁎ † | 165 ± 67 ⁎ | 145 ± 49 † ‡ | 224 ± 79 ‡ |
| Median (Q1, Q3) | 108 (81, 132) | 153 (115, 199) | 137 (108, 176) | 217 (67, 269) |
| Left ventricular end-systolic volume (ml) | ||||
| Mean ± SD | 28 ± 17 ⁎ † | 64 ± 48 ⁎ | 46 ± 26 † ‡ | 116 ± 61 ‡ |
| Median (Q1, Q3) | 25 (16, 35) | 53 (30, 81) | 41 (27, 61) | 100 (80, 137) |
| Left ventricular mass (g) | ||||
| Mean ± SD | 137 ± 30 ⁎ † | 172 ± 42 ⁎ | 159 ± 34 † ‡ | 209 ± 43 ‡ |
| Median (Q1, Q3) | 138 (115, 156) | 167 (142, 200) | 157 (136, 181) | 207 (179, 231) |
| Left ventricular ejection fraction (%) | ||||
| Mean ± SD | 66 ± 10 ⁎ § | 57 ± 13 ⁎ | 63 ± 9 ‡ § | 41 ± 8 ‡ |
| Median (Q1, Q3) | 67 (58, 63) | 58 (49, 66) | 61 (56, 68) | 44 (40, 47) |
Stay updated, free articles. Join our Telegram channel

Full access? Get Clinical Tree


