Different pathophysiologic pathways in the development of left ventricular (LV) hypertrophy can be reflected in phenotypical differences. A total of 119 subjects (39 with hypertension [HTN]; 43 with nonobstructive hypertrophic cardiomyopathy [HC], and 37 control subjects) underwent a standardized cardiac magnetic resonance imaging protocol for assessment of global and regional morphology and function using balanced steady-state free precession sequences and late gadolinium enhancement studies. Compared to controls, both hypertrophic groups had significantly greater maximal wall thickness and LV mass index (p <0.01). The patients with HTN had reduced ejection fraction, increased heart cavities, and increased LV wall stress (p <0.01). The HC group had supernormal ejection fraction and reduced LV wall stress (p <0.01). The HTN group had reduced anteroseptal systolic strains (p <0.02), and the HC group displayed a marked decrease in longitudinal systolic strain (p <0.01). In the HC group, an inverse relation was seen between a globally increased late gadolinium enhancement score and the ejection fraction (r = −0.5, p = 0.01), and between regional late gadolinium enhancement scores and regional systolic strain in the inferoseptal segments. Increased LV wall stress was identified as the hallmark of HTN (odds ratio 1.2, p = 0.002), while HC was best characterized by reduced total longitudinal strain (odds ratio 1.3, p = 0.002). In conclusion, our findings indicate the presence of distinctive hypertrophic phenotypes detectable by means of multiparametric magnetic resonance imaging. In HTN, impaired deformation follows the distribution of LV wall stress. On the contrary, HC is characterized by reduced global and regional deformation, in association with fibrosis.
A hypertrophic phenotype, a feature of many cardiovascular disorders, is a recognized independent risk factor for cardiac-related morbidity and mortality. Left ventricular (LV) hypertrophy develops from diverse factors, including mechanical stress, growth factors, cytokines, catecholamines, and primary genetic abnormalities. Arterial hypertension (HTN) is the most common cause of pathologic LV hypertrophy. Increased blood pressure accentuates hypertrophic remodeling through increase in LV wall stress. Increased LV wall thickness (LVWT) in the absence of an apparent physiologic increase in LV wall stress, such as in hypertrophic cardiomyopathy (HC), occurs in 1 per 500 persons in the general population. Primarily a diverse genetic disorder of the myocardium caused by mutation in 1 of 11 sarcomere protein genes, it might be possible to consider HC as a single phenotypical entity, assuming that known disease genes affect the cardiac muscle sarcomere. In the present study, we investigated whether apparently different pathophysiologic pathways in the development of LV hypertrophy might be reflected in the phenotypical differences, discernable by means of multiparametric cardiac magnetic resonance imaging.
Methods
This was an observational study of a population of adult subjects (>16 years old) who had consecutively presented to the German Heart Institute (Berlin, Germany) by routine clinical referral for cardiac investigations. All subjects underwent a routine clinical examination, 12-lead electrocardiography, 24-hour blood pressure monitoring, and transthoracic echocardiography (data presented in supplementary material ). The exclusion criteria were known contraindications to a magnetic resonance imaging study (incompatible implants, claustrophobia, and body mass index >40 kg/m 2 ), or significant valvular heart disease or subaortic gradients at rest). The study was conducted in accordance with the institutional review board at the Charité University School of Medicine, and all participants provided written informed consent. The diagnosis of HC was determined by the demonstration of a hypertrophied left ventricle associated with a nondilated and hyperdynamic left ventricle in the absence of increased LV wall stress or another cardiac or systemic disease that could result in a similar magnitude of hypertrophy. All patients with HC had an expressed phenotype, typically asymmetric in distribution, permitting an unequivocal clinical diagnosis. Endomyocardial biopsy or genetic testing was not used to reach the diagnosis. The HTN group consisted of patients with evidence of treated essential HTN (systolic blood pressure of ≥140 mm Hg, diastolic blood pressure of ≥95 mm Hg) and increased LV mass index on the magnetic resonance imaging study, defined as >89 g/m 2 in men and >73 g/m 2 in women, in the absence of secondary causes for elevated blood pressure that might lead to LV hypertrophy, such as a personal or family history of HC or sudden death. Normotensive subjects, matched for age, gender, and body mass index, with a normal LV mass index (≤89 g/m 2 for men and ≤73 g/m 2 for women) and no evidence of antihypertensive medication were included as controls. The presence or absence of cholesterol-lowering medications was not used as selection criterion.
All participants underwent standardized cardiac magnetic resonance imaging protocol (1.5 Tesla magnetic resonance imaging Achieva, Philips Medical Systems, Best, The Netherlands), with subjects in the supine position and a 5-element-phased-array cardiac coil. All subjects were in sinus rhythm to allow accurate triggering and good quality of image acquisition. Preparation scans included a breath held general survey and 2 rapid heart axis survey scans (pseudoright anterior oblique- and pseudo-4 chamber views). Volumetric cavity assessment was obtained by whole heart coverage of gapless short-axis slices using a balanced steady-state free precession sequence (echo time/repetition time/flip angle 1.7 ms/3.4 ms/60°, spatial resolution 1.8 × 1.8 × 8 mm, 50 heart phases) with typically 10 to 14 heart beats used for image acquisition. Late gadolinium enhancement (LGE) was performed using a diastolic triggered inversion prepared 3-dimensional spoiled gradient echo sequence (echo time/repetition time/flip angle 1.7 ms/3.5 ms/15°, spatial resolution 1.8 × 2 × 10 mm reconstructed to 1.8 × 1.8 × 5 mm, with a patient-adapted prepulse delay), 10 minutes after contrast injection (gadolinium-diethylene triamine pentaacetic acid, dose 0.2 mmol/kg body weight).
All image analysis was performed using a commercially available postprocessing software (ViewForum, version 5.1, Philips Medical Systems). The endocardial LV borders were manually traced at end-diastole and end-systole. The papillary muscles were included as part of the LV cavity volume. The LV end-diastolic volume and end-systolic volume were determined using a summation of disks (“Simpson’s rule”) method. Ejection fraction was computed as the end-diastolic volume minus the end-systolic volume and then divided by the end-diastolic volume. The LV epicardial borders were also traced on the end-diastolic images, with the LV mass calculated as the end-diastolic myocardial volume (i.e., epicardial − endocardial volumes) multiplied by the myocardial density (1.05 g/ml) and the index to the body surface area. The LV end-systolic meridional wall stress was calculated as 0.334 × LV pressure × LVs/PWs (1 + PWs/LVs), where LV pressure was the brachial systolic pressure, LVs the systolic left ventricular diameter, and PWs the systolic posterior wall thickness. Indexes were normalized to the individual body surface area [body surface area = (weight in kilograms × 0.425 × height in meters × 0.725) × 0.007184]. The maximum and regional LV wall thicknesses (LVWTs) were obtained in 3 short-axis slices (basal, equatorial, and apical) using a 16-segment analysis model. Maximum LVWT was defined as the greatest thickness in the LV in any single segment at end-diastole. For each segment, the end-diastolic and end-systolic LVWTs and the end-diastolic to end-systolic wall thickening were calculated. End-systolic strain is the segment thickening/shortening normalized for the initial (end-diastolic) length of the segment. Radial end-systolic strain was calculated as a percentage of radial segment thickening in 3 short-axis views, as validated by others. Systolic shortening of the LV walls relative to its diastolic length in 2-, 3- and 4-chamber views yielded a measure of the longitudinal deformation. Averaged values per slice for all 3 short-axis slices produced the apical, equatorial, basal, and total radial strain, and averaged values of 6 LV walls provided the total longitudinal strain. The overall reproducibility for radial strain had an intraobserver mean difference of 0.13 ± 0.25% and coefficient of variability of 6.3% and an interobserver mean difference of 0.12 ± 0.19% and coefficient of variability of 6.6%. For longitudinal strain, the data showed an intraobserver mean difference of 0.11 ± 0.22% and median coefficient of variability of 5.6% and interobserver mean difference of 0.17 ± 0.26% and coefficient of variability of 8.4%.
The LGE images were visually examined for the presence of regional fibrosis. Quantitative analysis of the LGE images was performed as previously described. The LGE score was defined as (percentage of the enhanced volume = enhanced volume/nonenhanced volume) with manual selection of the normal area, appearing as maximally suppressed myocardium anywhere within the 3-dimensional volume. To avoid confounding for artifacts, a conservative threshold level was used at 6 SDs from the normal area. In assessment of global LGE score, the total LV volume was included; the regional/radial cross-referencing was performed within the corresponding 3 short-axis slices. Coronary artery disease can represent an important confounding factor in the interpretation of the LGE results (ischemic scar vs regional fibrosis) ; therefore, only subjects with no significant coronary artery disease (defined as ≥70% luminal diameter reduction) in the 3 large epicardial coronary arteries and their major branches (i.e., vessel diameter of ≥2.0 mm) were included in the present study. All angiograms were performed for clinical evaluation and interpreted by highly experienced invasive cardiologists who were unaware of the magnetic resonance imaging data.
Statistical analysis was performed using the Statistical Package for Social Sciences software, version 15.0 (SPSS, Chicago, Illinois). Departures from normality were detected using the Kolmogorov-Smirnov statistic. Differences between the groups were analyzed using one-way analysis of variance with Bonferroni’s post hoc test. Associations were explored using the Pearson or Spearman correlation, as appropriate for the type of data, and binary logistic regression analysis with stepwise selection of predictive variables. Multivariate linear models were used to assess whether associations were maintained after adjusting for age, gender, cardiovascular risk factors, and hemodynamic parameters. All tests were 2-tailed, and p <0.05 was considered significant.
Results
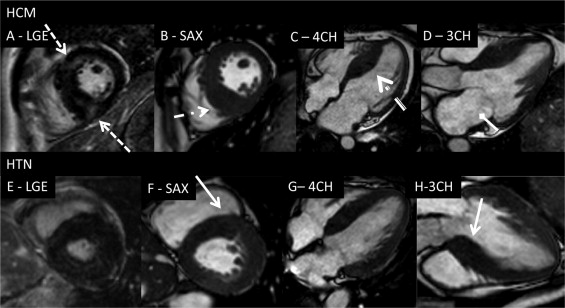
The 3 groups were similar in terms of gender, age, and body mass index ( Table 1 ). Systolic and diastolic blood pressure was significantly elevated in the HTN group. HC group used more amiodarone (11% vs 8%, p <0.01) and verapamil (6% vs 1%, p <0.01). β Blockers (11% vs 9%, p = NS) and renin-angotensin system blockers (29% vs 0%, p <0.01) predominated in the HTN group. One third of all subjects took statins, equally distributed among the 3 groups. Compared to controls, the patients with HTN had reduced ejection fraction, larger end-diastolic volume, and increased LV wall stress. The HC group was characterized by supernormal ejection fraction, smaller end-systolic volume, and reduced LV wall stress compared to the controls ( Table 1 ). Both hypertrophic groups exhibited greater maximum LVWT, LV mass index, and enlarged left atria. Overall, the LVWTs were markedly increased in both hypertrophic groups (controls vs HC, p <0.001; controls vs HTN, p <0.05). Morphologically, the HC group had greater LVWT in the inferoseptal/inferior segments than the HTN group (segment 3, 19 ± 5 mm vs 12 ± 4 mm; segment 4, 17 ± 5 mm vs 11 ± 4 mm; segment 9, 15 ± 5 mm vs 10 ± 4 mm [p = 0.01]; and segment 10, 15 ± 5 mm vs 10 ± 5 mm [p = 0.05], respectively). In contrast, the HTN group had a greater LVWT in the anteroseptal segments (segment 2, 13 ± 4 mm vs 11 ± 4 mm [p = 0.03]; segment 8, 10 ± 4 mm vs 12 ± 4 mm [p = 0.07]; Figure 1 ). HC group displayed significantly thicker inferoseptal segments in the equatorial and basal levels compared to the HTN group. Both hypertrophic groups had reduced global strain and total radial strain ( Table 2 ). The reduced total longitudinal strain was the hallmark of the HC group (p = 0.01), and although heterogeneously reduced longitudinal values were present in all walls, the difference compared to the controls was most manifest in the inferoseptal wall (p = 0.001). Compared to controls, the longitudinal function remained preserved in the HTN group, apart from the reduction in anteroseptal region (p = 0.02). Radial strain in the HTN group decreased from the apex to base, while in the HC group appeared uniformly impaired.
| Variable | Controls (n = 37) | HC (n = 43) | HTN (n = 39) | p Value |
|---|---|---|---|---|
| Age (years) | 49 ± 10 | 53 ± 15 | 55 ± 8 | 0.31 |
| Men (n) | 20 (61%) | 25 (60%) | 14 (67%) | 0.89 |
| Systolic blood pressure (mm Hg) | 121 ± 11 | 119 ± 9 | 165 ± 25 | 0.01 ⁎ † |
| Diastolic blood pressure (mm Hg) | 79 ± 9 | 76 ± 8 | 95 ± 20 | 0.01 ⁎ |
| Heart rate (beats/min) | 70 ± 14 | 67 ± 12 | 71 ± 13 | 0.65 |
| Body mass index (kg/m 2 ) | 25 ± 4 | 27 ± 5 | 26 ± 4 | 0.71 |
| Ejection fraction (%) | 57 ± 10 | 68 ± 8 | 54 ± 8 | 0.01 † ‡ |
| End-diastolic volume (ml) | 131 ± 29 | 125 ± 19 | 140 ± 42 | 0.03 ⁎ |
| End-systolic volume (ml) | 65 ± 24 | 51 ± 18 | 62 ± 28 | 0.04 † ‡ |
| Stroke volume (ml) | 67 ± 13 | 74 ± 22 | 80 ± 25 | 0.05 ‡ |
| Cardiac output (L/min) | 4.6 ± 1 | 4.8 ± 2 | 4.9 ± 1 | 0.21 |
| Left atrium area (cm 2 ) | 25 ± 5 | 32 ± 9 | 27 ± 6 | 0.001 † ‡ |
| Right atrium area (cm 2 ) | 23 ± 5 | 25 ± 6 | 23 ± 4 | 0.39 |
| Maximal left ventricular wall thickness (mm) | 12 ± 4 | 25 ± 5 | 22 ± 3 | 0.01 ⁎ ‡ |
| Left ventricular wall stress (dynes/cm 2 ) | 125 ± 33 | 102 ± 35 | 132 ± 22 | 0.004 † ‡ |
| Left ventricular mass index (g/m 2 ) | 95 ± 23 | 135 ± 27 | 128 ± 17 | 0.01 † ‡ |
| Strain (%) | Controls (n = 37) | HC (n = 43) | HTN (n = 39) | p Value |
|---|---|---|---|---|
| Radial | ||||
| Total | 21 ± 9 | 16 ± 14 | 18 ± 8 | 0.03 ⁎ |
| Apical | 23 ± 13 | 17 ± 8 | 19 ± 11 | 0.2 |
| Equatorial | 21 ± 10 | 15 ± 8 | 16 ± 11 | 0.04 ⁎ † |
| Basal | 18 ± 7 | 15 ± 8 | 15 ± 8 | 0.03 ⁎ † |
| Longitudinal | ||||
| Total | 19 ± 3 | 15 ± 5 | 19 ± 4 | 0.01 ⁎ ‡ |
| Anterior | 19 ± 5 | 15 ± 6 | 18 ± 6 | 0.5 |
| Anteroseptal | 20 ± 6 | 16 ± 8 | 17 ± 7 | 0.04 ⁎ † |
| Inferoseptal | 19 ± 5 | 14 ± 6 | 20 ± 7.2 | 0.01 ⁎ ‡ |
| Inferior | 19 ± 4 | 15 ± 7 | 18 ± 6 | 0.02 ⁎ ‡ |
| Inferolateral | 20 ± 6 | 15 ± 8 | 20 ± 7 | 0.04 ⁎ ‡ |
| Anterolateral | 21 ± 9 | 15 ± 6 | 20 ± 6 | 0.03 ⁎ ‡ |
| Right ventricle free wall | 27 ± 6 | 26 ± 6 | 27 ± 9 | 0.7 |
| Global strain | 21 ± 6 | 15 ± 8 | 17 ± 5 | 0.001 ⁎ † |
Stay updated, free articles. Join our Telegram channel

Full access? Get Clinical Tree


