We assessed the left ventricular (LV) contractile reserve in young adults with repaired coarctation of the aorta and interrupted aortic arch by determination of LV force-frequency relation (FFR). Eighteen (7 men) patients aged 24.2 ± 5.4 years and 20 (9 men) healthy controls were studied. Blood pressures in the right arm were measured by oscillometry. Transmitral early (E) and late (A) diastolic velocities, tissue Doppler–derived mitral annular systolic (s m ), early diastolic (e m ) and late diastolic (a m ) velocities, and myocardial isovolumic acceleration (IVA) were measured. The LV FFR and average slope were derived from the IVA measured at different heart rates during supine bicycle exercise. Blood pressures at rest were similar between patients and controls (all p >0.05). At baseline, patients compared with controls had significantly greater E velocity, E/A and E/e m ratios, and lower s m and e m velocities (all p <0.05) but similar IVA (p = 0.18). At submaximal exercise, diastolic (p = 0.001) and mean (p = 0.003) blood pressures became significantly higher in patients than controls, s m (p = 0.001) and e m (p <0.001) velocities remained reduced, whereas the IVA became lower (p <0.001). The weighted average FFR was flattened (p <0.001), and average FFR slope was lower (p <0.001) in patients compared with controls. The average FFR slope correlated negatively with the magnitude of exercise-induced increase in systolic (r = −0.32, p = 0.050), mean (r = −0.41, p = 0.011), and diastolic (r = −0.40, p = 0.013) blood pressures. In conclusion, young adults after coarctation of the aorta and interrupted aortic arch repair exhibit reduced LV contractile reserve, which is related to the blood pressure response during exercise stress.
Late cardiovascular outcomes after repair of coarctation of the aorta (CoA) and interrupted aortic arch (IAA) remain to be issues of concern. Exercise-induced hypertension and reduced exercise performance in these patients are well documented. Despite being normotensive at rest, about 1/3 of patients with repaired CoA exhibited exaggeration of blood pressure response during exercise, whereas >3/4 had subnormal exercise capacity. Increased arterial afterload during exercise may potentially affect left ventricular (LV) performance, thereby limiting the exercise capacity in these patients. Left ventricular contractile reserve during stress has been shown to be an important predictor of exercise capacity in patients with systemic hypertension and in those after prosthetic valve replacement for aortic stenosis and mitral regurgitation. Assessment of LV contractile reserve with derivation of force-frequency relation (FFR), an intrinsic regulatory mechanism of cardiac contractility, in the clinical setting has been simplified using noninvasive tissue Doppler tracking of changes in myocardial isovolumic acceleration (IVA) as heart rate increases during exercise stress. In the present study, we assessed FFR in adolescents and young adults after repair of CoA and IAA and explored its associations with changes in systemic blood pressure during exercise stress.
Methods
Eighteen patients who have undergone repair for CoA or IAA were recruited from the congenital heart clinic. Exclusion criteria included patients with significant residual coarctation defined as a systolic pressure gradient >20 mm Hg by Doppler interrogation and those with complex associated cardiac lesions other than simple left-to-right shunts and/or a competent, nonstenotic bicuspid aortic valve. The following data were retrieved from the case notes: associated cardiac lesions, age at and type of interventions, and the need for reinterventions. Twenty healthy subjects, including staff volunteers and healthy siblings of patients with no documented history of cardiovascular diseases, were recruited as controls.
The weight and height were measured, and body mass index and body surface area were derived accordingly. Blood pressure in the right arm was measured using an automated oscillometric device (Dinamap; Critikon, Tampa, Florida). The mean blood pressure (MBP) was calculated as (2 × DBP + SBP)/3], where DBP and SBP are diastolic and systolic blood pressures, respectively. This study was approved by the Institutional Review Board of the University of Hong Kong/Hospital Authority West Cluster, Hong Kong. All adult subjects and parents of minors gave written informed consent.
Exercise testing was performed using a bicycle ergometer (Semi-couch Safety Ergometer; Ergosana Schiller, Swabian Alb, Germany). To facilitate echocardiographic assessment, the bicycle ergometer was adjusted to a semirecumbent and left lateral decubitus position. The initial workload was 25 W, followed by stepwise increase of workload of 25 W after every 2-minute interval until a maximum of 150 W. Exercise was terminated when the heart rate reaches ≥70% the target heart rate (220 per minute minus age) or exhaustion. The blood pressure was also measured every 2 minutes during exercise. A submaximal exercise protocol was adopted because of the subnormal exercise capacity and chronotropic incompetence reported in patients with repaired CoA.
Echocardiographic examinations were performed using Vivid 7 ultrasound machine (GE Medical Systems, Horten, Norway). Acquisitions were stored in digital disc for offline analyses using EchoPAC software (GE Medical Systems). The average values of the echocardiographic parameters derived from 3 cardiac cycles were used for statistical analyses. From the apical 4-chamber view, transmitral pulsewave Doppler examination was performed for the measurement of early (E) and late (A) inflow velocities and E deceleration time. Color tissue Doppler imaging was then performed with frame rates >100 Hz. With the sample volume positioned at the LV free wall-mitral annular junction, the systolic (s m ), early diastolic (e m ), and late diastolic (a m ) myocardial annular velocities were measured. The E/e m ratio was calculated as an estimate of LV filling pressure. Myocardial acceleration during isovolumic contraction was determined as reported previously.
During bicycle ergometry, color tissue Doppler images were recorded intermittently with every 10 to 15 beats/min increase in heart rate. At least 10 cardiac cycles were recorded. The sampling area was adjusted during exercise to provide the best alignment for Doppler interrogation, most commonly with movement downward along the LV free wall toward the apex from its initial position. The average of 5 IVA measurements was obtained at each heart rate. FFR curves were generated by plotting IVA against the heart rate at different stages of exercise. The average FFR slope was calculated as (change in IVA from baseline to submaximal exercise)/(change in heart rate from baseline to submaximal exercise). At target heart rate, s m and e m were measured again.
Results are presented as mean ± SD. Demographic variables and echocardiographic parameters of patients and controls were compared using unpaired Student’s t test. Smooth curve fitting was applied to individual FFR to estimate the weighted average FFR in patients and controls. The 95% confidence interval of IVA variation with heart rate was determined from the controls. For the whole cohort, Pearson correlation analysis was used to explore associations between FFR slope and demographic and blood pressure parameters. Statistical analyses were performed with SPSS, version 16.0 (SPSS Inc., Chicago, Illinois). A p value <0.05 was considered statistically significant.
Results
Of the 18 patients, 15 had CoA and 3 had IAA. They received initial treatment at 3.0 ± 3.9 years and were studied at 21.2 ± 3.8 years. Nine patients underwent balloon angioplasty as the initial procedure, whereas 9 had surgical repair. Thirteen patients required further balloon angioplasties after initial intervention, one of whom eventually required the placement of a stent. Seven patients had ligation of patent ductus arteriosus, 5 patients had closure of ventricular septal defect, and 1 patient had closure of atrial septal defect. Bicuspid aortic valve was present in 6 patients, whereas a thin unobstructive subaortic membrane was present in 1. One patient was receiving atenolol and enalapril at the time of study.
Table 1 lists the demographic data and blood pressures of patients and controls. There were no significant differences in physical parameters and blood pressure at rest between the 2 groups (all p >0.05).
Variable | Patients (n = 18) | Controls (n = 20) | p |
|---|---|---|---|
| Age (years) | 24.2 ± 5.4 | 22.0 ± 6.9 | 0.28 |
| Male/Female | 7/11 | 9/11 | 0.71 |
| Height (cm) | 162.0 ± 10.8 | 164.6 ± 9.8 | 0.45 |
| Weight (kg) | 56.2 ± 13.2 | 57.3 ± 13.0 | 0.81 |
| Body mass index (kg/m 2 ) | 21.2 ± 3.0 | 21.0 ± 3.6 | 0.83 |
| Body surface area (m 2 ) | 1.6 ± 0.2 | 1.6 ± 0.2 | 0.67 |
| Resting systolic blood pressure (mm Hg) | 114 ± 12 | 116 ± 11 | 0.62 |
| Resting diastolic blood pressure (mm Hg) | 67 ± 8 | 68 ± 9 | 0.84 |
| Resting mean blood pressure (mm Hg) | 83 ± 7 | 84 ± 9 | 0.70 |
| Resting heart rate (/min) | 67 ± 12 | 71 ± 9 | 0.26 |
Table 2 lists the baseline Doppler echocardiographic findings. For transmitral Doppler inflow indices, patients had significantly greater E velocity (p <0.001) and E/A ratio (p = 0.018) than controls. Tissue Doppler imaging demonstrated significantly lower s m (p = 0.001), e m (p = 0.001), and a m (p = 0.028) velocities in patients compared with controls. The E/e m ratio was, hence, significantly greater in patients than controls (p <0.001).
| Patients (n = 18) | Controls (n = 20) | p | |
|---|---|---|---|
| Mitral Doppler inflow indices | |||
| E (cm/s) | 99.8 ± 17.1 | 77.5 ± 13.4 | <0.001 ∗ |
| A (cm/s) | 52.2 ± 12.5 | 48.5 ± 9.4 | 0.32 |
| E/A | 2.0 ± 0.6 | 1.6 ± 0.3 | 0.018 ∗ |
| E deceleration time (ms) | 113.8 ± 39.1 | 117.5 ± 22.8 | 0.73 |
| Mitral annular tissue velocities | |||
| s m (cm/s) | 6.7 ± 1.9 | 8.7 ± 1.5 | 0.001 ∗ |
| e m (cm/s) | 9.2 ± 2.4 | 12.1 ± 2.6 | 0.001 ∗ |
| a m (cm/s) | 4.7 ± 1.2 | 5.6 ± 1.1 | 0.028 ∗ |
| e m /a m | 1.7 ± 1.3 | 2.3 ± 0.5 | 0.10 |
| E/e m | 11.6 ± 4.9 | 6.6 ± 2.1 | <0.001 ∗ |
| IVA (m/s 2 ) | 0.95 ± 0.27 | 1.10 ± 0.37 | 0.18 |
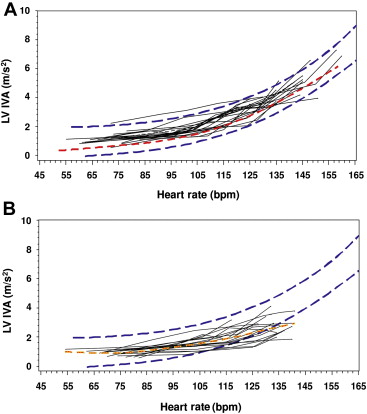
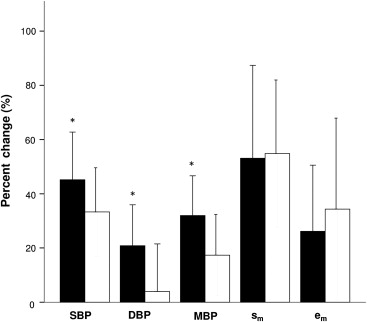
Table 3 lists the findings at submaximal exercise. Compared with controls, patients had significantly greater MBP (p = 0.001) and DBP (p = 0.003). Tissue Doppler imaging revealed significantly lower s m (p = 0.001) and e m (p <0.001) velocities. Whereas IVA at rest was similar between patients and controls ( Table 2 ), IVA became significantly lower in patients (p <0.001) at submaximal exercise ( Figure 1 ). There were no significant correlations between blood pressures at rest and IVA in both patients and controls (all p >0.05). Although the percent change in IVA from baseline to submaximal exercise was significantly lower in patients than controls (203 ± 71% vs 374 ± 177%, p = 0.002), the percent change in SBP (p = 0.042), MBP (p = 0.035), and DBP (p = 0.035) was significantly greater in patients ( Figure 2 ).
| Patients (n = 18) | Controls (n = 20) | p | |
|---|---|---|---|
| Systolic blood pressure (mm Hg) | 166 ± 23 | 154 ± 17 | 0.09 |
| Diastolic blood pressure (mm Hg) | 81 ± 10 | 70 ± 9 | 0.001 ∗ |
| Mean blood pressure (mm Hg) | 109 ± 12 | 98 ± 10 | 0.003 ∗ |
| Heart rate (/min) | 134 ± 5 | 142 ± 9 | 0.001 ∗ |
| s m (cm/s) | 10.1 ± 2.7 | 13.4 ± 2.7 | 0.001 ∗ |
| e m (cm/s) | 11.3 ± 2.3 | 15.7 ± 2.6 | <0.001 ∗ |
| IVA (m/s 2 ) | 2.77 ± 0.59 | 4.81 ± 1.12 | <0.001 ∗ |

The heart rate achieved during bicycle stress was significantly lower in patients than controls (134 ± 5 vs 142 ± 9, p = 0.001), although their heart rate at rest was similar (p = 0.26, Table 1 ). Individual FFR curves in patients and controls with the 95% confidence interval derived from control cohort are shown in Figure 3 . The weighted average FFR was flattened (p <0.001) in patients compared with controls. Average FFR slope was significantly lower in patients than controls (0.032 ± 0.01 m/s 2 beats/min vs 0.053 ± 0.012 m/s 2 beats/min, p <0.001). Correlation analysis revealed that the average FFR slope correlated negatively with the magnitude of exercise-induced increase in SBP (r = −0.32, p = 0.050), MBP (r = −0.41, p = 0.011), and DBP (−0.40, p = 0.013) ( Figure 4 ).