where SF = shortening fraction, LVEDD = left ventricular end-diastolic dimension, and LVESD = left ventricular end-systolic dimension. Normal values vary with age and range from 35–45 % in infants to 28–44 % in adolescents and adults [4, 5].
22.3.2 Two-Dimensional Imaging
Two-dimensional imaging provides an arc of imaging planes by employing multiple ultrasound beams to provide cross-sectional views of the heart. Currently, two-dimensional imaging provides the majority of information about cardiac structure and function in routine clinical studies. Two-dimensional imaging requires the presence of multiple beams of ultrasound interrogation in a single transducer, and several types of transducers are available to achieve this. Transducers available for two-dimensional imaging include mechanical (a sweeping or rotating ultrasound beam), phased array (multiple independently controlled sources), and linear array (a line of crystals simultaneously generating a beam of ultrasound). Today, phased array transducers are most commonly used due to their: (1) small size, (2) ability to provide simultaneous two-dimensional and M-mode or Doppler imaging, and (3) improved control of focal length for more uniform images throughout the field of view [6]. In addition to using two-dimensional imaging for viewing anatomic detail, left ventricular function can be quantitated using this mode by estimating left ventricular ejection fractions. This method, which has been shown to correlate well with angiographic estimates of ventricular function, takes advantage of the conical shape of the left ventricle to estimate end-diastolic and end-systolic ventricular volumes from tracings of two-dimensional images using Simpson’s biplane rule [3]. The ejection fraction is calculated as follows:
 where EF = ejection fraction, LVEDV = left ventricular end-diastolic volume, and LVESV = left ventricular end-systolic volume.

Normal values for ejection fractions are approximately 55–65%, and cardiac outputs can be estimated by multiplying the volume ejected with each beat (stroke volume) by the heart rate, using the equation:
 where CO = cardiac output, HR = heart rate, and SV = stroke volume.

22.3.3 Doppler Ultrasound
The Doppler Principle , described by Christian Johann Doppler in 1843, states that the frequency of transmitted sound is altered when the source of the sound is moving [2]. The classic example is the change in pitch of a train whistle as it moves, getting higher as it approaches the receiver and lower as it moves away from it. This change in frequency, or Doppler shift, also occurs when the source of sound is stationary and the waves are reflected off a moving target, including red blood cells in the vasculature. The shift in frequency is related to the velocity of the moving target, as well as the angle of incidence, and is described by the equation:
 where F d = observed Doppler frequency shift, f 0 = transmitted frequency, C = velocity of sound in human tissue at 37°C (approximately 1560 m/s), V = blood flow velocity, and ϕ = the intercept angle between the ultrasound beam and the blood flow. Using this principle, Doppler ultrasound can be used to noninvasively estimate the velocity of blood flow in the human heart and vasculature. Using a modified Bernoulli equation where pressure drop is equal to four times the velocity squared (4 V2), Doppler ultrasound can also be used to estimate chamber pressures and gradients and to provide significant noninvasive hemodynamic data.

22.3.4 Continuous Wave Doppler
Continuous wave Doppler is performed by using a single transducer with two separate elements for transmission and reception of sound waves, so that there is continuous monitoring of the Doppler shift. This technique enables detection of very high-velocity blood flow, but does not allow localization of the site of velocity shift along the line of interrogation [1].
22.3.5 Pulse Wave Doppler
Pulse wave Doppler uses bursts of ultrasound alternating with pauses to detect Doppler shift in a localized region. The timing between the generation of the ultrasound wave and detection of the reflected wave determines the depth of interrogation. Pulse wave Doppler is useful to measure velocity changes in a region defined by two-dimensional echocardiography, however, the spatial resolution limits the velocity shifts detected. In general, the maximal velocity shift detectable is one half of the Doppler sampling rate (pulse repetition frequency or PRF) and is designated the Nyquist limit [1]. The maximal sampling rate is determined by the distance of the sampling site from the transducer and the transducer frequency, so that sampling from a transducer position nearer to the region to be interrogated and using a lower frequency transducer will improve the detection and localization of higher velocity flow [1].
22.3.6 Color Doppler Flow Mapping
Color Doppler flow mapping uses the principles of pulsed Doppler to examine multiple points along the scan lines. The mean velocity and direction of these signals are calculated and then displayed and superimposed upon a two-dimensional image. By convention, flow directed toward the transducer is red, and flow directed away from the transducer is blue. Accelerated or turbulent flow is given a different color, typically yellow and green. Color flow mapping is valuable because of the large amount of information that can be obtained in a single image. It can also aid in the: (1) localization of flow accelerations, (2) quantitation of valvar regurgitation, (3) visualization of intracardiac shunting, and/or (4) assessment of arterial connections. Information obtained from color Doppler can be further refined by pulse wave Doppler and continuous wave Doppler interrogation.
22.3.7 Quantification of Pressure Gradients Using Doppler Shift Measurements
Today, quantification of pressure gradients using Doppler echocardiography can provide hemodynamic information that could previously be obtained only by invasive cardiac catheterization. Specifically, the Bernoulli equation [3, 7] defines the relationship between velocity shifts across an obstruction and the pressure gradients caused by the obstruction. For practical purposes, the proximal velocity is neglected and the simplified equation becomes: pressure difference = distal velocity squared × 4. This is a valuable way to estimate pressure drops across obstructive valves and/or pressure differences between chambers (based on the velocities of valvar regurgitation or intracardiac shunting).
22.3.8 Myocardial Performance Index
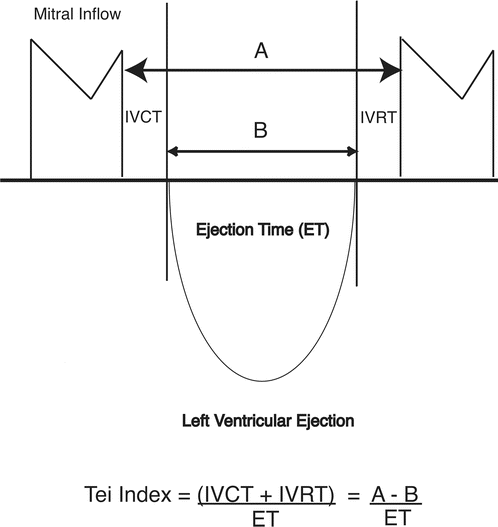
The myocardial performance index (MPI) is a noninvasive Doppler measurement of global ) ventricular function that incorporates both systolic and diastolic function and may be applied to the right ventricle (RV) or left ventricle (LV) [8]. The MPI (or Tei index) is defined as a ratio of the sum of the isovolumic contraction time (IVCT) and isovolumic relaxation time (IVRT) divided by the systolic ejection time (ET) (Fig. 22.1). The index is easily measured with high reproducibility and is important in the assessment of global performance, as the active energy cycles of contraction and relaxation occur during IVCT and IVRT. The Tei index is independent of heart rate and blood pressure and can be a useful tool to evaluate myocardial function in different clinical situations [8].


Fig. 22.1
Diagrammatic representation of the myocardial performance index or Tei index. The Tei index is the sum of the isovolumetric contraction time (IVCT) and isovolumetric relaxation time (IVRT) divided by the ejection time (ET). Adapted from Pellet et al. [8]
22.3.9 Tricuspid Annular Plane Systolic Excursion
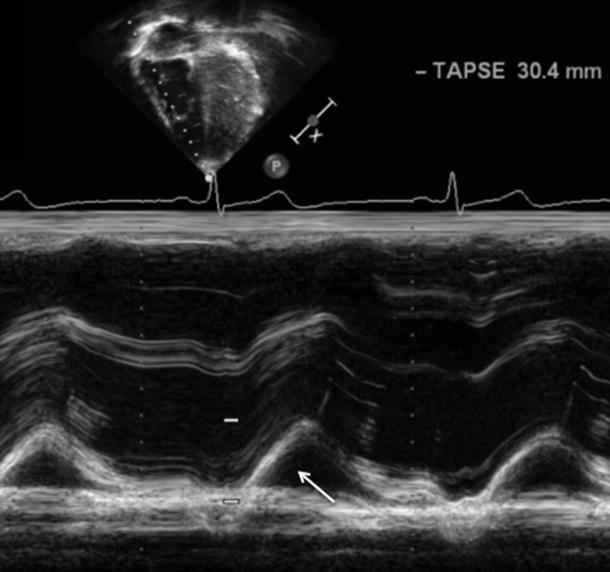
The tricuspid annular plane systolic excursion (TAPSE) can be used to estimate the right ) ventricular global systolic function. TAPSE is an easily obtainable, simple, and generally reliable measure of right ventricular ejection fraction, which allows it to be used routinely in clinical studies. TAPSE is defined as the distance traveled by the tricuspid annulus along the direction of the line joining the tricuspid annulus and right ventricular apex at end-diastole. TAPSE assumes that the displacement of the basal and adjacent segments of the RV are representative of the longitudinal function of the entire right ventricle and that longitudinal myocardial shortening is a significant contributor to overall right ventricular function. TAPSE is assessed with M-mode echocardiography oriented on a two-dimensional image in an apical four-chamber view, placing the M-mode cursor on the lateral tricuspid annulus (Fig. 22.2). The annular plane is identified as the first continuous line immediately below the RV cavity (which appears “above” the RV cavity on apical images). Maximum systolic excursion of the lateral annulus is measured and compared to normal values (Fig. 22.2).


Fig. 22.2
Measurement of the tricuspid annular plane systolic excursion (TAPSE) . TAPSE measures the motion of the lateral tricuspid valve annulus (white arrow) as it moves toward the RV apex during systole. Normal values are greater than 16 mm and reflect longitudinal shortening as a measure of global RV function
22.3.10 Tissue Doppler Imaging
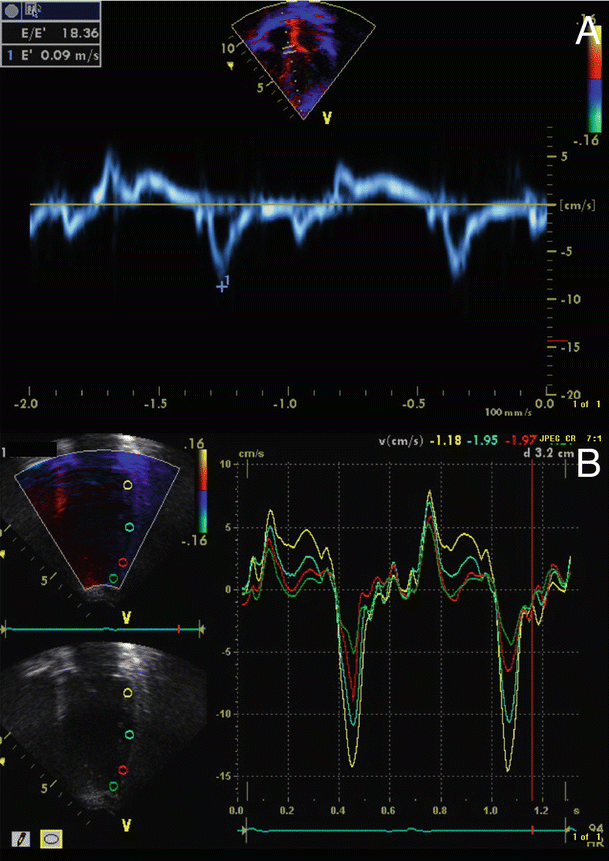
Tissue Doppler imaging (TDI) is an extension of conventional Doppler flow echocardiography that measures myocardial motion and velocity [9] (Fig. 22.3A). Myocardial velocity information can be displayed as a pulse tissue Doppler signal and data color-coded and displayed in real time. Color Doppler allows for visual semi-quantitation of myocardial motion superimposed on conventional M-mode and two-dimensional images. Velocity data from a region of interest can be arranged to obtain spectral displays of tissue velocities. The graphic display includes one positive systolic (S) deflection and two negative diastolic waveforms. The systolic waveform is preceded by regional isovolumic contraction time (RIVCT) , and the diastolic waves are preceded by regional isovolumic relaxation time (RIVRT) . The first diastolic deflection represents the early rapid filling phase of diastole (E), which is followed by a period of diastasis, and a second late active filling phase of diastole (A) due to atrial contraction (Fig. 22.3B).


Fig. 22.3
Tissue Doppler imaging . (A) Pulse wave tissue Doppler provides a spectral display of peak tissue velocity. (B) Tissue Doppler velocity data f or the quantification of asynchrony from apical four-chamber view. Sample volumes are in the lateral septal segment
22.4 Clinical Applications of Cardiac Ultrasound
22.4.1 Transvaginal and Transabdominal Fetal Echocardiography
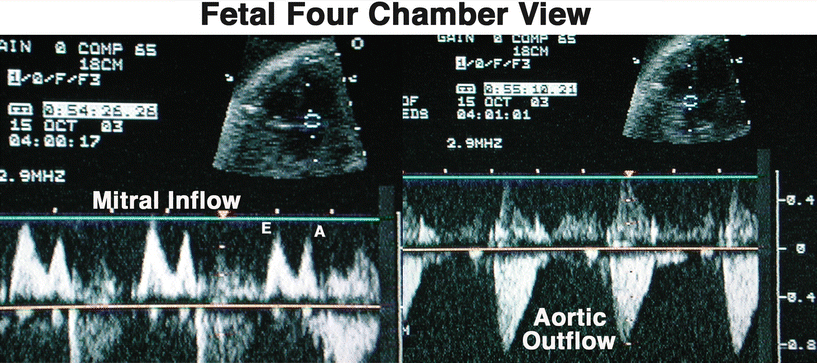
The human fetal heart is fully developed and functional by 11 weeks after conception. Using transvaginal ultrasound, the structure and functional characteristics of the fetal heart can be observed as early as 9 weeks of gestational age [10]. This technique remains the most useful type of fetal cardiac imaging until approximately 16 weeks of gestation. At that time, transabdominal imaging becomes the preferred method (Fig. 22.4). Fetal imaging is routinely performed at 16–20 weeks of gestational age, and image quality improves until about 24–28 weeks of gestational age [10]. The quality of fetal images can be reduced by loss of amniotic fluid, maternal body habitus, fetal bone density, and/or the fetal position. M-mode, two-dimensional, and Doppler ultrasound techniques are useful for analyses of the anatomy and function of the fetal heart, the diagnoses and monitoring of fetal arrhythmias, and the guidance of fetal interventional procedures. In general, fetal echocardiography has contributed to: (1) improved understanding of the natural history of many forms of congenital heart disease; (2) improved monitoring and obstetric care of fetuses with structural heart diseases and arrhythmias; and (3) attempts at in utero correction of vascular, valvular, and structural cardiac abnormalities [11, 12].
 < div class='tao-gold-member'>


Only gold members can continue reading. Log In or Register to continue
Stay updated, free articles. Join our Telegram channel

Full access? Get Clinical Tree


