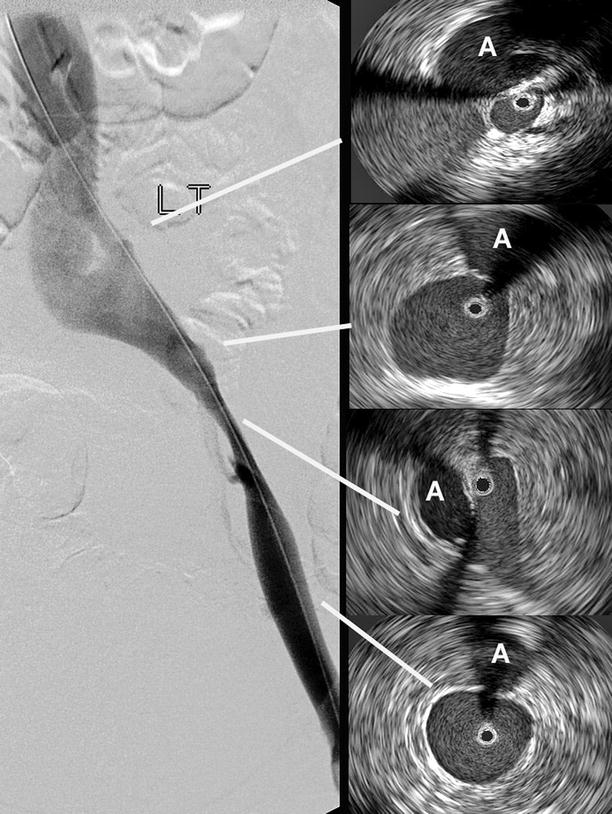
Fig. 43.1
The bright echoes close to a multi-array catheter may be “ringed down” (top). The guidewire of a monorail type of catheter may create a wedge-formed acoustic shadow. By rotating the catheter, the hidden areas can be visualized (middle). Rarely is the IVUS catheter tracking in the center of the vessel to register a true crosscut area. An eccentric position of the IVUS may exaggerate the lumen (bottom)
The IVUS catheter is placed in the vein percutaneously. Following an ultrasound-guided cannulation, a guidewire (usually 0.035 in.) is inserted and manipulated into the intended position depending on the type of intervention. A sheath (usually 8–9F) is placed percutaneously to facilitate repeated access. The IVUS catheter is threaded over the guidewire to assist the passage of the catheter within the venous lumen. The catheter rides either coaxially over the guidewire, which is placed in a central lumen along the catheter, or in a monorail fashion, where the catheter is attached only at the distal 1–2 cm of the tip. The coaxial placement of the guidewire improves tracking and prevents kinking, and thus has an advantage in that aspect. A monorail-style catheter may be problematic when a tight stenosis or severe tortuosity of the vein is encountered. Advancing the catheter and the guidewire as one unit may sometimes facilitate passage. After advancing the IVUS catheter to a level above the area of interest, images are obtained during catheter withdrawal through the lumen. This is performed slowly manually or by a mechanical pullback device. This allows a smooth and continuous image acquisition, which is not always possible during insertion of the catheter. The images are seen in real time and may be stored digitally for later analysis by the built-in software of the ultrasound imaging system.
Bright echoes are produced close to the high frequency ultrasound tip, which is more noticeable with the multi-array IVUS catheter (Fig. 43.1). This catheter allows digital subtraction of the artifact, the so-called ring down, but in so doing limits the visualization close to the catheter. This maneuver is not necessary with the rotating mirror catheter. The guidewire in the monorail system often creates an acoustic shadow, hiding a wedge of the crosscut area. This error is not seen with coaxial guidewires. By rotating the IVUS catheter, the “shadowed” areas can be visualized (Fig. 43.1).
The anatomic orientation of the visualized structures is often not accurate. The image is variably rotated. The only way to correctly orientate the field during ilio-caval imaging is to relate the image to the position of constant anatomic landmarks. The right renal artery most commonly crosses posterior to the IVC; the right common iliac artery crosses above the left common iliac vein, which is anterior to the dense bone; and the iliac artery is usually lateral and anterior to the iliac vein (Fig. 43.2). The anatomic orientation, however, is not a major issue in diagnosis of venous obstruction or venous stenting or placement of IVC filters.
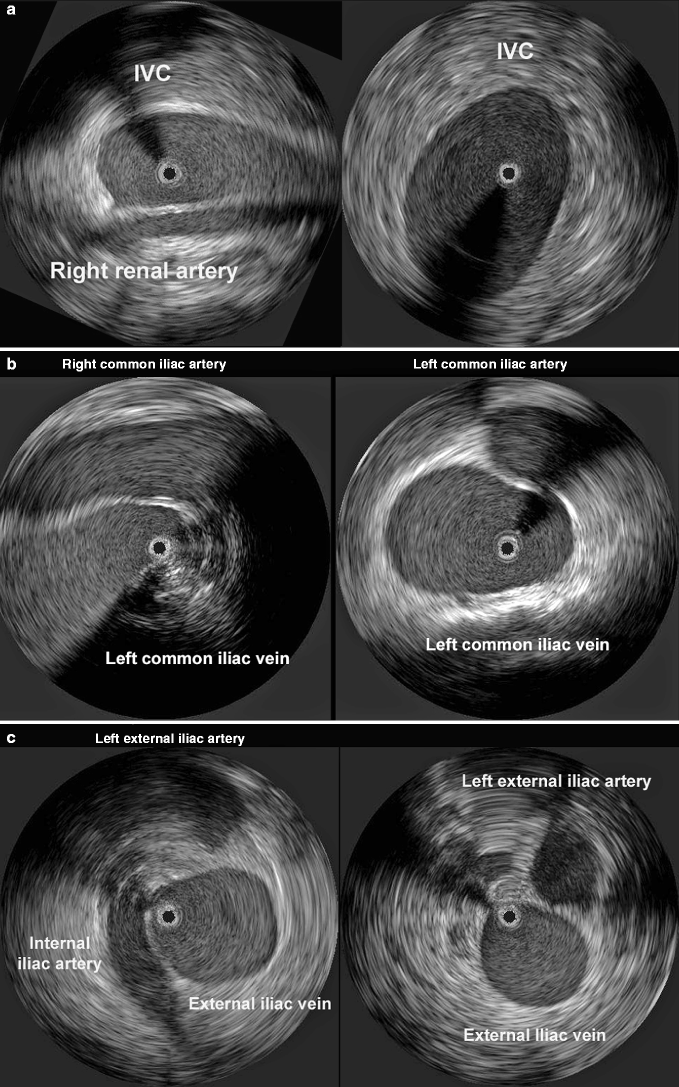

Fig. 43.2
(a) Constant anatomic landmarks allow a correct rotation of the IVUS catheter. The right renal artery usually traverses posterior to the IVC (left). The aorta along the normal below-renal IVC is not seen with this magnification (right). The black circle within the vein is the IVUS catheter. (b) The right iliac artery crosses anterior to the left iliac vein, sometimes creating varying degrees of compression (left). The left- and right common iliac artery follow the vein in an anterolateral position (right). The black circle within the vein is the IVUS catheter. (c) The internal iliac artery crosses over the iliac vein medially as it leaves the common iliac artery and dives down into the pelvis following the internal iliac vein (left). The external iliac artery continues distally in the anterolateral position to the vein (right). The black circle within the vein is the IVUS catheter
Diagnostic Venous IVUS
Venoplasty and stenting of the iliac vein is presently the “method of choice” in the treatment of ilio-caval chronic venous obstruction [2–9]. The importance of venous outflow obstruction in the pathophysiology of chronic venous disorder has been increasingly recognized, and it is apparent that reflux alone cannot explain the symptoms and signs of many patients. Although it is previously well known that the combination of reflux and obstruction creates the worst scenario, iliofemoral outflow obstruction may play a larger role in the pathophysiology of chronic venous disorders than previously thought. The iliac vein is the common outflow tract of the lower extremity and chronic obstruction of this segment appears to result in more severe symptoms than does lower segmental blockage. Distal obstructions appear to be better compensated by collateral formation than are proximal lesions. Therefore, the ilio-caval venous segment has been the target area for balloon dilation and stenting.
Since it is not known at what degree of obstruction the venous flow is restricted, no tests are presently available for the accurate diagnosis of hemodynamically significant venous outflow obstruction [10]. Commonly used routine non-invasive tests such as outflow air or strain-gauge plethysmographic tests and duplex Doppler ultrasound may indicate an outflow obstruction, but a normal test does not exclude significant ilio-caval blockage. Even invasive pressure tests, e.g., femoral exercise pressures, arm-foot venous pressure differential and hyperemia-induced pressure increase, are not sufficiently accurate. Presently, the diagnosis of outflow obstruction must ultimately be made by morphological investigations.
A single-plane transfemoral antegrade venogram is the routine morphologic investigation of the ilio-caval outflow. This type of venogram in the anterior-posterior plane is inferior to multiple oblique imaging, especially in the presence of iliac compression from external structures. These lesions compress the vein in different body planes and may therefore be visualized only in certain projections. Using angiographic techniques including subtraction and power injection of contrast dye further increases the sensitivity (Fig. 43.3). Even multi-plane venogram, however, may underestimate the severity and extent of the obstructive lesion as compared to direct imaging by IVUS, which is currently superior to any other imaging technique of venous ilio-caval outflow. Development of new MR-venography and spiral CT techniques may in the future replace invasive morphologic studies, but needs validation by IVUS. Although definition of a hemodynamically significant venous stenosis is lacking, a morphological obstruction of >50% stenosis has arbitrarily been chosen to be significant because of favorable clinical response when stented [11]. The treatment of choice of venous outflow obstruction is balloon venoplasty and stenting.
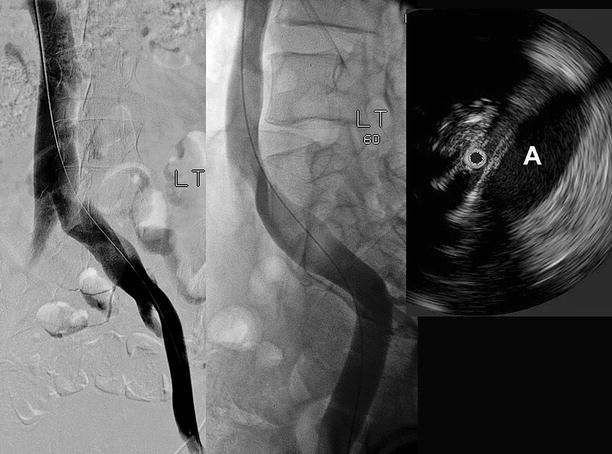

Fig. 43.3
Transfemoral venogram in AP view (left) and with 60° rotation (middle). The right common iliac artery (A) makes a distinct corkscrew-like impression on the vein in the oblique projection, while only a slight translucency is seen on the AP view. The severity of the stenosis at the vessel crossing is better appreciated on IVUS. The black circle within the vein is the IVUS catheter (right)
Venous outflow blockage will presently only be found in patients with chronic venous disorders if the treating physician is aware of its potential importance and suspect its presence. It is common to restrict venous workup with duplex Doppler ultrasound of the lower extremity to below the inguinal ligament, and then mainly for detection of reflux. This is insufficient to detect ilio-caval outflow obstruction. A more aggressive approach toward diagnosis is warranted in some patients. Ultrasound investigation should routinely be extended to involve the ilio-caval venous outflow, and in select cases with pertinent symptoms, be complemented by morphological studies such as multi-plane transfemoral venogram or, preferably, IVUS. In our practice, IVUS is used generously in symptomatic patients with venographic findings of stenosis or visualization of collaterals, which can be considered an indicator of obstruction, or when plethysmographic or pressure tests are positive for obstruction. Symptoms may range from painful swelling to severe stages with lipodermatosclerosis or ulcer. Patients of special interest are those with symptoms (especially pain) out of proportion to detectable pathology or those with typical symptoms but no detectable lesions on standard tests, those with no improvement of symptoms after standard treatment, and those with previous deep vein thrombosis. The use of IVUS in these patients has the dual purpose of accurately diagnosing the degree and nature of obstruction and aiding in appropriate placement of the stent.
Using the built-in software program, the actual crosscut lumen area can be calculated by planimetry and the length of different diameters measured (Fig. 43.4). Regardless of its shape and varying diameters in different projections, the true stenosis can be delineated and compared to the non-obstructed proximal or distal vein lumen. Several studies have shown that IVUS is superior in detection of the extent and morphologic degree of stenosis as compared to single-plane venography [2, 12–14]. On average, the transfemoral venogram significantly underestimated the degree of stenosis by 30%. The venogram was actually considered “normal” in at least one-fourth of limbs despite the fact that IVUS showed >50% stenosis [3]. In a similar population of 304 limbs, the stenosis was <50% in 42% of venograms but in only 10% of the IVUS. On the other hand, the venous stenosis was >70% in 32% of venograms, but twice as often with IVUS. Using the IVUS findings as the standard, the venogram had a poor sensitivity (45%) and a negative predictive value of 49% in detecting an obstruction >70% [12]. Another study of 104 limbs has shown similar result for diagnosis of >50% stenosis. Slightly more than half the patients (58%) had significant stenosis by IVUS although 10 limbs had normal venogram and 24 limbs had inaccurate location or extent on venogram. The sensitivity to detect >50% stenosis was 43% and the negative predictive value 56% [15].
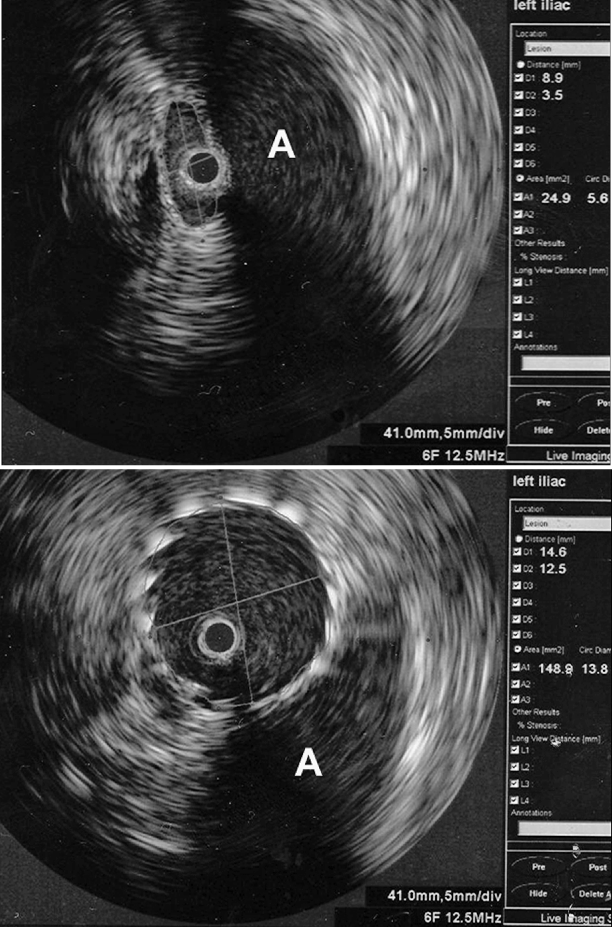

Fig. 43.4
Measurement of the crosscut area before (top) and after venous stenting (below). The measurements are displayed at the right aspect of the screen. The area increased from 24.9 to 148.9 mm2 with the dilation. The longest and shortest diameters are given in addition to the calculated diameter as if the measured area represented a circle. The adjacent artery is marked with an A. The black circle within the vein is the IVUS catheter
The lack of correlation of the extent of venous lesion on venography and findings on IVUS is striking. More often than not, the extent of stenosis in limbs with thrombotic and non-thrombotic obstruction is greater on IVUS. This is of great importance for placement of stents. The true extent and severity of recurrent in-stent stenosis is probably best assessed by IVUS.
Finer intraluminal lesions are difficult to visualize with venography. The injected contrast dye may hide such lesions. Delicate intraluminal details, such as webs, frozen valves, and trabeculations, can be detected by ultrasound, but they are rarely seen on venography (Fig. 43.5) [16]. Despite the high resolution of IVUS, it is inferior to angioscopy in identifying the thin valve leaflets. IVUS failed to detect 76% of valve stations identified by angioscopy [14].
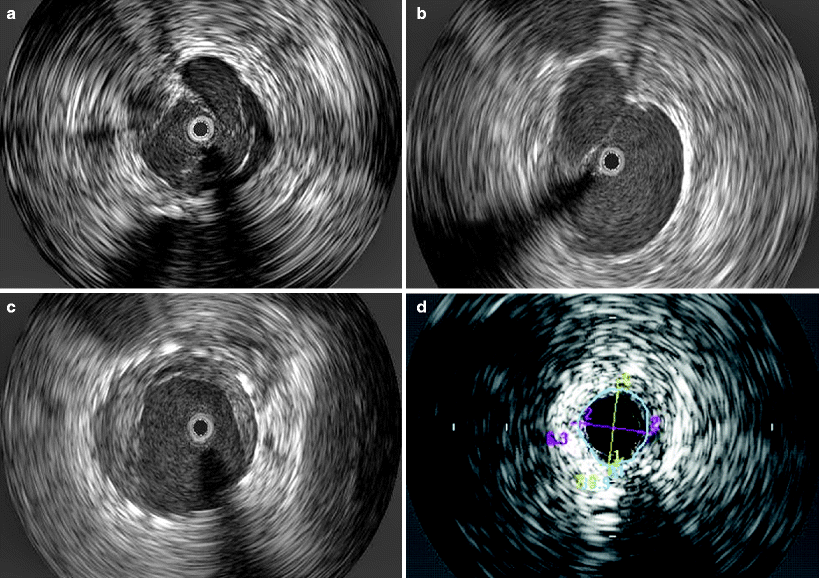

Fig. 43.5
Images obtained by venous intravascular ultrasound (IVUS): (a) Trabeculation with multiple lumina; (b) Intraluminal septa; (c) In-stent restenosis precisely identifying the stent, neointimal hyperplasia and remaining lumen; (d) Compression of the IVC by a circumferentially growing liver cancer. The black circle inside the vein represents the inserted IVUS catheter
The IVUS can detect varying degrees of echogenicity in intraluminal masses, the vessel wall, and the surrounding tissue. Increased echogenicity of the vessel wall may indicate increased fibrosis and wall thickness often seen in post-thrombotic veins. Varying echogenicity of intraluminal thrombi may correlate with the age of the thrombus. Fresh thrombus appears more hypoechoic than older thrombus and is surrounded by inflammatory edema (Fig. 43.6). This may allow age determination of different parts of an extensive deep vein thrombus. Compliance of the venous wall is reflected by phasic movement during respiration. Lack of respiratory variations of the vein wall indicates less compliance with a stiffer wall. None of these observations are possible with venography. Contrarily, collateral formation is poorly shown by IVUS. Only axial collateral formation in close proximity to the native vein can be detected by IVUS. Venogram may occasionally fail to distinguish these from the main vein [16].
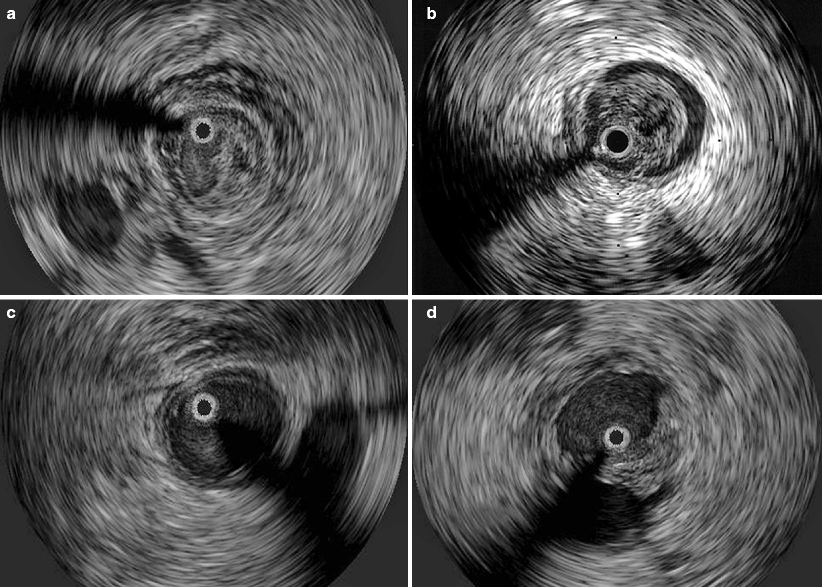

Fig. 43.6
(a) Relatively acute DVT with partial obstruction of the lumen and surrounding inflammatory edema; (b) An older, well defined thrombus adherent to the vessel wall, which is fibrosed with increased echogenicity; (c) Complete clearance of a thrombus after lysis, but edema of the vessel wall (double-contour) remains; (d) Partial lysis of a thrombus after lysis, but the vessel is more than 50% patent. The black circle inside the vein represents the inserted IVUS catheter
Arterial obstruction is usually due to thickening of the wall with plaque formation. Only rarely does outside compression play a major role. In the venous system, outside compression mainly by arterial structures appears to play a major role even in limbs with ilio-caval post-thrombotic obstruction. The relationship between the left iliac vein compression by the right iliac artery and DVT of the left lower extremity is well known [17]. Typically, a stenosis of the left proximal common iliac vein is caused by compression by the right common iliac artery with secondary band or web formation (Fig. 43.7) [18]. The stenosis is rarely focal when imaged by IVUS. The artery has an oblique course causing a narrowing, although less, along the major length of the common iliac vein. In addition, approximately 30% of the limbs with compression disease have been shown by IVUS to have stenosis beyond the common iliac vein [3]. Although this lesion is classically described to occur in the left iliac vein in younger females, it is not an uncommon finding in males, in elderly patients and in the outflow of the right limb [19]. On venogram such a compression may be indirectly suggested by showing a widening of the iliac vein, a “thinning” of the contrast dye resulting in a translucence of the area, and the presence of transpelvic collaterals, sometimes despite a normal appearance of the iliofemoral vein (Fig. 43.8). With IVUS, the compressed vein can be clearly delineated between the overriding artery and the posterior bone structure [9, 20]. This compression results in an hourglass deformity of the vein of varying degrees with frequently observed secondary intraluminal lesions such as web formation. The compression visualized by IVUS is more extensive than that shown by venogram. IVUS investigation in 16 limbs with iliac compression syndrome showed that the iliac vein compression extended distally, involving the external iliac or common femoral veins in 68% (11/16). A filling defect representing thrombi was identified in 25% (4/16) and synechia in the compressed vein lumen was seen in 44% (7/16). These additional findings on IVUS led to modification of the intervention in 50% of limbs [13].
