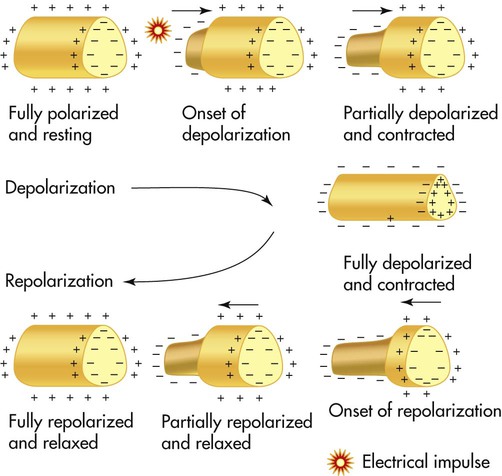
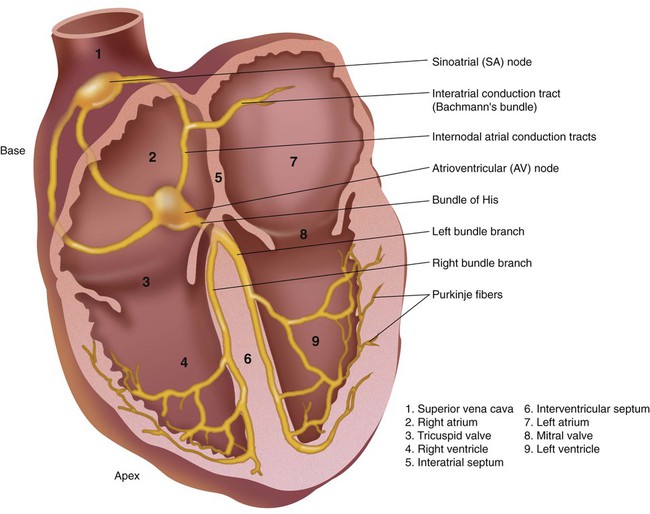
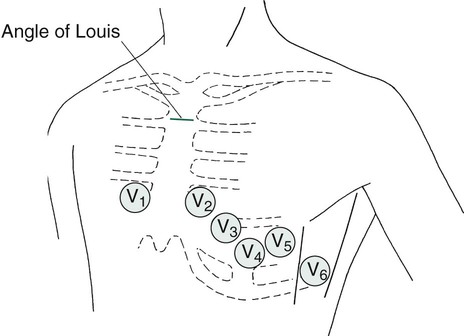
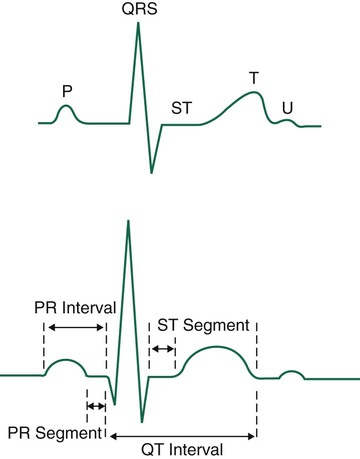
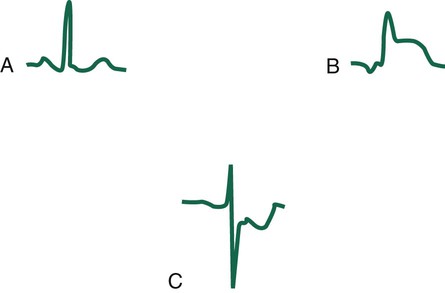
After reading this chapter you will be able to: Electrocardiography is an important tool used by health care practitioners. In some settings, the electrocardiogram (ECG) is obtained by the respiratory therapist (RT), which places the RT at the bedside in a prime position to recognize and respond to life-threatening arrhythmias. For this reason, RTs must be familiar with the electrocardiographic results and must be able to interpret them accurately. This chapter emphasizes the basics of cardiac physiology, lead placement, ECG interpretation, and the identification and key points in the treatment of dysrhythmias. More details of the cardiopulmonary anatomy and emergency cardiovascular life support are presented in Chapters 9 and 34. The ECG is a popular evaluation tool because it is inexpensive, noninvasive, and easy to obtain. It is used primarily to evaluate a patient with an acute clinical condition suggestive of myocardial disease. A physician would order an ECG for most adult patients complaining of certain types of chest pain, shortness of breath, dyspnea with palpitations, weakness, lethargy, or syncope. These are classic clinical symptoms associated with heart disease for which the ECG is used. In addition, the ECG is routinely used by physicians for evaluating the general health status of middle-aged or older patients before major surgery or for periodic health screening. A resting ECG has little or no value as a predictor of future heart problems, however. It is useful only for detecting abnormalities that are occurring or have already occurred, such as a myocardial infarction (MI). In addition, certain abnormalities, such as valvular defects, cannot be identified directly by an ECG.1 Understanding the ECG requires a basic knowledge of physiology related to the contraction and relaxation of the heart muscle. The muscle cells of the heart normally are stimulated and paced by the electrical activity of the cardiac impulse-conducting system. The impulse-conducting system cells have the ability to stimulate the heart without the influence of the nervous system. However, the autonomic nervous system normally plays a major role in controlling heart function (see subsequent discussion).1 Cardiac muscle cells normally generate an electrical imbalance across the cell membrane with a positive charge on the outside and a negative charge on the inside. This is the resting or polarized state in which there is no electrical activity. Stimulation of the “polarized” cells causes an influx of sodium into the interior portion of the cell; this is called depolarization (Figure 17-1). Depolarization causes the cardiac muscle cells to contract momentarily, which is seen as a shortening of the muscle. Depolarization is immediately followed by repolarization, which is a rapid return of the cell to the “polarized” position in which the electrical imbalance across the membrane is reestablished. The impulse-conducting system has three types of cardiac cells capable of electrical excitation: pacemaker cells (e.g., sinoatrial [SA] node, atrioventricular [AV] node), specialized rapidly conducting tissue (e.g., Purkinje fibers), and atrial and ventricular muscle cells. The ability of these cells to depolarize without stimulations is known as automaticity. Each of these cardiac cell groups varies in their degree of automaticity.1–3 The impulse-conducting system is responsible for initiating the heartbeat and controlling the heart rate. It also coordinates the contraction of the heart chambers, which is essential to move blood effectively. A defect in the impulse-conducting system may lead to inadequate cardiac output and decreased tissue perfusion. Normally, the SA node, which is located in the upper portion of the right atrium, has the greatest degree of automaticity and paces the heart (Figure 17-2). Any heartbeat originating outside the SA node is considered an ectopic beat.2 The SA node is innervated by the autonomic nervous system, which allows the sympathetic and parasympathetic nervous systems to influence heart rate. Stimulation of the sympathetic nervous system increases the heart rate, whereas activation of the parasympathetic nervous system slows the heart rate by influencing the degree of automaticity within the SA node. The electrical impulse generated by the SA node travels rapidly across the right atrium, through intraatrial pathways, to the left atrium by way of Bachmann bundle; this causes a wave of depolarization to occur over the atria, producing atrial contraction. Next, the impulse moves to the AV node, located in the intraventricular septum in the inferior aspect of the right atrium (see Figure 17-2). The AV node is the “backup” pacemaker because it has the second greatest degree of automaticity in the healthy heart. In most cases, if the SA node fails to function properly, the AV node paces ventricular activity at a lower heart rate of 40 to 60 beats/min, which is generally sufficient to maintain adequate cardiac output.2 The electrical impulse is temporarily delayed at the AV node to allow the ventricles time to fill with blood. That brief delay also limits the rate of the ventricular stimulation during excessively fast atrial rhythms that, if passed to the ventricles, would lead to inadequate cardiac output.3,4 The impulse exits the AV node, enters the bundle of His, and rapidly moves to the bundle branches. The bundle branches carry the impulse rapidly into the right and left ventricles. The bundle branches terminate in the Purkinje fibers, which are small, finger-like projections that penetrate the myocardium (see Figure 17-2). These fibers stimulate contraction of the myocardium from the apex of the heart upward toward the base of the heart, causing a coordinated contraction of the ventricles, which normally is effective in moving blood. The impulse travels the most rapidly in the Purkinje fibers, which is essential if contraction of the ventricles is to occur in a coordinated fashion. Immediately after depolarization of the ventricles, repolarization occurs in preparation for the next impulse.3,4 The 12 leads can be subdivided into two groups: 6 extremity (limb) leads and 6 chest (precordial) leads. To obtain the six limb leads, four electrodes are placed on the extremities, one on each wrist and one on each ankle. These leads are bipolar, which permits the measurement of electrical activity in two different directions. Additionally, the ECG unit can vary the orientation of these four electrodes to create six different views. Any electrical activity of the heart that is directed up, down, left, or right is recorded by the limb leads. The limb leads are called leads I, II, III, aVR, aVL, and aVF (Table 17-1). TABLE 17-1 The 12 Leads of an ECG and the Myocardial Wall That Each Set Views *Excludes aVR, which faces the interior, endocardial surface of the ventricles. From Wilkins RL, Dexter JR, Heuer AJ: Clinical assessment in respiratory care, ed 6, St Louis, 2010, Mosby. The six chest or precordial leads are called leads V1, V2, V3, V4, V5, and V6. These leads are unipolar, which means that they measure electrical activity in only one direction. These leads are placed in a horizontal plane across the chest, starting with V1 in the fourth intercostal space to the right of the sternum. The rest of the chest leads are on the left side, starting with V2, which is placed in the fourth intercostal space just to the left of the sternum, and ending with V6, which is placed at the fifth intercostal space at the left midaxillary line (V6). Figure 17-3 illustrates proper placement of ECG leads. The view from each chest lead provides its own angle of orientation to measure cardiac electrical activity moving anteriorly or posteriorly.2,4 The wave of depolarization occurring in the atria is seen as the P wave on the ECG (Figure 17-4). The normal P wave is no more than 2.5 mm high or 3 mm long. Atrial hypertrophy may cause the P wave to enlarge to a height and length beyond the normal parameters. Atrial repolarization is not seen on the electrocardiographic tracing because it is obscured by the electrical activity occurring in the ventricles at the same time. The QRS complex usually consists of several distinct waves, each of which has a letter assigned to it as a label. If the first wave of the complex is negative (downward), it is labeled the Q wave. The initial positive (upward) deflection is electrocardiographically referred to as the R wave, and the next negative deflection after the R wave is labeled the S wave. Not all QRS complexes have all three components present, but the waves making up ventricular depolarization are electrocardiographically referred to as the QRS complex, regardless of its exact makeup. The wave of repolarization occurring in the ventricles immediately after depolarization is the T wave (see Figure 17-4). The next important part of the ECG to evaluate is the ST segment, which represents the time from the end of ventricular depolarization to the start of ventricular repolarization. The normal ST segment is isoelectric, which is seen as a flat line that is not above or below the neutral baseline. Certain pathologic abnormalities in the myocardium cause the ST segment configuration to become abnormal; this is seen as an elevated or depressed ST segment and is common in cardiac ischemia and MI (Figure 17-5). Because this configuration represents a potentially life-threatening arrhythmia, abnormal ST segments must be identified as soon as possible.3–5
Interpreting the Electrocardiogram
 Describe the value and limitations of the electrocardiogram.
 Describe the electrophysiology of cardiac cells.
 Describe how the cardiac impulse is conducted through the different structures of the heart.
Basic Principles of Electrophysiology
Impulse-Conducting System
Electrocardiogram Procedural Summary
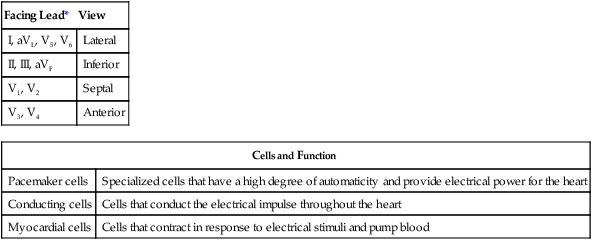
Facing Lead*
View
I, aVL, V5, V6
Lateral
II, III, aVF
Inferior
V1, V2
Septal
V3, V4
Anterior
Cells and Function
Pacemaker cells
Specialized cells that have a high degree of automaticity and provide electrical power for the heart
Conducting cells
Cells that conduct the electrical impulse throughout the heart
Myocardial cells
Cells that contract in response to electrical stimuli and pump blood
Basic Electrocardiographic Waves
Interpreting the Electrocardiogram

 Rule of Thumb


