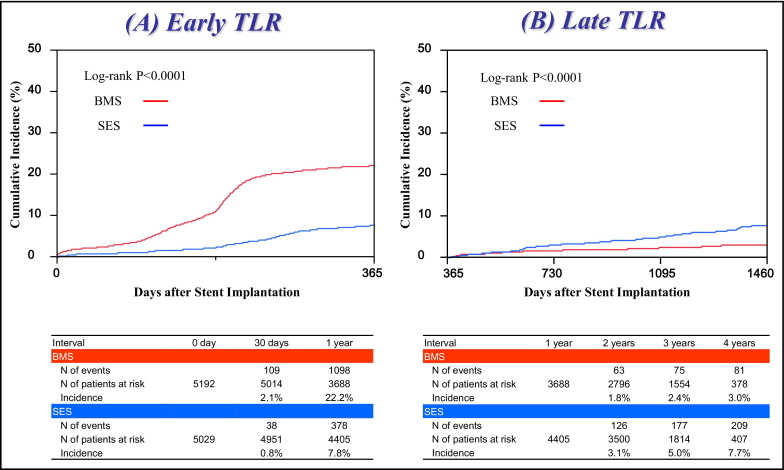
Therapeutic strategies preventing late target lesion revascularization (TLR) after drug-eluting stent implantation have not been yet adequately investigated. In 13,087 consecutive patients undergoing first percutaneous coronary intervention in the CREDO-Kyoto Registry Cohort-2, we identified 10,221 patients who were discharged alive after implantation of sirolimus-eluting stents (SESs) only (SES stratum 5,029) or bare-metal stents (BMSs) only (BMS stratum 5,192). Impact of statin therapy at time of discharge from the index hospitalization on early (within the first year) and late (1 year to 4 years) TLR, was assessed in the SES stratum (statin group 2,735; nonstatin group 2,294) and in the BMS stratum (statin group 2,576; nonstatin group 2,616). Despite a significantly lower incidence of early TLR (7.8% vs 22.2%, p <0.0001), SES use compared to BMS use was associated with a significantly higher incidence of late TLR (7.7% vs 3.0%, p <0.0001). In the SES and BMS strata, the incidence of early TLR was similar regardless of statin use. In the SES stratum, the incidence of late TLR was significantly lower in the statin group than in the nonstatin group (6.1% vs 9.6%, p = 0.002), whereas no significant difference was found in the BMS stratum (2.6% vs 3.3%, p = 0.38). After adjusting confounders, risk for late TLR significantly favored statin use in the SES stratum (hazard ratio 0.73, 95% confidence interval 0.54 to 0.98, p = 0.04), whereas the risk decrease was not significant in the BMS stratum (hazard ratio 0.74, 95% confidence interval 0.46 to 1.20, p = 0.23). In conclusion, statin therapy at hospital discharge was associated with a significantly lower risk for late TLR after SES implantation.
Statins have been reported to have antiproliferative effects on vascular smooth muscle cells in vitro and in vivo experiments. Therefore, several studies have evaluated the effect of statins on restenosis after coronary revascularization. In the balloon angioplasty era, statins failed to decrease restenosis, which might be explained by the fact that the main mechanism of restenosis after balloon angioplasty was long-term negative remodeling of the vessel wall. Because restenosis after bare-metal stent (BMS) implantation was reported to be caused mainly by neointima hyperplasia, statins were expected to decrease the rate of restenosis at BMS sites. However, statins could not decrease revascularization events related to restenosis even after BMS implantation in randomized controlled trials. Inflammatory reactions and/or prolonged endothelial dysfunction in addition to neointima hyperplasia have been accused as the mechanisms of restenosis of drug-eluting stents (DESs), particularly in cases of late restenosis necessitating late target lesion revascularization (TLR). Because statins have been reported to improve inflammation or endothelial dysfunction, statins might have favorable effects on late restenosis after DES implantation. To evaluate the efficacy of statin therapy on restenosis after coronary stent implantation, we analyzed the impact of statin therapy on early and late TLR after sirolimus-eluting stent (SES) and BMS implantation in a large Japanese observational database of patients who underwent first coronary revascularization.
Methods
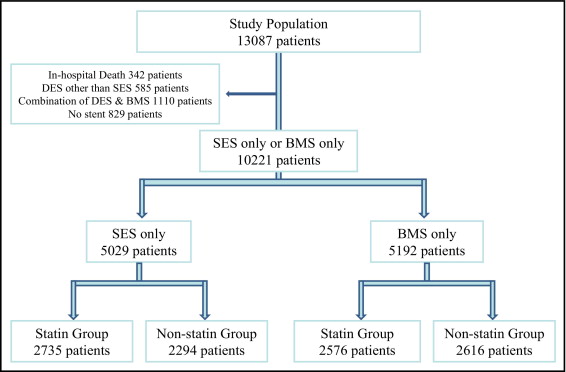
The Coronary Revascularization Demonstrating Outcome Study in Kyoto (CREDO-Kyoto) Percutaneous Coronary Intervention (PCI)/Coronary Artery Bypass Grafting Registry Cohort-2 is a multicenter registry enrolling consecutive patients undergoing first coronary revascularization procedures in 26 centers in Japan from January 2005 through December 2007 ( Supplemental Appendix A ). The relevant review boards or ethics committees in all participating centers approved the research protocol. The design and patient enrollment of the CREDO-Kyoto PCI/Coronary Artery Bypass Grafting Registry Cohort-2 has been described previously. During the 3-year enrollment period, 13,144 patients underwent PCI as the first coronary revascularization procedure. Excluding 57 patients who refused study participation, 13,087 patients were enrolled in the PCI arm of the registry. Excluding 342 patients who died during the index hospitalization, 585 patients treated with DESs other than SESs, 1,110 patients treated with a combination of DESs and BMSs, and 829 patients without stent use, 10,221 patients were included in the present analysis including 5,029 patients treated with SESs only (SES stratum) and 5,192 patients treated with BMSs only (BMS stratum). To evaluate the impact of statin therapy on clinical outcomes, patients in the SES and BMS strata were divided into 2 groups according to statin use at time of discharge from the index hospitalization (SES stratum: 2,735 patients in statin group and 2,294 patients in nonstatin group; BMS stratum: 2,576 patients in statin group and 2,616 patients in non statin group; Figure 1 ) .
Definitions of baseline clinical characteristics were described previously. Primary outcome measurements in the present analysis were early TLR and late TLR. TLR was defined as PCI or coronary artery bypass grafting owing to restenosis or thrombosis of the target lesion that included the proximal and distal edge segments and the ostium of the side branches. Early TLR was defined as TLR performed within 1 year and late TLR was defined as TLR performed >1 year after stent implantation. Death, cardiovascular death, myocardial infarction, stroke, stent thrombosis, TLR, clinically driven TLR, target vessel revascularization, non-TLR, and any coronary revascularization were also assessed as end points. Death was regarded as cardiac in origin unless obvious noncardiac causes could be identified. Vascular death was defined as death related to aortic, cerebral, renal, and peripheral vascular diseases. Myocardial infarction was defined according to the definition in the Arterial Revascularization Therapy Study. Within 1 week of the index procedure, only Q-wave myocardial infarction was adjudicated as myocardial infarction. Stroke during follow-up was defined as ischemic or hemorrhagic stroke requiring hospitalization with symptoms lasting >24 hours. Stent thrombosis was defined according to the Academic Research Consortium definition. Clinically driven TLR was defined as TLR performed because of ischemic symptoms, electrocardiographic changes at rest, or positive stress test results. Non-TLR was defined as revascularization for lesions other than the index target lesions.
Recommended antiplatelet regimen was aspirin (≥81 mg/day) indefinitely and thienopyridine (ticlopidine 200 mg/day or clopidogrel 75 mg/day) for ≥3 months. Duration of thienopyridine administration was left to the discretion of each attending physician. For statin therapy we did not set indications using statins and statin use was left to the discretion of each attending physician.
Demographic, angiographic, and procedural data were collected from hospital charts or databases according to prespecified definitions in each participating center by experienced clinical research coordinators in the study management center ( Supplemental Appendix B ). Follow-up data were obtained from hospital charts or by contacting patients or referring physicians. Scheduled staged PCI procedures performed during the index hospitalization or within 3 months of the initial procedure were not regarded as follow-up events but were included in the index procedure. Clinical events such as cardiovascular death, myocardial infarction, stroke, and stent thrombosis were adjudicated against original source documents by a clinical events committee ( Supplemental Appendix C ). Information on revascularization was obtained from hospital charts or referring physicians.
Follow-up intervals were calculated from the day of the index PCI procedure. Because the final data collection for follow-up events was initiated on July 1, 2009, follow-up events were censored on this date. Median follow-up duration was 979 days (interquartile range 724 to 1,247). Follow-up serum lipid levels were measured optionally and the median interval from the index procedure to the measurement of lipid levels was 360 days (interquartile range 261 to 400).
Categorical variables were compared using chi-square test. Continuous variables were expressed as mean ± SD or median and interquartile range. Continuous variables were compared using Student’s t test or Wilcoxon rank-sum test based on the distribution. Cumulative incidence was estimated by the Kaplan–Meier method and differences were assessed with log-rank test.
In the present analysis, comparison of clinical outcomes between SES and BMS strata was followed by analyses of the impact of statin use on clinical outcomes through 4 years after PCI. To evaluate the impact of statin therapy on late TLR, we used landmark analysis at 1 year. Those patients with TLR before the 1-year landmark point were excluded from this analysis.
We used Cox proportional hazard models to estimate the risk of the statin group compared to the nonstatin group for early and late TLR after adjusting for differences in patient characteristics, procedural factors, and medical therapies in the SES and BMS strata, respectively. In consistent with our previous report, we chose 38 clinically relevant factors ( Table 1 ) as risk-adjusting variables. Continuous variables were dichotomized by clinically meaningful reference values or median values. Proportional hazard assumption for the comparison between the statin and nonstatin groups was assessed on plots of log(time) versus log(−log[survival]) stratified by statin therapy. Statin therapy and the 38 risk-adjusting variables were simultaneously included in the Cox proportional hazard model for adjusted analyses. Twenty-six centers were included in the model as stratification variables. Effect of statin therapy (statin compared to nonstatin group) was expressed as hazard ratio (HR) and 95% confidence interval (CI).
| Variables | Statin | Nonstatin | p Value |
|---|---|---|---|
| (n = 2,735) | (n = 2,294) | ||
| Clinical characteristics | |||
| Age (years) | 67.2 ± 10.3 | 69.6 ± 10.3 | <0.0001 |
| Age ≥75 years ⁎ | 723 (26%) | 787 (34%) | <0.0001 |
| Men ⁎ | 1,857 (68%) | 1,745 (76%) | <0.0001 |
| Body mass index (kg/m 2 ) | 24.2 ± 3.3 | 23.3 ± 3.5 | <0.0001 |
| Body mass index <25.0 kg/m 2 ⁎ | 1,709 (62%) | 1,650 (72%) | <0.0001 |
| Total cholesterol (mg/dl) | 200 ± 42.7 | 185 ± 35 | <0.0001 |
| High-density lipoprotein cholesterol (mg/dl) | 48.7 ± 13.3 | 47.0 ± 13.9 | <0.0001 |
| Triglyceride (mg/dl) | 122 (87–175) | 110 (77–158) | <0.0001 |
| Low-density lipoprotein cholesterol (mg/dl) | 123 ± 38.4 | 113 ± 30.0 | <0.0001 |
| Acute myocardial infarction ⁎ | 452 (17%) | 323 (14%) | 0.02 |
| Hypertension ⁎ | 2,297 (84%) | 1,881 (82%) | 0.06 |
| Diabetes mellitus | 1,116 (41%) | 929 (41%) | 0.83 |
| On insulin therapy ⁎ | 261 (9.5%) | 256 (11%) | 0.06 |
| Current smoker ⁎ | 747 (27%) | 625 (27%) | 0.96 |
| Heart failure ⁎ | 374 (14%) | 448 (20%) | <0.0001 |
| Shock at presentation ⁎ | 45 (1.7%) | 37 (1.6%) | 0.93 |
| Multivessel coronary disease ⁎ | 1,634 (60%) | 1,296 (57%) | 0.02 |
| Mitral regurgitation grade 3/4 ⁎ | 71 (2.6%) | 89 (3.9%) | 0.01 |
| Ejection fraction (%) | 61.0 ± 12.6 | 58.7 ± 13.1 | <0.0001 |
| Previous myocardial infarction ⁎ | 373 (14%) | 304 (13%) | 0.69 |
| Previous stroke ⁎ | 267 (9.8%) | 301 (13%) | 0.0002 |
| Peripheral vascular disease ⁎ | 191 (7.0%) | 208 (9.1%) | 0.007 |
| Estimated glomerular filtration rate <30 ml/min/1.73 m 2 | |||
| Not on dialysis ⁎ | 81 (3.0%) | 103 (4.5%) | 0.004 |
| Dialysis ⁎ | 53 (1.9%) | 174 (7.6%) | <0.0001 |
| Atrial fibrillation ⁎ | 162 (5.9%) | 233 (10%) | <0.0001 |
| Anemia (hemoglobin <11 g/dl) ⁎ | 228 (8.3%) | 339 (15%) | <0.0001 |
| Platelet count <100 × 10 9 /L ⁎ | 21 (0.8%) | 49 (2.1%) | <0.0001 |
| Chronic obstructive pulmonary disease ⁎ | 89 (3.3%) | 82 (3.6%) | 0.53 |
| Liver cirrhosis ⁎ | 44 (1.6%) | 72 (3.1%) | 0.0003 |
| Malignancy ⁎ | 208 (7.6%) | 223 (9.7%) | 0.008 |
| Procedural characteristics | |||
| Number of target lesions | 1 (1–2) | 1 (1–2) | 0.01 |
| 1.49 ± 0.76 | 1.44 ± 0.72 | ||
| Target lesion | |||
| Proximal left anterior descending coronary artery ⁎ | 1,724 (63%) | 1,402 (61%) | 0.16 |
| Unprotected left main coronary artery ⁎ | 94 (3.4%) | 70 (3.1%) | 0.44 |
| Long-term total occlusion ⁎ | 369 (13%) | 301 (13%) | 0.70 |
| Target of bifurcation ⁎ | 1,092 (40%) | 873 (38%) | 0.18 |
| Side branch stenting ⁎ | 129 (4.7%) | 115 (5.0%) | 0.63 |
| Total number of stents | 2 (1–2) | 1 (1–2) | 0.007 |
| 1.95 ± 1.27 | 1.85 ± 1.17 | ||
| Total stent length (mm) | 33 (19–56) | 31 (18–51) | 0.006 |
| 43.6 ± 31.4 | 40.9 ± 28.7 | ||
| Total stent length >28 mm ⁎ | 1,481 (54%) | 1,168 (51%) | 0.02 |
| Minimum stent size (mm) | 2.75 (2.5–3.0) | 3.0 (2.5–3.0) | 0.55 |
| 2.83 ± 0.37 | 2.83 ± 0.37 | ||
| Minimum stent size <3.0 mm ⁎ | 1,379 (50%) | 1,131 (49%) | 0.43 |
| Baseline medication | |||
| Medication at hospital discharge | |||
| Antiplatelet therapy | |||
| Thienopyridine | 2,730 (100%) | 2,286 (100%) | 0.25 |
| Ticlopidine | 2,374 (87%) | 2,086 (91%) | <0.0001 |
| Clopidogrel | 349 (13%) | 199 (8.7%) | <0.0001 |
| Aspirin | 2,707 (99%) | 2,256 (98%) | 0.05 |
| Cilostazol ⁎ | 409 (15%) | 354 (15%) | 0.64 |
| Other medications | |||
| β Blockers ⁎ | 855 (31%) | 561 (24%) | <0.0001 |
| Angiotensin-converting enzyme inhibitors/angiotensin II receptor blockers ⁎ | 1,602 (59%) | 1,183 (52%) | <0.0001 |
| Nitrates ⁎ | 931 (34%) | 940 (41%) | <0.0001 |
| Calcium channel blockers ⁎ | 1,250 (46%) | 1,120 (49%) | 0.03 |
| Nicorandil ⁎ | 598 (22%) | 486 (21%) | 0.56 |
| Warfarin ⁎ | 202 (7.4%) | 210 (9.2%) | 0.02 |
| Proton pump inhibitors ⁎ | 655 (24%) | 514 (22%) | 0.20 |
| H 2 blockers ⁎ | 658 (24%) | 536 (23%) | 0.56 |
| Achieved lipid levels † | |||
| Total cholesterol (mg/dl) | 177 ± 33.2 | 185 ± 34.7 | <0.0001 |
| High-density lipoprotein cholesterol (mg/dl) | 53.0 ± 14.7 | 51.3 ± 14.8 | 0.0006 |
| Triglyceride (mg/dl) | 121 (87–172) | 118 (83–163) | 0.01 |
| Low-density lipoprotein cholesterol (mg/dl) | 96.5 ± 28.8 | 108 ± 30.0 | <0.0001 |
⁎ Potential independent variables selected for multivariate analysis.
† Values for achieved lipid levels were available in 1,958 patients in the statin group and in 1,433 patients in the nonstatin group.
We also used Cox proportional hazard models to estimate the risk of the SES stratum compared to the BMS stratum for early and late TLR. Types of stent, statin therapy, and the 38 risk-adjusting variables mentioned earlier were simultaneously included in the Cox proportional hazard model. Twenty-six centers were also included in the model as stratification variables.
Statistical analyses were conducted by a physician (M. Natsuaki) and by a statistician (T. Morimoto) using JMP 8.0 and SAS 9.2 (SAS Institute, Cary, North Carolina) software. All statistical analyses were 2-tailed and p values <0.05 were considered statistically significant.
Results
Because of the large number of patients and the observational study design, significant differences were observed in many variables in baseline characteristics between patients in the SES and BMS strata. The SES stratum included more elderly patients and had more patients with diabetes mellitus on insulin therapy, multivessel disease, previous myocardial infarction, previous stroke and dialysis, and higher levels of total cholesterol and triglyceride. In contrast, the BMS stratum included more patients with acute myocardial infarction, heart failure, moderate or severe mitral regurgitation, low ejection fraction, liver cirrhosis, and malignancy. For procedural characteristics, patients in the SES stratum had more complex lesions and were treated with longer total stents and with smaller stents. Baseline medications were also significantly different between the 2 strata ( Supplemental Table 1 ).
During the 4-year follow-up, the incidence of TLR was significantly lower in the SES stratum than in the BMS stratum (14.8% vs 24.5%, p <0.0001, log-rank test). Despite the markedly lower incidence of early TLR in the SES stratum, the incidence of late TLR was significantly higher in the SES stratum than in the BMS stratum ( Figure 2 ) . After adjusting confounding factors by Cox regression model, risk for early TLR significantly favored the SES stratum (HR 0.31, 95% CI 0.26 to 0.36, p <0.0001), whereas risk for late TLR was significantly higher in the SES stratum (HR 1.63, 95% CI 1.15 to 2.31, p = 0.006).
In the SES stratum, patients in the statin group were younger and had higher body mass index than in the non-statin group. Female gender, acute myocardial infarction, and multivessel disease were more often found in the statin group. Conversely, heart failure, moderate or severe mitral regurgitation, low ejection fraction, previous stroke, peripheral vascular disease, estimated glomerular filtration rate <30 ml/min/1.73 m 2 , hemodialysis, atrial fibrillation, anemia, small platelet count, liver cirrhosis, and malignancy were more common in the nonstatin group. For the baseline lipid profile, total cholesterol, high-density lipoprotein cholesterol, triglyceride, and low-density lipoprotein cholesterol levels were higher in the statin group. For procedural characteristics, numbers of target lesions and stents were larger and stents were longer in the statin group. Baseline medications were also significantly different between the 2 groups ( Table 1 ).
In the BMS stratum, patients in the statin group were also younger and had a higher body mass index than in the non-statin group. Acute myocardial infarction, hypertension, diabetes mellitus, and current smoking were more often found in the statin group. In contrast, heart failure, moderate or severe mitral regurgitation, previous stroke, peripheral vascular disease, estimated glomerular filtration rate <30 ml/min/1.73 m 2 , hemodialysis, atrial fibrillation, anemia, small platelet count, liver cirrhosis, and malignancy were more common in the nonstatin group. For the baseline lipid profile, total cholesterol, high-density lipoprotein cholesterol, triglyceride, and low-density lipoprotein cholesterol levels were higher in the statin group. For procedural characteristics, a target left main coronary artery was more often found in the nonstatin group. Stents were longer and stents were smaller in the nonstatin group than in the statin group. Baseline medications were also significantly different between the 2 groups ( Table 2 ).
| Variables | Statin | Nonstatin | p Value |
|---|---|---|---|
| (n = 2,576) | (n = 2,616) | ||
| Clinical characteristics | |||
| Age (years) | 65.9 ± 11.7 | 69.4 ± 11.4 | <0.0001 |
| Age ≥75 years | 649 (25%) | 951 (36%) | <0.0001 |
| Men | 1,855 (72%) | 1,945 (74%) | 0.06 |
| Body mass index (kg/m 2 ) | 24.3 ± 3.5 | 23.2 ± 3.4 | <0.0001 |
| Body mass index <25.0 kg/m 2 | 1,621 (63%) | 1,948 (74%) | <0.0001 |
| Total cholesterol (mg/dl) | 198 ± 42.1 | 181 ± 36.9 | <0.0001 |
| High-density lipoprotein cholesterol (mg/dl) | 48.1 ± 13.6 | 47.1 ± 13.0 | 0.01 |
| Triglyceride (mg/dl) | 106 (69–161) | 95 (62–138) | <0.0001 |
| Low-density lipoprotein cholesterol (mg/dl) | 125 ± 37.2 | 112 ± 30.1 | <0.0001 |
| Acute myocardial infarction | 1,467 (57%) | 1,239 (47%) | <0.0001 |
| Hypertension | 2,150 (83%) | 2,087 (80%) | 0.0006 |
| Diabetes mellitus | 905 (35%) | 812 (31%) | 0.002 |
| On insulin therapy | 104 (4.0%) | 132 (5.1%) | 0.08 |
| Current smoker | 1,029 (40%) | 902 (34%) | <0.0001 |
| Heart failure | 441 (17%) | 560 (21%) | <0.0001 |
| Shock at presentation | 177 (6.9%) | 193 (7.4%) | 0.48 |
| Multivessel coronary disease | 1,130 (44%) | 1,159 (44%) | 0.75 |
| Mitral regurgitation grade 3/4 | 71 (2.8%) | 145 (5.5%) | <0.0001 |
| Ejection fraction (%) | 58.4 ± 12.3 | 58.0 ± 13.1 | 0.26 |
| Previous myocardial infarction | 167 (6.5%) | 197 (7.5%) | 0.14 |
| Previous stroke | 177 (6.9%) | 302 (12%) | <0.0001 |
| Peripheral vascular disease | 154 (6.0%) | 227 (8.7%) | 0.0002 |
| Estimated glomerular filtration rate <30 ml/min/1.73 m 2 | |||
| Not on dialysis | 69 (2.7%) | 126 (4.8%) | <0.0001 |
| Dialysis | 23 (0.9%) | 86 (3.3%) | <0.0001 |
| Atrial fibrillation | 186 (7.2%) | 269 (10%) | <0.0001 |
| Anemia (hemoglobin <11 g/dl) | 176 (6.8%) | 380 (15%) | <0.0001 |
| Platelet count <100 × 10 9 /L | 20 (0.8%) | 43 (1.6%) | 0.004 |
| Chronic obstructive pulmonary disease | 104 (4.0%) | 103 (3.9%) | 0.85 |
| Liver cirrhosis | 58 (2.3%) | 95 (3.6%) | 0.003 |
| Malignancy | 220 (8.5%) | 303 (12%) | 0.0003 |
| Procedural characteristics | |||
| Number of target lesions | 1 (1–1) | 1 (1–1) | 0.86 |
| 1.30 ± 0.63 | 1.30 ± 0.61 | ||
| Target lesion | |||
| Proximal left anterior descending coronary artery | 1,326 (51%) | 1,364 (52%) | 0.63 |
| Unprotected left main coronary artery | 46 (1.8%) | 69 (2.6%) | 0.04 |
| Long-term total occlusion | 161 (6.3%) | 168 (6.4%) | 0.80 |
| Target of bifurcation | 573 (22%) | 574 (22%) | 0.79 |
| Side branch stenting | 50 (1.9%) | 66 (2.5%) | 0.16 |
| Total number of stents | 1 (1–2) | 1 (1–2) | 0.39 |
| 1.44 ± 0.80 | 1.46 ± 0.83 | ||
| Total stent length (mm) | 23 (18–33) | 23 (18–35) | 0.04 |
| 28.8 ± 18.7 | 29.3 ± 18.5 | ||
| Total stent length >28 mm | 831 (32%) | 906 (35%) | 0.07 |
| Minimum stent size (mm) | 3.0 (2.75–3.5) | 3.0 (2.5–3.5) | <0.0001 |
| 3.12 ± 0.49 | 3.06 ± 0.49 | ||
| Minimum stent size <3.0 mm | 674 (26%) | 840 (32%) | <0.0001 |
| Baseline medication | |||
| Medication at hospital discharge | |||
| Antiplatelet therapy | |||
| Thienopyridine | 2,553 (99%) | 2,578 (99%) | 0.06 |
| Ticlopidine | 2,318 (91%) | 2,421 (94%) | <0.0001 |
| Clopidogrel | 224 (8.8%) | 147 (5.7%) | <0.0001 |
| Aspirin | 2,558 (99%) | 2,595 (99%) | 0.66 |
| Cilostazol | 628 (24%) | 526 (20%) | 0.0002 |
| Other medications | |||
| β Blockers | 983 (38%) | 717 (27%) | <0.0001 |
| Angiotensin-converting enzyme inhibitors/angiotensin II receptor blockers | 1,764 (68%) | 1,462 (56%) | <0.0001 |
| Nitrates | 732 (28%) | 1,037 (40%) | <0.0001 |
| Calcium channel blockers | 852 (33%) | 995 (38%) | 0.0002 |
| Nicorandil | 674 (26%) | 653 (25%) | 0.32 |
| Warfarin | 194 (7.5%) | 206 (7.9%) | 0.64 |
| Proton pump inhibitors | 770 (30%) | 683 (26%) | 0.002 |
| H 2 blockers | 754 (29%) | 748 (29%) | 0.59 |
| Achieved lipid levels ⁎ | |||
| Total cholesterol (mg/dl) | 173 ± 32.7 | 187 ± 35.6 | <0.0001 |
| High-density lipoprotein cholesterol (mg/dl) | 52.0 ± 14.1 | 51.2 ± 15.1 | 0.10 |
| Triglyceride (mg/dl) | 125 (90–173) | 115 (82–168) | 0.001 |
| Low-density lipoprotein cholesterol (mg/dl) | 93.4 ± 27.8 | 110 ± 31.2 | <0.0001 |
Stay updated, free articles. Join our Telegram channel

Full access? Get Clinical Tree


