Limited data exist concerning risk factors for cardiovascular (CV) hospitalization in patients with atrial fibrillation (AF) or atrial flutter (AFL). The aim of this retrospective cohort evaluation was to assess whether patient characteristics and risk factors, including CHADS 2 (congestive heart failure, hypertension, age ≥75 years, type 2 diabetes, and previous stroke or transient ischemic attack [doubled]) and CHA 2 DS 2 -VASc (congestive heart failure; hypertension; age ≥75 years [doubled]; type 2 diabetes; previous stroke, transient ischemic attack, or thromboembolism [doubled]; vascular disease; age 65 to 75 years; and sex category) scores, identified patients with AF or AFL at risk for CV hospitalization. Claims data (January 2003 to June 2009) were evaluated to identify patients aged ≥40 years with ≥1 inpatient or ≥2 (within 30 days of each other) outpatient diagnoses of AF or AFL and an absence of diagnosis codes related to cardiac surgery within 30 days of AF or AFL diagnosis. Risk factors for first CV hospitalization in the 2-year period after diagnosis were assessed using univariate and multivariate analyses. Overall, 377,808 patients (mean age 73.9 ± 12.1 years) were identified, of whom 128,048 had CV hospitalizations. CHADS 2 and CHA 2 DS 2 -VASc scores were the top 2 predictors of first CV hospitalization after AF or AFL diagnosis. Hospitalization risk was increased 2.3- to 2.7-fold in patients with CHADS 2 scores of 6 and approximately 3.0-fold in patients with CHA 2 DS 2 -VASc scores of 9 compared to patients with a score of 0. These increases were maintained essentially unchanged throughout the 2-year follow-up period. In conclusion, CHADS 2 and CHA 2 DS 2 -VASc scores were predictive of first CV hospitalization in patients with AF or AFL and may be helpful in identifying “at-risk” patients and guiding therapy.
An estimated 3.03 million patients had atrial fibrillation (AF) in the United States in 2005, and this number is expected to reach 7.56 million by 2050. Patients with AF or atrial flutter (AFL) frequently have cardiovascular (CV) co-morbidities and are at increased risk for hospitalization. AF or AFL is responsible for approximately 529,000 hospitalizations in the United States each year. Because the mean cost per CV hospitalization is approximately $10,908, these hospitalizations have a significant impact on the economic cost of caring for these patients. Validated schemas for assessing the risk for stroke, thromboembolism, and mortality in patients with AF or AFL are used to guide antithrombotic therapy and include the CHADS 2 (congestive heart failure, hypertension, age ≥75 years, type 2 diabetes, and previous stroke or transient ischemic attack [doubled]) and CHA 2 DS 2 -VASc (congestive heart failure; hypertension; age ≥75 years [doubled]; type 2 diabetes; previous stroke, transient ischemic attack, or thromboembolism [doubled]; vascular disease; age 65 to 75 years; and sex category) scores. The objective of this evaluation was to determine whether specific patient characteristics or risk factors, including CHADS 2 and CHA 2 DS 2 -VASc scores, were predictive of first CV hospitalization in patients with AF or AFL.
Methods
This retrospective cohort evaluation used integrated patient data for the period from January 1, 2003, to June 30, 2009, obtained from the Thomson Reuters (Cambridge, Massachusetts) MarketScan Commercial Claims and Encounters database and Medicare Supplemental (January 1, 2003, to December 31, 2008) database ( Figure 1 ) . This database contains detailed enrollment, clinical utilization, and expenditure data for approximately 85 million subjects from approximately 45 large employers, health plans, and government and public organizations. These data reflect real-world treatment and outcomes and have been used for >400 peer-reviewed publications. In accordance with the Health Insurance Portability and Accountability Act of 1996, all patient data were deidentified before analysis.
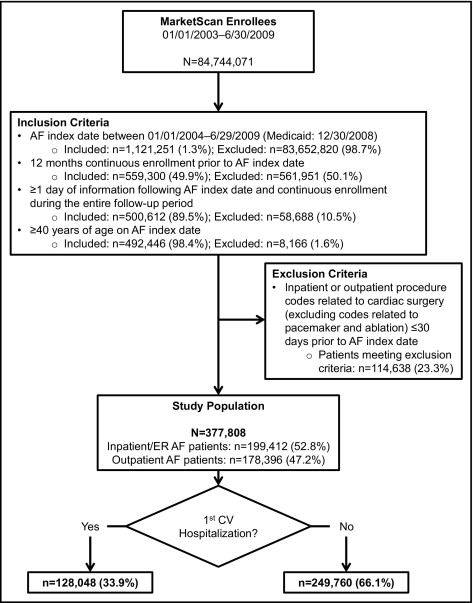
The study population included patients aged ≥40 years with diagnoses of AF or AFL (International Classification of Diseases, Ninth Revision, Clinical Modification [ICD-9-CM] diagnosis codes 427.31 and 427.32) during ≥1 inpatient admission or ≥2 outpatient medical claims from January 1, 2004, to June 29, 2009 (December 30, 2008, for Medicaid patients). The qualifying diagnoses could appear in any position on a claim for any inpatient admission or within 30 days of each other for outpatient service. The date of the first qualifying AF diagnosis from January 1, 2004, to June 29, 2009, was designated the index date. Data from all identified patients were then further evaluated and included in the analysis if the patient was aged ≥40 years on the index date, had ≥12 months of continuous enrollment before the index date, had ≥1 day of follow-up information after the index date, had continuous enrollment during the entire follow-up period, and did not have an ICD-9-CM code relating to cardiac surgery (excluding pacemaker and ablation codes) 30 days before the index date.
The study consisted of baseline and follow-up periods. Data from the baseline period, which started 364 days before the index date and ended on the index date, were used to obtain information about each patient’s medical history. Data from the follow-up period, which started the day after the index date and ended after 24 months of observation, when the patient exited the database, or on the study end date (whichever came first), were used to assess hospitalization risk.
The primary outcome of interest was the first CV hospitalization after the index date with all-cause CV hospitalization defined by ICD-9-CM codes 390.xx to 459.xx. A secondary outcome measure was elapsed time from index date to first CV hospitalization (time to first hospitalization).
Demographic and clinical characteristics at baseline were summarized using descriptive statistics (means, medians, standard deviations, and ranges for continuous variables and frequencies and percentages for categorical variables).
Univariate and multivariate analyses using logistic regression were performed to identify predictors of CV hospitalization, defined as binary outcomes (CV hospitalization, yes or no). Logistic regression modeling was used as an exploratory tool to better understand the interrelations among many potentially correlated clinical factors by estimating the odds ratio (OR) and 95% confidence interval (CI). Multivariate Cox proportional-hazard models were used to estimate hazard ratios (HR) and 95% CIs, to evaluate time to first CV hospitalization, and to understand the time dependency of various covariates (co-morbidities, treatments, demographics). All multivariate models used a backward selection method to remove statistically insignificant covariates, with a significance level ≤0.01 (the threshold required for any covariate to remain in the final model). Model fits were evaluated by Hosmer-Lemeshow test and C statistic. On the basis of clinical considerations, we reduced the number of initial variables (n = 36) to include the top 10 covariates. The life table method was used to estimate the percentage risk for hospitalization at different risk periods of 3, 6, 9, 12, 15, 18, 21, and 24 months for each respective CHADS 2 and CHA 2 DS 2 -VASc score. For these models, risk was assessed at the end of each period.
Results
Of the nearly 85 million enrollees in the MarketScan database, 377,808 (0.45%) were identified who fulfilled all inclusion and exclusion criteria ( Figure 1 ). Table 1 lists demographic and clinical characteristics at baseline for the overall study cohort and by CV hospitalization status. Differences between patients with first CV hospitalizations and no CV hospitalizations were statistically significant (p <0.05) for all characteristics.
| Characteristic | All Patients (n = 377,808) | Patients With First CV Hospitalization | Patients With No CV Hospitalizations |
|---|---|---|---|
| (n = 128,048) | (n = 249,760) | ||
| Demographics | |||
| Age at index (years) | |||
| Median (range) | 76 (40–109) | 77 (40–108) | 75 (40–109) |
| Mean ± SD | 73.9 ± 12.1 | 74.9 ± 11.5 | 73.4 ± 12.4 |
| Age category (years) | |||
| 40–74 | 171,026 (45.3%) | 53,140 (41.5%) | 117,886 (47.2%) |
| ≥75 | 206,782 (54.7%) | 74,908 (58.5%) | 131,874 (52.8%) |
| Men | 196,840 (52.1%) | 66,179 (51.7%) | 130,661 (52.3%) |
| Continuous enrollment (years) | |||
| Median (range) | 3.5 (1.01–6.5) | 4.0 (1.03–6.5) | 3.5 (1.01–6.5) |
| Mean ± SD | 4.1 ± 1.8 | 4.3 ± 1.7 | 4.0 ± 1.9 |
| AF diagnosis at index | |||
| Inpatient | 199,412 (52.8%) | 72,076 (56.3%) | 127,336 (51.0%) |
| Outpatient/ER | 178,396 (47.2%) | 55,972 (43.7%) | 122,424 (49.0%) |
| Type of AF diagnosis | |||
| New case | 238,443 (63.1%) | 59,004 (46.1%) | 179,439 (71.8%) |
| Existing case | 139,365 (36.9%) | 69,044 (53.9%) | 70,321 (28.2%) |
| Region | |||
| Northeast | 31,578 (8.4%) | 10,854 (8.5%) | 20,724 (8.3%) |
| North Central | 113,261 (30.0%) | 40,294 (31.5%) | 72,967 (29.2%) |
| South | 106,797 (28.3%) | 34,758 (27.1%) | 72,039 (28.8%) |
| West | 87,889 (23.3%) | 29,786 (23.3%) | 58,103 (23.3%) |
| Unknown ⁎ | 38,283 (10.1%) | 12,356 (9.6%) | 25,927 (10.4%) |
| Plan type | |||
| Commercial | 85,689 (22.7%) | 23,488 (18.3%) | 62,201 (24.9%) |
| Medicare | 254,664 (67.4%) | 92,471 (72.2%) | 162,193 (64.9%) |
| Medicaid | 37,455 (9.9%) | 12,089 (9.4%) | 25,366 (10.2%) |
| Baseline characteristics | |||
| Charlson co-morbidity index | |||
| 0 | 203,089 (53.8%) | 59,499 (46.5%) | 143,590 (57.5%) |
| ≥1 | 174,719 (46.2%) | 68,549 (53.5%) | 106,170 (42.5%) |
| Previous CV hospitalization | 242,740 (64.2%) | 89,611 (70.0%) | 153,129 (61.3%) |
| Hypertension | 218,073 (57.7%) | 77,778 (60.7%) | 140,295 (56.2%) |
| Stroke | 54,504 (14.4%) | 20,682 (16.2%) | 33,822 (13.5%) |
| Myocardial infarction | 20,310 (5.4%) | 7,830 (6.1%) | 12,480 (5.0%) |
| Pulmonary embolism | 7,616 (2.0%) | 2,666 (2.1%) | 4,950 (2.0%) |
| Major bleeding | 70,682 (18.7%) | 26,784 (20.9%) | 43,898 (17.6%) |
| Structural heart disease | 191,402 (50.7%) | 74,469 (58.2%) | 116,933 (46.8%) |
| Other coronary artery disease | 141,741 (37.5%) | 56,168 (43.9%) | 85,573 (34.3%) |
| Heart failure | 117,647 (31.1%) | 49,404 (38.6%) | 68,243 (27.3%) |
| Cancer | 113,449 (30.0%) | 39,241 (30.6%) | 74,208 (29.7%) |
| Valvular heart disease | 99,140 (26.2%) | 37,402 (29.2%) | 61,738 (24.7%) |
| Cardiac hypertrophy | 50,047 (13.2%) | 20,628 (16.1%) | 29,419 (11.8%) |
| Nonischemic cardiomyopathy | 28,844 (7.6%) | 12,254 (9.6%) | 16,590 (6.6%) |
| Chronic obstructive pulmonary disease | 77,053 (20.4%) | 31,448 (24.6%) | 45,605 (18.3%) |
| Type 2 diabetes | 76,735 (20.3%) | 30,584 (23.9%) | 46,151 (18.5%) |
| Treated hyperthyroidism | 30,686 (8.1%) | 10,933 (8.5%) | 19,753 (7.9%) |
| Composite AF symptom † | 120,964 (32.0%) | 44,110 (34.4%) | 76,854 (30.8%) |
| CHADS 2 score | |||
| 0 | 50,615 (13.4%) | 11,598 (9.1%) | 39,017 (15.6%) |
| 1 | 105,004 (27.8%) | 31,539 (24.6%) | 73,465 (29.4%) |
| 2 | 109,002 (28.9%) | 39,235 (30.6%) | 69,767 (27.9%) |
| 3 | 66,172 (17.5%) | 26,607 (20.8%) | 39,565 (15.8%) |
| 4 | 31,139 (8.2%) | 12,365 (9.7%) | 18,774 (7.5%) |
| 5 | 13,053 (3.5%) | 5,462 (4.3%) | 7,591 (3.0%) |
| 6 | 2,823 (0.7%) | 1,242 (1.0%) | 1,581 (0.6%) |
| CHA 2 DS 2 -VASc score | |||
| 0 | 15,776 (4.2%) | 3,051 (2.4%) | 12,725 (5.1%) |
| 1 | 34,867 (9.2%) | 8,063 (6.3%) | 26,804 (10.7%) |
| 2 | 54,564 (14.4%) | 15,738 (12.3%) | 38,826 (15.5%) |
| 3 | 75,261 (19.9%) | 24,911 (19.5%) | 50,350 (20.2%) |
| 4 | 80,105 (21.2%) | 29,215 (22.8%) | 50,890 (20.4%) |
| 5 | 59,419 (15.7%) | 23,343 (18.2%) | 36,076 (14.4%) |
| 6 | 35,069 (9.3%) | 14,179 (11.1%) | 20,890 (8.4%) |
| 7 | 15,959 (4.2%) | 6,632 (5.2%) | 9,327 (3.7%) |
| 8 | 5,681 (1.5%) | 2,408 (1.9%) | 3,273 (1.3%) |
| 9 | 1,107 (0.3%) | 508 (0.4%) | 599 (0.2%) |
⁎ Includes Medicaid population of 37,455.
† Includes chest pain, tachycardia, palpitations, dizziness, syncope, dyspnea, and fatigue at AF index date.
Baseline CHADS 2 and CHA 2 DS 2 -VASc factors were the strongest predictors of first CV hospitalization in patients with AF or AFL in all univariate and multivariate logistic and Cox proportional-hazards models. AF treatments and certain concomitant medications (listed in Table 2 ) were not found to be predictive of first hospitalization. Therefore, models that included key co-morbidities provided the best clinical and statistical predictive results. On the basis of multivariate logistic models (age modeled as a continuous variable), congestive heart failure (OR 6.6, 95% CI 6.01 to 7.32), type 2 diabetes (OR 2.4, 95% CI 2.17 to 2.73), stroke (OR 3.1, 95% CI 2.68 to 3.57), and hypertension (OR 1.5, 95% CI 1.35 to 1.62) were found to increase the risk for first CV hospitalization (data not shown). In multivariate logistic regression models that included all variables (with age as a binary variable), the risk for first CV hospitalization was 3 times higher in patients with preexisting AF during baseline compared to patients with newly diagnosed AF. Therefore, estimates of time to first CV hospitalization were stratified by this variable.
| Treatment at Baseline | All Patients (n = 377,808) | Patients With First CV Hospitalization | Patients With No CV Hospitalizations |
|---|---|---|---|
| (n = 128,048) | (n = 249,760) | ||
| Rhythm-control drugs | 16,443 (4.3%) | 6,186 (4.8%) | 10,257 (4.1%) |
| Rate-control drugs | 106,481 (28.2%) | 40,838 (31.9%) | 65,643 (26.3%) |
| Antithrombotic drugs | 88,444 (23.4%) | 34,914 (27.3%) | 53,530 (21.4%) |
| Statins | 145,865 (38.6%) | 52,280 (40.8%) | 93,585 (37.5%) |
| Antihypertensive drugs | 197,263 (52.2%) | 73,643 (57.5%) | 123,620 (49.5%) |
| Electrical cardioversion | 16,007 (4.2%) | 5,840 (4.6%) | 10,167 (4.1%) |
| Ablation (CPT code 93651) | 5,422 (1.4%) | 1,923 (1.5%) | 3,499 (1.4%) |
| Pacemaker | 31,295 (8.2%) | 12,644 (9.9%) | 18,651 (7.5%) |
| Other cardiac surgery | 175,243 (46.3%) | 60,988 (47.6%) | 114,255 (45.7%) |
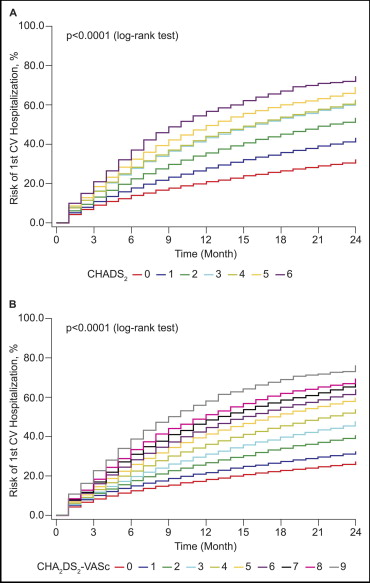
The individual components of CHADS 2 (congestive heart failure: HR 1.7, 95% CI 1.65 to 1.71; type 2 diabetes: HR 1.3, 95% CI 1.28 to 1.33; stroke: HR 1.2, 95% CI 1.17 to 1.22; hypertension: HR 1.2, 95% CI 1.20 to 1.24) were also found to be associated with time to first CV hospitalization risk. However, because of violations in the underlying assumption that the HR is independent of time and valid only for time-independent covariates for the Cox proportional-hazards models, a nonparametric life table approach was taken to estimate the association of CHADS 2 and CHA 2 DS 2 -VASc scores with first CV hospitalization risk.
The correlation between CHADS 2 and CHA 2 DS 2 -VASc scores and risk for first CV hospitalization was present and relatively consistent from the first through the last month of the follow-up period ( Figure 2 ) . Relative to a CHADS 2 score of 0, a score of 6 was associated with an excess 2.7-fold risk at 6 or 12 months, 2.5-fold risk at 18 months, and 2.3-fold risk at 24 months. A CHA 2 DS 2 -VASc score of 9 was associated with an approximate 3.0-fold increase in risk across time periods (6, 12, 18, and 24 months) compared to a score of 0 ( Table 3 ). Patients who entered the cohort with preexisting AF had higher risks (OR 3.0, 95% CI 2.93 to 3.08) for CV hospitalization, even after adjustment for all other factors (treatment, age, other baseline co-morbidities listed in Table 1 ).
Stay updated, free articles. Join our Telegram channel

Full access? Get Clinical Tree


