Cardiovascular risk remains uncertain in patients with cardiovascular disease despite achieving target lipid levels. Serum levels of lipoprotein(a) [Lp(a)] can be risk factors for adverse events. The aim of this study was to determine the role of Lp(a) as a residual risk factor in patients who achieve target lipid levels by the time of treatment by percutaneous coronary intervention (PCI). A total of 3,508 patients were treated by PCI from 1997 to 2011 at our institution. Among them, we analyzed consecutive 569 patients who achieved target lipid levels of low-density lipoprotein cholesterol <100 mg/dl, high-density lipoprotein cholesterol ≥40 mg/dl, and triglycerides <150 mg/dl at PCI. A total of 411 eligible patients were assigned to groups according to Lp(a) levels of ≥30 mg/dl (high Lp(a); n = 119) or <30 mg/dl (low Lp(a); n = 292). The primary outcome was a composite of all-cause death and acute coronary syndrome. The median follow-up period was 4.7 years. Cumulative event-free survival was significantly worse for the group with high Lp(a) than with low Lp(a) group (p = 0.04). Multivariate analysis selected a high Lp(a) level as an independent predictor of primary outcomes (hazard ratio 1.68, 95% confidence interval 1.03 to 2.70, p = 0.04). In conclusion, a high Lp(a) value (≥30 mg/dl) could be associated with a poor prognosis after PCI even for patients who achieved target lipid levels.
Lipoprotein(a) [Lp(a)] is a modified form of low-density lipoprotein (LDL) in which the large glycoprotein apolipoprotein(a) is covalently bound to apolipoprotein B by a disulfide bridge. Consequently, elevated high serum levels of Lp(a) are associated with increased risk of major adverse cardiac events in patients with coronary artery disease (CAD) after percutaneous coronary intervention (PCI). However, one significant limitation to these studies is that the clinical relevance of Lp(a) within the context of an optimal lipid profile was not investigated. The importance of the Lp(a) level independently of other lipid parameters and its potential to be a residual risk factor beyond other lipid parameters remains unknown. We therefore investigated the impact of Lp(a) on the long-term outcomes of patients who achieved target lipid profiles at the time of PCI.
Methods
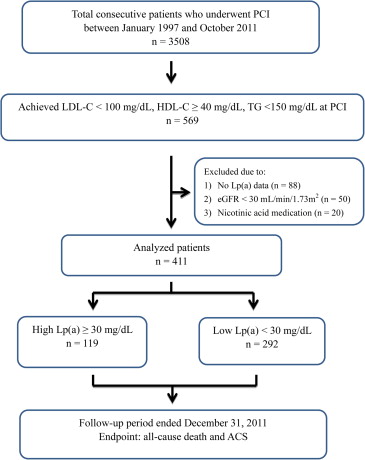
Consecutive Japanese patients who underwent PCI at Juntendo University Hospital (Tokyo, Japan) from January 1997 to October 2011 were considered for this analysis. We enrolled only those who achieved target levels of low-density lipoprotein cholesterol (LDL-C) <100 mg/dl, high-density lipoprotein cholesterol (HDL-C) ≥40 mg/dl, and triglycerides <150 mg/dl based on guidelines that were current at the time of PCI. The exclusion criteria were as follows (1) missing Lp(a) data, (2) kidney dysfunction defined as estimated glomerular filtration rate <30 ml/min/1.73 m 2 , because Lp(a) plasma levels are obviously increased in such patients due to kidney dysfunction, and (3) the medications that affect Lp(a) levels (nicotinic acid including niceritrol, tocopherol nicotinate, and nicomol).
Baseline data, revascularization procedure-related factors, and co-morbidities were prospectively collected from each patient. Blood samples were collected early in the morning after an overnight fast. Levels of Lp(a) were measured using latex agglutination immunoassays (Special Reference Laboratories, Hachioji, Japan). The patients were assigned to groups based on serum Lp(a) levels of <30 or ≥30 mg/dl because 90% of healthy Japanese populations have Lp(a) <30 mg/dl ; published reports suggest that ≥30 mg/dl Lp(a) confers pathological and epidemiological effects, and this value is the most prevalent cutoff.
Survival data and information about incident acute coronary syndrome (ACS) were collected by blinded investigators. The primary outcome was a composite of all-cause death and ACS.
The results are expressed as means ± SD or medians (interquartile range) for continuous variables and as ratios (%) for categorical variables. Baseline data were compared using an unpaired t test or Mann-Whitney U test for continuous variables and the chi-squared test or Fisher’s exact test for categorical variables. Kaplan-Meier event-free survival curves were compared using the log-rank test. Factors associated with outcomes were determined using univariate Cox regression analysis. Variables with significant or borderline significant associations (p <0.10) with outcomes were then included in multivariate Cox regression analyses. A p <0.05 was considered to indicate significance, unless otherwise indicated. All data were analyzed using JMP 10.0 MDSU statistical software (SAS Institute, Cary, North Carolina).
Results
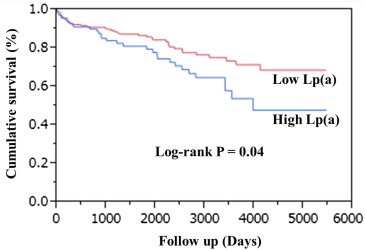
Among 3,508 patients who underwent PCI, 569 achieved target levels of all conventional lipid parameters at the time of PCI. Figure 1 shows the remaining 292 and 119 patients with serum Lp(a) <30 mg/dl [low Lp(a)] and ≥30 mg/dl [high Lp(a)], respectively, who were finally assessed. Type B2/C lesions were more likely to be associated with high Lp(a) group compared with low Lp(a) group ( Table 1 ). However, no other variables significantly differed between the 2 groups. Outcome data were fully documented during the follow-up period (median 4.7 years, interquartile range 1.2 to 6.4). During the follow-up, 53 (12.9%) patients died because of cardiac death (n = 9), carcinoma (n = 10), stroke (n = 3), and other causes (n = 12) in the low Lp(a) group and cardiac death (n = 8), carcinoma (n = 3), stroke (n = 1), and other causes (n = 7) in the high Lp(a) group. Furthermore, 28 patients (6.8%) developed ACS comprising ST-segment elevation myocardial infarction (n = 6), non–ST-segment elevation myocardial infarction (n = 2), and UAP (n = 9) in the low Lp(a) group and ST-segment elevation myocardial infarction (n = 5), non–ST-segment elevation myocardial infarction (n = 1), and UAP (n = 5) in the high Lp(a) group. Figure 2 shows event-free survival curves. The incidence of all-cause death and/or ACS was significantly higher in the group with high Lp(a) than with low Lp(a). Multivariate Cox proportional hazards regression analysis revealed that Lp(a) and ACS were significant independent predictors of a worse outcome (hazard ratio 1.68, 95% confidence interval 1.03 to 2.70, p = 0.04 and hazard ratio 1.82, 95% confidence interval 1.08 to 3.07, p = 0.03, respectively; Table 2 ).

| Low Lp (a) (n = 292) | High Lp (a) (n = 119) | P | |
|---|---|---|---|
| Age (years) | 67.8±10.4 | 67.1±10.7 | 0.57 |
| Male | 237 (81.2%) | 93 (78.2%) | 0.49 |
| Current smoker | 42 (14.4%) | 24 (20.2%) | 0.15 |
| Hypertension | 206 (70.6%) | 80 (67.2%) | 0.51 |
| Diabetes mellitus | 123 (42.1%) | 56 (47.1%) | 0.36 |
| Body mass index (kg/m 2 ) | 23.5±3.2 | 23.1±3.4 | 0.19 |
| Low-density lipoprotein | 80.7±13.9mg/dL | 82.3±12.4mg/dL | 0.28 |
| High-density lipoprotein | 52.2±10.5mg/dL | 54.2±18.1mg/dL | 0.17 |
| Triglycerides | 90.1±26.9mg/dL | 91.8±28.5mg/dL | 0.54 |
| Lipoprotein(a) | 13.0 (7.5-20.6) mg/dL | 41.1 (36.0-57.0) mg/dL | <0.01 |
| eGFR<60mL/min/1.73m 2 | 70 (23.9%) | 35 (29.4%) | 0.26 |
| Left ventricular ejection fraction | 63.3±11.4% | 62.4±11.2% | 0.48 |
| Acute coronary syndrome | 78 (26.7%) | 31 (26.1%) | 0.89 |
| Multivessel disease | 157 (54.9%) | 74 (63.2%) | 0.12 |
| Type B2/C lesion | 193 (79.4%) | 87 (89.7%) | 0.02 |
| Left anterior descending lesion | 137 (46.9%) | 45 (37.8%) | 0.09 |
| Use of medication | |||
| Aspirin | 273 (93.5%) | 110 (92.4%) | 0.34 |
| Antiplatelet drug | 223 (76.4%) | 88 (73.9%) | 0.38 |
| β-blocker | 124 (42.5%) | 51 (42.8%) | 0.92 |
| ACE-I/ARB | 140 (47.9%) | 59 (49.5%) | 0.65 |
| Calcium channel blocker | 128 (43.8%) | 44 (37.0%) | 0.21 |
| Statin | 170 (58.2%) | 76 (63.8%) | 0.25 |
| Oral hypoglycemic agents | 76 (26.0%) | 35 (29.4%) | 0.44 |
| Insulin | 27 (9.2%) | 15 (12.6%) | 0.31 |

| HR | Univariate | P | HR | Multivariate | P | |
|---|---|---|---|---|---|---|
| 95%CI | 95%CI | |||||
| Age | 1.06 | 1.04-1.08 | <0.01 | 1.06 | 1.03-1.09 | <0.01 |
| Gender (F/M) | 1.10 | 0.64-2.05 | 0.74 | |||
| Hypertension | 1.10 | 0.68-1.74 | 0.69 | |||
| Diabetes mellitus | 1.34 | 0.85-2.09 | 0.21 | |||
| Low-density lipoprotein | 0.99 | 0.97-1.01 | 0.23 | |||
| High-density lipoprotein | 1.00 | 0.98-1.01 | 0.92 | |||
| Triglycerides | 1.00 | 0.99-1.01 | 0.82 | |||
| Lipoprotein(a) (High/Low) | 1.61 | 1.02-2.52 | 0.04 | 1.68 | 1.03-2.70 | 0.04 |
| Current smoker | 1.32 | 0.71-2.72 | 0.40 | |||
| eGFR<60 | 1.72 | 1.07-2.71 | 0.03 | 1.34 | 0.80-2.19 | 0.25 |
| Acute coronary syndrome | 1.77 | 1.11-2.78 | 0.02 | 1.82 | 1.08-3.07 | 0.03 |
| Left ventricular ejection fraction | 0.98 | 0.96-0.99 | 0.02 | 0.98 | 0.96-1.01 | 0.27 |
| Multivessel disease | 1.66 | 1.05-2.67 | 0.03 | 1.45 | 0.88-2.42 | 0.15 |
| Type B2/C lesion | 1.14 | 0.52-2.27 | 0.72 | |||
| Left anterior descending lesion | 1.46 | 0.82-2.34 | 0.12 | |||
| β-blockers | 0.81 | 0.49-1.28 | 0.37 | |||
| ACE-I/ARB | 0.83 | 0.52-1.32 | 0.44 | |||
| Statins | 0.63 | 0.39-0.99 | 0.05 | 0.72 | 0.43-1.20 | 0.21 |
Stay updated, free articles. Join our Telegram channel

Full access? Get Clinical Tree


