Balloon pulmonary angioplasty (BPA) may improve hemodynamics and exercise tolerance in patients with chronic thromboembolic pulmonary hypertension (CTEPH). We studied consecutive 25 patients with CTEPH who underwent BPA and evaluated hemodynamics by right-sided heart catheterization. Right ventricular (RV) function was assessed before and after BPA by echocardiography including speckle-tracking echocardiography and 3-dimensional echocardiography. BPA improved the mean pulmonary artery pressure, pulmonary vascular resistance, and cardiac index. BPA also ameliorated the 3-dimentional RV volume, RV ejection fraction, and RV systolic peak strain, all of which were significantly correlated with hemodynamic parameters. The changes in cardiac index were significantly correlated with those in 3-dimentional RV volume index. Furthermore, RV dyssynchrony quantified by the RV strain analyses was ameliorated after BPA even in patients with mild pulmonary hypertension, implicating the merit of BPA in this patient population with CTEPH. BPA not only improved the hemodynamics in patients with CTEPH, but also ameliorated RV remodeling and dyssynchrony as assessed by 3-dimensional echocardiography or speckle-tracking echocardiography. Thus, the assessment of RV function may provide valuable information about the appropriate indication for BPA, its efficacy, and the therapeutic goal for patients with CTEPH.
Chronic thromboembolic pulmonary hypertension (CTEPH) has a poor prognosis because of associated progressive right heart failure. Pulmonary endarterectomy is an established surgical therapy for CTEPH that could improve mortality rates, but its use is limited because of technical difficulties. In contrast, balloon pulmonary angioplasty (BPA) may also be effective to CTEPH and be less invasive. However, the effect of BPA on right ventricular (RV) function has not been fully established. The standard technique for assessing RV hemodynamics is right heart catheterization (RHC). However, RHC cannot evaluate RV function including RV asynergy or RV systolic function and is both invasive and inconvenient in terms of repetitive examination. In contrast, cardiovascular magnetic resonance is a noninvasive method, and useful for the assessment of RV function after BPA in patients with CTEPH. However, cardiovascular magnetic resonance is inconvenient and expensive for repetitive examination. Although conventional echocardiographic techniques can estimate RV performance, quantifying RV function remains difficult because of the complex geometry of the RV chamber. Recently, new echocardiographic techniques have emerged, including 3-dimensional transthoracic echocardiography (3DTTE) and the speckled tracking method; these are hoped to provide more precise evaluation of RV function compared with the conventional echocardiographic parameters. The present study sought to determine the impact of BPA on advanced RV remodeling and dysfunction in patients with CTEPH, relative to hemodynamic improvement using echocardiography.
Methods
The local ethics review committee approved the present study. We studied 25 patients with CTEPH who underwent TTE before and after BPA from November 2012 to May 2014. CTEPH was defined as mean pulmonary arterial pressure (mPAP) >25 mm Hg at rest, measured by RHC, and the selection of BPA versus pulmonary endarterectomy was confirmed by the CTEPH team, according to the inoperability and surgical accessibility to the thrombi. We excluded patients with lung disease, left-sided heart failure including pulmonary capillary wedge pressure >15 mm Hg, and more than mild aortic and/or mitral valvular heart disease. Table 1 details the clinical characteristics of the total population.
| All patients (n=25) | |
|---|---|
| Age (year) | 64.9 ± 15.2 |
| Female | 19 (76%) |
| Body surface area (m 2 ) | 1.63 ± 0.24 |
| Systolic blood pressure (mmHg) | 112 ± 18 |
| Diastolic blood pressure (mmHg) | 68 ± 15 |
| Heart rate (beats/min) | 69 ± 13 |
| WHO functional class I/II/III/IV | 0/4/18/3 |
| Home oxygen therapy | 21 (84%) |
| Medications at baseline | |
| Phosphodiesterase type-5 inhibitor | 18 (72%) |
| Endothelin receptor antagonist | 13 (52%) |
| Prostanoid | 10 (40%) |
| Calcium channel blocker | 5 (20%) |
| Soluble guanylate cyclase stimulator | 2 (8%) |
| Vitamin K antagonist | 25 (100%) |
| Uric acid (mg/dL) | 6.3 ± 1.5 |
| Brain natriuretic peptide (pg/mL) | 161 ± 228 |
| Six minutes walking distance (m) | 324 ± 90 |
| Left ventricular ejection fraction (%) | 72.1 ± 6.7 |
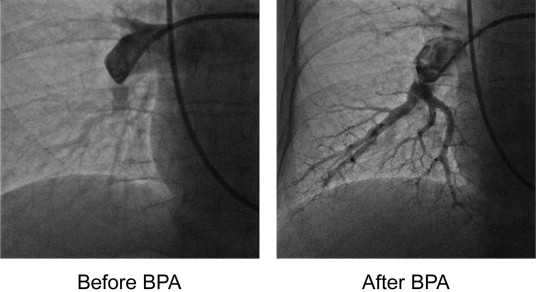
All patients underwent right-sided heart catheterization using a 6Fr or 7Fr Swan-Ganz catheter (Swan-Ganz CCO CEDV; Edwards Lifesciences, Irvine, CA, USA) just before and after BPA. PAP, right atrial pressure (RAP), pulmonary capillary wedge pressure, and cardiac output were measured at the right-sided catheterization. The cardiac output was assessed using the Fick technique and cardiac index (CI) was calculated by dividing cardiac output by body surface area. The pulmonary vascular resistance index (PVR) was calculated using the following formula: PVR = (mPAP − mean pulmonary capillary wedge pressure)/cardiac output. The BPA was performed through the right jugular vein or femoral vein. First, we inserted a 9-Fr indwelling sheath into the approach vessel. Next, a 6-Fr long sheath was advanced to the main pulmonary artery trunk with a 0.035-inch hydrophilic wire. A 6-Fr multipurpose or Amplatz left-guiding catheter was then used to select various target vessels. After engaging the guiding catheter to the target vessel, we tried to cross the 0.014-inch guidewire to the target lesion, and the balloon was inflated until fully expanded. The target vessel diameter was measured by intravascular ultrasound or optimal coherence tomography and the appropriate balloon size was determined. After ballooning, we confirmed the vessel was dilated successfully by angiography, intravascular ultrasound, or optimal coherence tomography ( Figure 1 ). Several BPA sessions were performed for each patient until an mPAP of <25 mm Hg was achieved.
Furthermore, all patients underwent standard echocardiography, 2-dimensional speckle-tracking echocardiography, and 3DTTE using a Vivid-E9 ultrasound system (GE Healthcare, Horten, Norway) before and after BPA. We used established criteria to measure the right chambers. RV end-diastolic and end-systolic areas were assessed using manual planimetry and then RV fractional area change (RVFAC) was calculated. Tricuspid annular plane systolic excursion was measured using the apical 4-chamber view (CV) adjusted to optimize RV structures and to achieve proper orientation for M-mode measures. RV index of myocardial performance was determined as the sum of the isovolumic contraction time and isovolumic relaxation time divided by the ejection time. RAP was estimated by inferior vena cava (IVC) diameter from the long-axis subcostal view and its phasic response to respiration. RAP was estimated as 3 mm Hg if the IVC was <21 mm in diameter and collapsed >50% with a sniff at the junction of the hepatic veins and 15 mm Hg if the IVC was >21 mm in diameter and collapsed <50% with a sniff. Indeterminate cases in which the IVC diameter and collapse did not fit this paradigm were assigned an intermediate value of 8 mm Hg. The peak tricuspid regurgitation (TR) velocity (meter/s) was determined using continuous-wave Doppler using the highest velocity obtained from multiple views, and TR pressure gradient was calculated by 4 × (peak TR velocity). RV systolic pressure was obtained by adding the TR pressure gradient and RAPs. The velocity S′ of RV was obtained by tissue Doppler imaging from RV-focused views at the lateral corner of the tricuspid annulus.
The regional RV myocardial strain was measured by 2-dimensional speckle-tracking echocardiography. Gray-scale imaging of the 4 CV was obtained, and recordings were processed with acoustic-tracking software (EchoPAC; GE Healthcare, Horten, Norway), allowing offline semiautomated speckle-based strain analysis. Briefly, lines were first manually traced along the RV endocardium and then an additional epicardial line was automatically generated by the software to create a region of interest. After manually adjusting the region of interest shape, the software divided the RV region into 6 segments and generated the longitudinal strain curve ( Figure 2 ). We set the zero strain point as the time from the beginning of the QRS wave by electrocardiogram and measured negative peak strain during ventricular systole. In addition, RV dyssynchrony was quantified using the SD of the intervals from QRS onset to peak systolic strain for the 6 segments.
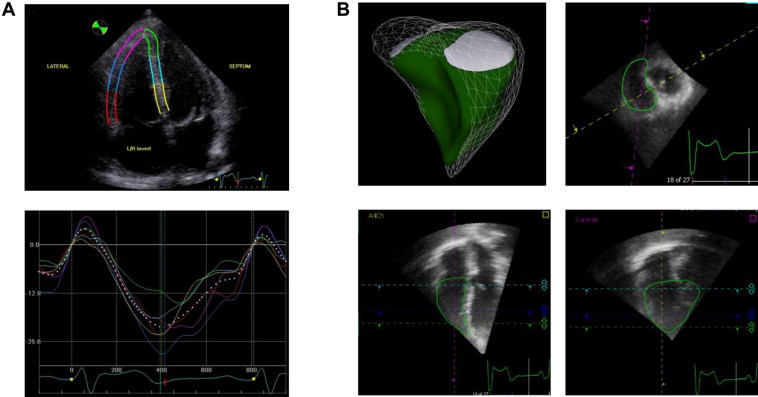
The 3-dimensional echocardiographic images were obtained from the apical window with the patient in the same position as for 2-dimentional echocardiography. Echocardiographic imaging results were stored digitally for offline analysis using TomTec 4D analysis software (4D RV Function; TomTec, Munich, Germany). Within the 3-dimensional data set, 3 orthogonal main cut planes were selected to define the end-diastolic and end-systolic frames within the sequence as well as several landmarks ( Figure 2 ). On the basis of the initial view adjustment and the landmarks, the program automatically provides 4 CV and sagittal and coronal RV views. RV end-diastolic volume, RV end-systolic volume, and RV ejection fraction (RVEF) were measured from each 3-dimensional echocardiographic data set. Tracing was done through the bases of the papillary muscles.
Quantitative results are expressed as mean ± SD. Changes in hemodynamic and RV functional parameters before and after BPA were compared using a paired t test. The correlations between variables were assessed by liner regression analysis. A p value <0.05 was considered statistically significant. All statistical analyses were performed using JMP 11.0 statistical software (SAS Institute, Cary, North Carolina).
Results
We enrolled 25 consecutive patients with CTEPH. The baseline clinical backgrounds for enrolled were listed in Table 1 .
Table 2 summarizes the hemodynamic data, which were all improved significantly by BPA that led to a significant improvement in the hemodynamic parameters. Three-dimensional echocardiographic images of RV were successfully analyzed in 23 patients (92%), whereas longitudinal 2-dimensional RV strain measurement from all segments was possible in 25 patients (100%). The intraobserver and interobserver reproducibility of 3-dimensional and strain parameters was shown to be acceptable. The intraobserver variability was 4.6 ± 6.4% for 3-dimensional right ventricular end-diastolic volume index and 4.9 ± 5.2% for global right ventricular longitudinal strain (RVLS); the corresponding values of interobserver variability were 6.9 ± 5.2% and 8.8 ± 4.3%. The changes in echocardiographic RV parameters before and after BPA were as listed in Table 3 . The clinical parameters assessed were World Health Organization-functional class (WHO-FC), heart rate, and plasma levels of brain natriuretic peptide and uric acid. WHO-FC and plasma brain natriuretic peptide were significantly improved after BPA. The echocardiographic parameter, pulmonary arterial systolic pressure, was significantly decreased after BPA, whereas there were no significant changes in left ventricular parameters after BPA ( Table 4 ). The RV basal diameters, RVFAC, and mid free wall (MFW) RVLS were significantly improved after BPA, although other parameters (tricuspid annular plane systolic excursion, RV S′, and RV index of myocardial performance) were not ( Table 3 ).
| Before balloon pulmonary angioplasty (n=25) | After balloon pulmonary angioplasty (n=25) | p -value | |
|---|---|---|---|
| Mean pulmonary arterial pressure (mmHg) | 38.9 ± 8.2 | 17.6 ± 3.7 | <0.001 |
| Mean right atrium pressure (mmHg) | 5.4 ± 2.8 | 1.6 ± 1.7 | <0.001 |
| Pulmonary capillary wedge pressure (mmHg) | 8.4 ± 3.7 | 6.1 ± 2.7 | 0.0024 |
| Pulmonary vascular resistance (dyne • sec • cm -5 ) | 733 ± 324 | 228 ± 96 | <0.001 |
| Cardiac index (L/min/m 2 ) | 2.3 ± 0.5 | 3.2 ± 0.7 | <0.001 |
Stay updated, free articles. Join our Telegram channel

Full access? Get Clinical Tree


