The prognostic implications of flow, assessed by stroke volume index (SVi), and left ventricular (LV) global longitudinal strain on survival of patients with low-gradient severe aortic stenosis (AS) and preserved LV ejection fraction are debated. The aim of this study was to evaluate the impact of flow and LV global longitudinal strain on survival in these patients treated with aortic valve replacement (AVR). Patients with low-gradient severe AS with preserved LV ejection fraction treated with AVR (n = 134, mean age 76 ± 10 years, 50% men) were included in the present study. Aortic valve hemodynamics and LV function were assessed with 2-dimensional, Doppler and speckle-tracking echocardiography before AVR. Patients were dichotomized on the basis of low (SVi ≤35 ml/m 2 ) or normal (SVi >35 ml/m 2 ) flow and impaired (>−15%) or more preserved (≤−15%) global longitudinal strain. The end point was all-cause mortality. During a median follow-up period of 1.8 years (interquartile range 0.5 to 3) after AVR, 26 patients (19.4%) died. Survival was better for patients with SVi >35 ml/m 2 or global longitudinal strain ≤−15% compared with those with SVi ≤35 ml/m 2 or global longitudinal strain >−15% (log-rank p = 0.01). Atrial fibrillation (hazard ratio 5.40, 95% confidence interval 1.81 to 16.07, p = 0.002) and chronic kidney disease (hazard ratio 3.67, 95% confidence interval 1.49 to 9.06, p = 0.005) were the clinical variables independently associated with all-cause mortality. The addition of global longitudinal strain (chi-square = 19.87, p = 0.029, C-statistic = 0.74) or SVi (chi-square = 29.62, p <0.001, C-statistic = 0.80) to a baseline model including atrial fibrillation and chronic kidney disease (chi-square = 14.52, C-statistic = 0.68) improved risk stratification of these patients. In conclusion, flow and LV global longitudinal strain are independently associated with survival after AVR in patients with low-gradient severe AS with preserved LV ejection fraction.
Highlights
- •
Survival of patients with low-gradient severe AS with preserved LVEFs was evaluated.
- •
The prognostic association of flow and LV global longitudinal strain was assessed.
- •
Global longitudinal strain and flow were independently associated with survival after AVR.
Decision making for patients with low-gradient (mean pressure gradient ≤40 mm Hg) severe aortic stenosis (AS) (aortic valve area index ≤0.6 cm 2 /m 2 ) with preserved left ventricular (LV) ejection fraction (LVEF) (≥50%) has been source of debate. Although some studies have reported better survival of these patients after aortic valve replacement (AVR), others have suggested that these patients have a prognosis comparable with that of patients with moderate AS. The underlying mechanisms influencing the outcomes of these patients remain unclear. Despite having preserved LVEFs, these patients have impaired LV mechanics as assessed with LV global longitudinal strain speckle-tracking echocardiography and may have normal or low forward flow evaluated by stroke volume index (SVi). The influence of flow and LV global longitudinal strain on the prognosis of patients with low-gradient severe AS with preserved LVEFs remains unexplored. The aim of the present evaluation was to assess the relative merits of flow and LV global longitudinal strain to predict outcomes in patients with severe AS, low gradients, and preserved LVEFs who underwent AVR.
Methods
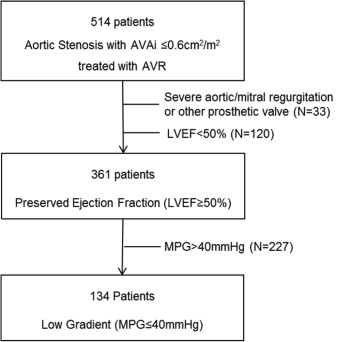
Patients with symptomatic low-gradient severe AS and preserved LVEF who underwent AVR were identified from an ongoing registry and were included in the present analysis ( Figure 1 ).
Patients were clinically evaluated, and data were collected on a dedicated departmental cardiology information system (EPD-Vision; Leiden University Medical Center, Leiden, The Netherlands) and analyzed retrospectively. Demographics, clinical symptoms (New York Heart Association [NYHA] functional class), cardiovascular risk factors, medications, and the presence of atrial fibrillation, chronic kidney disease (defined as moderately to severely decreased creatinine clearance <45 ml/min), and chronic obstructive pulmonary disease were collected. The institutional review board approved this retrospective analysis of clinically acquired data and waived the need for written patient informed consent.
All patients underwent complete transthoracic echocardiographic examinations using commercially available ultrasound systems (Vivid 7 and E9; GE Vingmed Ultrasound AS, Horten, Norway) equipped with 3.5-MHz or M5S transducers. Two-dimensional, color, pulsed- and continuous-wave Doppler data were acquired in the parasternal and apical views and were stored digitally and analyzed offline on a dedicated workstation (EchoPAC version 112.0.1; GE Vingmed Ultrasound AS). LV dimensions and wall thickness were measured from the parasternal long-axis view according to current recommendations. LV mass was estimated according to the formula of Devereux et al. Relative wall thickness and the ratio of LV mass to LV end-diastolic volume were calculated as previously described. LV end-diastolic and end-systolic volumes were measured in the apical 4- and 2-chamber views and indexed to body surface area, and the LVEF was derived using Simpson’s biplane method. SVi was estimated by multiplying LV outflow tract area by LV outflow tract velocity-time integral on pulsewave Doppler recordings and then indexed to body surface area. Cardiac output was calculated as the product of stroke volume and heart rate. Stroke work was calculated by the formula (mean arterial pressure + mean peak gradient) × stroke volume × 0.0136 and indexed to LV mass. Peak and mean pressure transaortic gradients were measured in the 3- or 5-chamber apical view according to the simplified Bernoulli equation. Aortic valve area was calculated with the continuity equation and then indexed to body surface area. In addition, energy loss index, valvuloarterial impedance, systemic vascular resistance, and systemic arterial compliance were calculated as previously described.
For further evaluation of LV systolic function, off-line 2-dimensional speckle-tracking longitudinal strain analysis was performed on a workstation with commercially available software (EchoPAC version 112.0.1). From the apical 3-, 4-, and 2-chamber views, global longitudinal strain was measured and averaged. Transmitral pulsewave Doppler was used for assessment of LV diastolic function. Additionally, left atrial volume was evaluated according to the biplane area-length method and then indexed to body surface area. Coexisting valvular dysfunction was assessed on the basis of the European Association of Echocardiography and American Society of Echocardiography recommendations.
On the basis of SVi, patients were divided into 2 categories: low flow was defined as SVi ≤35 ml/m 2 and normal flow as SVi >35 ml/m 2 . Patients were also categorized as having LV global longitudinal strain ≤−15% or >−15%.
The end point of the study was all-cause mortality. All patients were followed up after AVR. Survival data were collected either from the departmental cardiology information system or the Social Security Death Index and were complete for all subjects included in the study.
Categorical variables are expressed as count (frequency) and continuous variables as mean ± SD. Continuous variables were compared between the 2 groups (survivors vs nonsurvivors) with Student’s t test or the Mann-Whitney U test, as appropriate, and categorical variables with the chi-square test or Fisher’s exact test, as appropriate. The intra- and interobserver reproducibility of LV global longitudinal strain and SVi measurements was assessed by the intraclass correlation coefficient. The cumulative event rates were calculated on the basis of the Kaplan-Meier method, and comparisons between groups were assessed by log-rank test. Cox proportional-hazards ratio regression analyses were performed to investigate univariate and multivariate correlates of all-cause mortality. Hazard ratios and 95% confidence intervals (CIs) were reported. Variables with univariate p values <0.10 were entered in the multivariate analysis. The incremental value of flow and LV global longitudinal strain category over a baseline clinical model was estimated by the significant change in the chi-square statistic of the baseline model. The relative fit of each model was calculated with the −2 log likelihood. Moreover, C-statistics were used for model comparison. Statistical significance was considered for p values <0.05. Statistical analysis was performed with SPSS version 20 (SPSS, Inc., Chicago, Illinois).
Results
The baseline characteristics of 134 patients (mean age 75.5 ± 9.9 years, 50% men) are listed in Table 1 . Surgical AVR was performed in 71 patients (53%) and transcatheter AVR in the remaining 63 (47%). Echocardiographic data are listed in Table 2 . Low flow was identified in 48 patients (36%) and normal flow in 86 (64%), whereas LV global longitudinal strain >−15% was observed in 67 patients (51%) and ≤−15% in 65 (49%). LV global longitudinal strain measurement was feasible in 132 patients (98%). The intraclass correlation coefficients for intra- and interobserver reproducibility were 0.95 (95% CI 0.69 to 0.99) and 0.87 (95% CI 0.50 to 0.97) for LV global longitudinal strain, respectively, and 0.90 (95% CI 0.60 to 0.97) and 0.88 (95% CI 0.55 to 0.97) for SVi, respectively.
| Variable | Overall (N=134) | Survivors (N=108) | Non-Survivors (N=26) | p-value |
|---|---|---|---|---|
| Age (years) | 76 ± 10 | 75 ± 11 | 76 ± 5 | 0.24 |
| Male | 67 (50%) | 53 (49%) | 14 (54%) | 0.66 |
| Body mass index (Kg/m 2 ) | 26 ± 4 | 26 ± 4 | 26 ± 4 | 0.92 |
| Body surface area (m 2 ) | 1.9 ± 0.2 | 1.8 ± 0.2 | 1.9 ± 0.2 | 0.64 |
| Atrial fibrillation | 10 (8%) | 5 (5%) | 5 (21%) | 0.008 |
| Chronic kidney disease | 28 (21%) | 16 (15%) | 12 (46%) | 0.001 |
| Hypertension | 98 (74%) | 76 (71%) | 22 (85%) | 0.16 |
| Diabetes mellitus | 34 (25%) | 24 (22%) | 10 (39%) | 0.09 |
| Hyperlipidemia | 69 (52%) | 59 (56%) | 10 (39%) | 0.12 |
| Smoker | 44 (34%) | 35 (33%) | 9 (36%) | 0.77 |
| Family history of CAD | 34 (27%) | 28 (27%) | 6 (24%) | 0.75 |
| Coronary artery disease | 83 (69%) | 67 (69%) | 16 (67%) | 0.76 |
| Previous cardiac surgery | 33 (25%) | 22 (20%) | 11 (42%) | 0.02 |
| Myocardial infarction | 19 (14%) | 13 (12%) | 6 (23%) | 0.15 |
| Stroke | 16 (12%) | 11 (10%) | 5 (20%) | 0.17 |
| Chronic obstructive pulmonary disease | 35 (26%) | 24 (22%) | 11 (42%) | 0.04 |
| Logistic EuroSCORE (%) | 14 ± 12 | 13 ± 11 | 18 ± 13 | 0.08 |
| ACEi / ARB | 66 (50%) | 49 (46%) | 17 (65%) | 0.07 |
| Beta-blocker | 77 (58%) | 64 (60%) | 13 (50%) | 0.36 |
| Calcium channel blocker | 39 (30%) | 28 (26%) | 11 (42%) | 0.12 |
| Statin | 79 (59%) | 64 (60%) | 15 (58%) | 0.84 |
| Diuretics | 62 (47%) | 47 (44%) | 15 (58%) | 0.21 |
| NYHA class I | 40 (30%) | 36 (33%) | 4 (15%) | 0.04 |
| II | 46 (34%) | 37 (34%) | 9 (35%) | |
| III | 38 (28%) | 30 (28%) | 8 (31%) | |
| IV | 10 (8%) | 5 (5%) | 5 (19%) |
| Overall (N=134) | Survivors (N=108) | Non-Survivors (N=26) | p-value | |
|---|---|---|---|---|
| Aortic valve area (cm 2 ) | 0.8 ± 0.1 | 0.8 ± 0.1 | 0.8 ± 0.2 | 0.13 |
| Aortic valve area index (cm 2 /m 2 ) | 0.4 ± 0.1 | 0.5 ± 0.1 | 0.4 ± 0.1 | 0.12 |
| Peak velocity (m/s) | 3.6 ± 0.4 | 3.6 ± 0.4 | 3.6 ± 0.4 | 0.74 |
| Mean gradient (mmHg) | 32 ± 6 | 32 ± 6 | 32 ± 7 | 0.93 |
| Energy loss index (cm 2 /m 2 ) | 0.5 ± 0.1 | 0.5 ± 0.1 | 0.4 ± 0.1 | 0.09 |
| Valvulo-arterial impedance (mmHg/ml/m 2 ) | 4.9 ± 1.5 | 4.7 ± 1.4 | 5.6 ± 1.5 | 0.004 |
| Systemic vascular resistance (mmHg.min/l) | 1741 ± 504 | 1695 ± 500 | 1932 ± 485 | 0.03 |
| Systemic arterial compliance (ml/mmHg/m 2 ) | 0.6 ± 0.2 | 0.6 ± 0.2 | 0.6 ± 0.1 | 0.16 |
| Septal wall thickness in diastole (cm) | 1.3 ± 0.2 | 1.3 ± 0.2 | 1.4 ± 0.3 | 0.11 |
| Posterior wall thickness in diastole (cm) | 1.2 ± 0.2 | 1.2 ± 0.2 | 1.3 ± 0.2 | 0.08 |
| LVEDDi (cm/m 2 ) | 2.5 ± 0.3 | 2.5 ± 0.3 | 2.5 ± 0.3 | 0.69 |
| LVESDi (cm/m 2 ) | 1.5 ± 0.4 | 1.5 ± 0.3 | 1.5 ± 0.4 | 0.62 |
| Left ventricular mass index (g/m 2 ) | 121 ± 32 | 118 ± 32 | 131 ± 31 | 0.06 |
| Relative wall thickness (%) | 56 ± 13 | 55 ± 13 | 58 ± 17 | 0.31 |
| LVEDVi (ml/m 2 ) | 49 ± 17 | 49 ± 17 | 47 ± 19 | 0.49 |
| LVESVi (ml/m 2 ) | 20 ± 8 | 20 ± 8 | 19 ± 8 | 0.85 |
| Left ventricular mass / LVEDV ratio (g/ml) | 2.7 ± 1.2 | 2.6 ± 1.1 | 3.2 ± 1.3 | 0.03 |
| Ejection fraction (%) | 61 ± 6 | 62 ± 6 | 59 ± 5 | 0.08 |
| Stroke volume index (ml/m 2 ) | 38 ± 10 | 39 ± 9 | 33 ± 10 | 0.001 |
| Cardiac Output (l/min) | 4.8 ± 1.1 | 4.9 ± 1.1 | 4.4 ± 0.9 | 0.03 |
| Cardiac Index (l/min/m 2 ) | 2.6 ± 0.6 | 2.6 ± 0.6 | 2.3 ± 0.5 | 0.02 |
| Stroke Work (g.m) | 124 ± 35 | 127 ± 34 | 110 ± 16 | 0.02 |
| Stroke Work /100g (g.m) | 60 ± 26 | 62 ± 25 | 48 ± 25 | 0.01 |
| Global longitudinal strain (%) | -15 ± 3 | -15 ± 3 | -13 ± 3 | 0.005 |
| E wave velocity (cm/s) | 77 ± 28 | 76 ± 29 | 81 ± 25 | 0.39 |
| Deceleration time (msec) | 257 ± 100 | 263 ± 98 | 232 ± 106 | 0.15 |
| Left atrial volume index (ml/m 2 ) | 37 ± 15 | 37 ± 16 | 37 ± 15 | 0.95 |
| Aortic regurgitation no/mild/moderate, n | 56/66/12 | 42/54/12 | 14/12/0 | 0.13 |
| Mitral regurgitation no/mild/moderate, n | 67/53/14 | 55/41/12 | 12/12/2 | 0.71 |
During a median follow-up period of 1.8 years (interquartile range 0.5 to 3) after AVR, 26 patients (19.4%) died. There were no patients lost to follow-up. At baseline, patients who died more frequently exhibited associated co-morbidities (atrial fibrillation, chronic kidney disease, chronic obstructive pulmonary disease), previous cardiac surgery, and worse NYHA functional class compared with survivors ( Table 1 ). Aortic valve hemodynamics were comparable between nonsurvivors and survivors. However, nonsurvivors had higher LV global afterload, more concentrically remodeled left ventricles, lower flow, and more impaired LV global longitudinal strain than survivors ( Table 2 ).
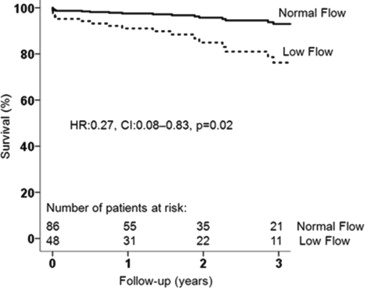
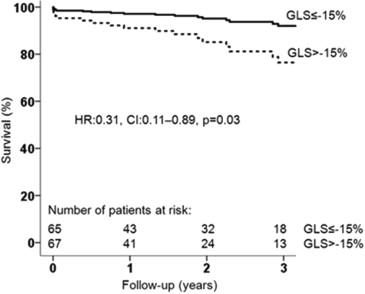
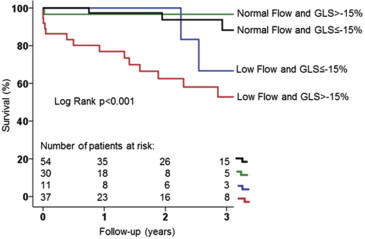
When dichotomizing the population on the basis of low flow and normal flow, patients with low flow had higher mortality rates at 1-, 2-, and 3-year follow-up after AVR than those with normal flow (16.7%, 25.0%, and 33.3% vs 2.3%, 3.5%, and 4.6%, respectively, log-rank p <0.001). This difference remained significant after adjusting for age, atrial fibrillation, chronic obstructive pulmonary disease, chronic kidney disease, NYHA functional class, and LV global longitudinal strain; patients with normal flow had significantly better outcomes than low-flow patients ( Figure 2 ). When dividing the population according to the prespecified LV global longitudinal strain cut-off value, patients with more impaired global longitudinal strain (>−15%) had significantly increased mortality at 1, 2, and 3 years after AVR in comparison with patients with more preserved global longitudinal strain (≤−15%) (mortality rate 13.4%, 19.4%, and 22.4% vs 1.5%, 3.1%, and 7.7%, respectively, log-rank p = 0.01). Survival remained significantly higher in the cohort of patients with global longitudinal strain ≤−15% after adjusting for age, atrial fibrillation, chronic obstructive pulmonary disease, chronic kidney disease, NYHA functional class, and SVi ( Figure 3 ). Figure 4 shows the cumulative survival for patients grouped according to global longitudinal strain and flow. Patients with global longitudinal strain >−15% and SVi ≤35 ml/m 2 had the worse prognosis. There were 6 patients who died <30 days after AVR (50% underwent transcatheter AVR). All of them (100%) had impaired global longitudinal strain (>−15%), and 5 (83%) had low flow. Perioperative mortality was significantly higher in the group with more impaired global longitudinal strain (>−15%) compared with the group with ≤−15% (log-rank p = 0.015) and in the low-flow compared with the normal-flow (log-rank p = 0.014) group.
The univariate Cox regression analysis demonstrated that the presence of atrial fibrillation, chronic obstructive pulmonary disease, chronic kidney disease, previous myocardial infarction, and previous cardiac surgery were associated with increased all-cause mortality risk in this population ( Table 3 ). Among the echocardiographic variables, lower valvuloarterial impedance and LV mass/LV end-diastolic volume ratio were associated with improved survival after AVR. Atrial fibrillation and chronic kidney disease were independently associated with mortality after AVR and were selected to build a baseline clinical model to test the independent association between flow and global longitudinal strain with survival ( Table 3 ). Global longitudinal strain >−15% and each 1% impairment in global longitudinal strain were independently associated with all-cause mortality ( Table 4 ). In addition, SVi ≤35 ml/m 2 and each 5 ml/m 2 decrease in SVi were independently associated with all-cause mortality ( Table 4 ).
| Univariate Analysis | Multivariate Analysis | |||||
|---|---|---|---|---|---|---|
| HR | 95% CI | p-value | HR | 95% CI | p-value | |
| Clinical Variables | ||||||
| Age (years) | 1.04 | 0.99-1.09 | 0.08 | 1.01 | 0.93-1.09 | 0.78 |
| Male gender | 1.49 | 0.68-3.29 | 0.32 | |||
| Body mass index (Kg/m 2 ) | 1.01 | 0.91-1.13 | 0.81 | |||
| Transcatheter aortic valve replacement | 1.69 | 0.74-3.89 | 0.21 | |||
| Logistic EuroScore (%) | 1.03 | 1.00-1.06 | 0.03 | 0.98 | 0.92-1.06 | 0.69 |
| Coronary artery disease | 0.96 | 0.40-2.27 | 0.92 | |||
| Chronic kidney disease | 2.60 | 1.18-5.74 | 0.02 | 3.20 | 1.10-9.31 | 0.03 |
| Atrial fibrillation | 3.45 | 1.26-9.40 | 0.02 | 4.63 | 1.22-17.62 | 0.02 |
| Hypertension | 2.28 | 0.78-6.69 | 0.13 | |||
| Diabetes | 1.64 | 0.72-3.71 | 0.24 | |||
| Hyperlipidemia | 0.63 | 0.28-1.43 | 0.23 | |||
| Previous cardiac surgery | 2.37 | 1.06-5.29 | 0.04 | 0.97 | 0.20-4.71 | 0.97 |
| Myocardial infarction | 2.96 | 1.16-7.55 | 0.02 | 2.57 | 0.55-12.04 | 0.23 |
| Stroke | 2.08 | 0.76-5.65 | 0.15 | |||
| Chronic obstructive pulmonary disease | 2.57 | 1.15-5.77 | 0.02 | 1.45 | 0.49-4.25 | 0.50 |
| New York Heart Association, class I | Ref | 0.08 | 0.62 | |||
| II | 3.20 | 0.96-10.47 | 0.06 | 1.75 | 0.45-6.80 | 0.42 |
| III | 2.72 | 0.77-9.27 | 0.10 | 2.07 | 0.51-8.33 | 0.31 |
| IV | 5.63 | 1.49-21.15 | 0.01 | 2.82 | 0.55-14.26 | 0.21 |
| Echocardiographic Variables | ||||||
| Aortic valve area index (cm 2 /m 2 ) | 0.06 | 0.001-5.18 | 0.21 | |||
| Mean pressure gradient (mmHg) | 0.98 | 0.93-1.05 | 0.61 | |||
| Valvulo-arterial impedance (mmHg/ml/m 2 ) | 1.26 | 1.02-1.57 | 0.03 | 1.08 | 0.80-1.49 | 0.66 |
| Left ventricular mass index (g/m 2 ) | 1.01 | 0.99-1.02 | 0.23 | |||
| Relative wall thickness (%) | 1.02 | 0.99-1.05 | 0.12 | |||
| Left ventricular mass / LVEDV ratio (g/ml) | 1.63 | 1.27-2.10 | 0.001 | 1.44 | 0.95-2.17 | 0.08 |
| Left ventricular ejection fraction (%) | 0.94 | 0.87-1.00 | 0.07 | 0.97 | 0.89-1.06 | 0.56 |
| Left atrium volume index (ml/m 2 ) | 0.99 | 0.97-1.02 | 0.71 | |||
Stay updated, free articles. Join our Telegram channel

Full access? Get Clinical Tree


